Community Detection in Social Network with Outlier Recognition

Adv. Sci. Technol. Eng. Syst. J. 3(2), 21–27 (2018);
 DOI: 10.25046/aj030203
Exploring communities and outliers in Social Network is based on considering of some nodes have overlapped neighbor node within the same group as well as some nodes have no any link to the other node or have no any overlapped value. The existing approaches are based on the overlapping community detection method were only defined the overlap nodes or group of overlap nodes without thinking of which nodes might have individual communities or which nodes are outliers. Detecting communities can be used the similarity measure based on neighborhood overlapping of nodes and identified nodes so called outliers which cannot be grouped into any of the communities. This paper proposed method to detect communities and outliers from Edge Structure with neighborhood overlap by using nodes similarity. The result implies the best quality with modularity measurement which leads to more accurate communities as well as improved their density after removing outliers in the network structure.
1. Introduction
This paper is an extension of work originally presented in 18thIEEE/ACIS International Conference on Software Engineering, Artificial Intelligence, Networking and parallel/Distributed Computing (SNPD 2017) [1] is used undirected and unweighted graph data based on overlapping neighborhood. It is explicitly focused on edge structure to detect outliers and significant communities with nodes similarity. Unfortunately, the number of outliers that implemented is higher than that we expected. Therefore, we continue improve our proposed approach to get the significant result by detecting outliers and community.
Social networks can be considered in graph theory point of view. Thinking of detection community in Social networks plays the important role in recent year. It is defined the presence of groups of nodes that are high tightly links connected with each other than with less links connected to nodes of different groups. The challenges in considering of community detection method are become popular in Social Network. The previous authors had finished thinking about them in various points of corners. In overlapping community detection method were only defined the overlap nodes or group of overlap nodes without thinking of which nodes might be included in its own individual communities . Then, the consideration of community detection does not force each node into a certain group, some independent nodes, which cannot be grouped into any communities, are allowed far outside the detected groups can be measured by the predefined threshold of minimal valid size (mvs) of communities as outliers. However, there are still challenges in considering of some nodes have no any common node within the same group as well as some nodes have no any link to the other node.
It can be used similarity measure based on neighborhood overlapping of nodes to organize communities and to identify outliers which cannot be grouped into any of the communities.
In this paper, we detect communities and outliers from Edge Structure with neighborhood overlap by using nodes similarity. This paper explores the use of neighborhood overlapping by using vertex similarity method for detecting outlier and significant
community. The heart of this approach is to represent the underlying dataset as an undirected graph, where a user refers to each node and friendship between two users represents each edge. Before we measure the similarity among neighborhood overlap, finding seed node by using the degree centrality is necessary which is designed to find nodes that are most “central” to the graph. We operate similarity from the most centrality node and its neighborhood nodes. The values of zero similarity are then used to identify as outliers. To illustrate, consider tiny graph which contain8 nodes and 11 edges as shown in Figure 1. Upon applying communities, rounded with two circles are group, and node h so called outlier is saturated with outside them. It can be seen clearly the significant communities and outliers in this toy example.
This paper proposed the method to detect communities, nodes which are high tightly linked each other as community and outliers which do not have links overlap values with another.
The rest of paper is organized as follows. We briefly surveyed related work in section 2. In section 3, we describe the background methodology of our work. And then, we briefly describe about our propose system in section 4. In section 5, we discuss about the experiment and evaluation of our work. Then, we conclude our work in section 6 and talk about our future idea.
2. Related Work
As described in section 1, this paper is an extension of work originally presented in 18thIEEE/ACIS International Conference on Software Engineering, Artificial Intelligence, Networking and parallel/Distributed Computing (SNPD 2017) [1] is used undirected and unweighted graph data based on overlapping neighborhood. It was explicitly focused on edge structure to detect outliers and significant communities with nodes similarity. Unfortunately, the number of outliers that implemented is higher than that we expected. Therefore, we continue improve our proposed approach to get the significant result by detecting outliers and community.
Many approaches of community and outlier detection algorithm have been proved over years. Each trend has efficient and effective in their ways. The proposal of a community discovery algorithm for large networks that iteratively finds communities based on only on local information only without considering the global information which was described in [2], this work is cited it in section. The paper based on considering of defining and evaluation networks community based on ground-truth [3] was discussed how to evaluate and measure the proposed system by comparing the previous and extracted community. In [4], the authors used proximity and random walks, to assess the normality of nodes in bipartite graphs. On the other hand, in [5], the authors proposed the one could use to compute various measures associated with the nodes in the given graph structure, dyads, triads, egonets, communities, as well as the global graph structure. The paper which was proposed an algorithm to detect anomalous nodes in weighted graphs is called OddBall was discussed in [6] that easily reveal nodes with strange behavior. However, it was only considered the side of outlier without community. This work is used some methods in the synthesis Lectures on Data Mining and Knowledge Discovery which is describe in [7] was the series publications on topics pertaining to data mining, web mining, text mining, and knowledge discovery, including tutorials and case studies.
In [8] , the authors proposed the efficient algorithm combined the hierarchical and spectral clustering in non-overlapping community. Then, [9] was represented the new community detection method on network model. In [10], the authors described modularity and community structure in networks based on the problem of detecting and characterizing this community structure was one of the outstanding issues in the study of networked systems. The proposed method for detecting such communities, built around the idea of using centrality indices to find community boundaries was described in [11] . [12] was presented several key features of Gephi in the context of interactive exploration and interpretation of networks. In [13], the authors proposed the method of detecting outliers with community by using minimum valid size (mvs). If the minimum size was 2, it would be chosen the single node and marked it as outlier. In [14], the authors surveyed on Social Community Detection which was also specially focus on to community evaluation since this step becomes important in social data mining. The results of proposed method of applying the metric, modularity, and several popular community quality metrics to two real dynamic networks was described in [15]. Continually, in [16], the authors discussed the attempting of a thorough exposition of the topic, from the definition of the main elements of the problem, to the presentation of most methods developed, with a special focus on techniques designed by statistical physicists, from the discussion of crucial issues like the significance of clustering and how methods should be tested and compared against each other, to the description of applications to real networks. Then, the paper in [17] was presented the graph-based approaches to uncovering anomalies in domains where the anomalies consist of unexpected entity/relationship deviations that resemble non-anomalous behavior. Using synthetic and real-world data, it was evaluated the effectiveness of these algorithms at discovering anomalies in a graph-based representation of data. The original citation of dataset, Zachary Karate Club was described in [18]. The paper was presented by the algorithms OCNS for detecting community overlapping base on node similarity was discussed in [19]. The following sections were described the method of the above references in detail which will be the background methodology for this paper.
3. Basic Definitions and Notations
3.1. Outliers
Nodes which have no overlapped values to its adjacent nodes as well as each node in a graph cannot be grouped into any of the communities is defined outliers. This system is based on edge structure approach in the graph to remove outliers before detecting community.
3.2. Node Degree and Its Neighborhood
In network , the degree of any node is the number of nodes adjacent to . Generally, the more degree that the node has, the more important it will be. Two vertices and are called neighbors, if they are connected by an edge. Let be the neighborhood of vertex in a graph, i.e., the set of vertices that are directly connected to via an edge.
3.3. Community
Communities in Social network can be defined as group of nodes which have more links connecting nodes of the same group and comparatively less links connecting nodes of different groups. Communities may be groups of related individuals in social networks. Identifying communities in a network can be provided valuable information about the structural properties of network, the interactions among nodes in the communities, and the role of the nodes in each community. In an undirected graph (?, E), where the total number of node, |?|=? and total number of edges,|?|=? are defined. We can identify set of communities such that ????={?1′,?2′,……..,???′} where and ?? is the total number of communities Coms should satisfy, ??′⋂??′=?.
Thus, the goal of community detection is to identify sets of nodes with a common (often external/latent) function based only the connectivity structure of the network. Then it can be considered an axiomatic approach and define four intuitive properties that communities would ideally have. Intuitively, a “good” community is cohesive, compact, and internally well connected while being also well separated from the rest of the network. This allows us to characterize which connectivity patterns a given structural definition detects and which ones it misses.
3.4. Degree Centrality
The importance of a node is determined by the number of nodes adjacent to it. The larger the degree of node, the more important the node is. Those high-degree nodes naturally have more impact are considered to be more important. The degree centrality is defined as
![]() When one needs to compare two nodes in different networks, a normalized degree centrality should be used,
When one needs to compare two nodes in different networks, a normalized degree centrality should be used,
![]() Here, is the number of nodes in a network. It is the proportion of nodes that are adjacent to node .
Here, is the number of nodes in a network. It is the proportion of nodes that are adjacent to node .
Let denote the neighbors of node . Given a link the neighborhood overlap is defined as;
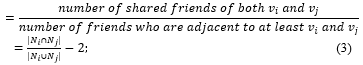 We have in the denominator just to exclude ??? from the set . If there are no overlap vertices in any two means , we can identified as outliers of . Assuming like that, our work identify outliers are appeared with among separated communities.
3.5. Vertex Similarity
It can be assumed that communities are groups of vertices similar to each other. We can compute the similarity between each pair of vertices after searching seed nodes. Most existing similarity method are based on the measurement of distance called Euclidean, Manhattan and etc., Although, to considered the similarity between selected node and is neighborhood, Jaccard Similarity is more convenient in this work which we will measure the similarity based on the neighborhood overlap of seed nodes.
3.6. Graph
The definition of Social network can be imaged as graphs, users or things might be nodes and their relationship might be edges. This system will be represented their social network as an undirected and unweighted graph which mean no distinction between the two vertices associated with each edge. The notation of a graph G = (V,E) consists of two sets V and E. The elements of V = {v1, v2, . . . ,vN} are the nodes or vertices of the graph G where each vertex vi is associated with the instance xi from the input data X and the cardinality of |V | is N. The elements of E = {e1, e2, . . . ,eM} are links or edges between nodes and the cardinality of |E| is M. An edge connecting the vertices viand vj is denoted by eij.
4. Community Detection Approach
There are two main components will be used to detect communities. They are (i) Finding seed nodes before detecting community and (ii) Detecting community using similarity measure.
4.1. Finding Seed nodes
This part presents in detail finding for detecting communities and making clear the processes of selecting the initial seed node, associating nodes which incident upon a seed node, and electing new seed nodes. The basic idea is inspired by the well-known degree centrality method. It can be used the centrality of nodes to measure which node is seed within that network. It is the most suitable centrality measure for the default measure which yields the most accurate results and also is easy to compute from which we experimented with our results. It is a simple centrality measure that counts how many neighbors a node has. The importance of a node is determined by the number of nodes adjacent to it. The larger the degree of node, the more important the node is. Those high-degree nodes naturally have more impact are considered to be more important. Degree centrality is defined in section 3.5. For example: by viewing Figure 1, the degree centralities become node c and node d by using equation (2).
4.2. Detecting community using similarity measure
In this component, we used the existing methods which is convenient in our work namely Jaccard Similarity which we will measure the similarity based on the neighborhood overlap of seed nodes. This system will be assumed that communities are groups of vertices which of their neighbor nodes are overlapped to each other. We can compute the similarity between each pair of vertices after searching seed nodes to detect community. This method is shown in section 3.6. The example of vertex similarity is shown in the following.
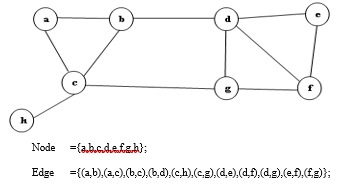 Figure 1: Tiny Graph
Table1: Finding Node Centrality
| Node | Degree | Normalize Degree |
| a | 2 | 2/7=0.28 |
| b | 3 | 3/7=0.42 |
| c | 4 | 4/7=0.57 |
| d | 4 | 4/7=0.57 |
| e | 2 | 2/7=0.28 |
| f | 3 | 3/7=0.28 |
| g | 3 | 3/7=0.28 |
| h | 1 | 1/7=0.14 |
The most centralities are node and node , firstly we choose node .
We got, there is no overlapped value between c and h. Therefore, we identified node as outlier, then and are the members of community corresponding by their node centrality . The community is shown in Figure 2. Then, choose the most centrality value from the rest of the graph. Now, is the most centrality.
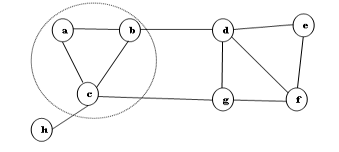 Figure 2: Community of node c Centrality
We got, , and are the members of community corresponding by their node centrality . Figure 3 and Figure 4 are the extracted communities after identifying outlier.
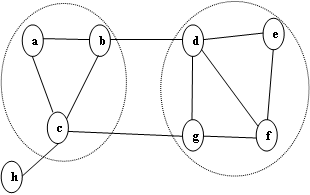 Figure 3: Community of node d Centrality
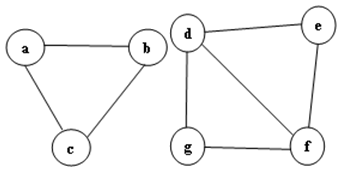 Figure 4: Two Communities after detecting and removing outliers
4.3. Descriptions of Algorithm
For undirected and un-weighted networks dataset, outliers is determined by a node which have no common values then identifying the communities based on the similarity measure in this approach. The following procedures are the steps of detecting outliers and communities:
Step1: Determine seed node by using vertex centrality method.
Step2: Compute the neighborhood overlap of seed nodes by using Jaccard Similarity measure.
Step3: If a node is adjacent to seed node and have overlapped value, determine it as a member of that seed node.
Step4: One node, the member of that seed node within the same community, has another node which is adjacent to its member node and there is overlapped value between them, then identify the linked node as the member of that related community.
Step5: One node which is adjacent to seed node but there is no overlapped values to that seed node is defined as outlier.
Step6: If there is no more adjacent node for that seed node; find another seed node which has the highest centrality value in the left stack of the degree centrality measurement and then repeat the process until there is no more node to be considered.
5. Experiments
5.1. Description of Dataset
In this paper, real undirected networks, Zachary Karate Club Dataset is used. In this Dataset statistics, “nodes” represents the number of friends; “edges” represents the number of friendship in the network. Zachary’s karate club network is one of the popular studies in social network analysis and has been used as one of the typical test examples by many researchers to detect community structures in complex network. There are 34 member nodes, 78 edges and splits into two clubs, one is indicated as circles and the other is indicated as squares which are shown in Figure 5.
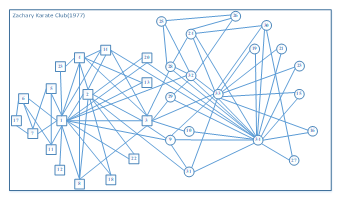 Figure 5: Zarchary Karate Club, Squares and circles indicate two communities observed by Zarchary (1977)
5.2. Evaluation Method
In this section, we show the results of communities and outliers. Before showing our experimental result, we first introduce the evaluation methods that are used in our proposed approach.
When there’s no ground-truth for the communities to assess the quality of detected communities, it could be used quality measurement so called quality scoring functions which characterize how community like is the connectivity structure of a given set of nodes. The idea is that given a community scoring function, one can then find sets of nodes with high score and consider these sets as communities. All scoring functions build on the intuition that communities are sets of nodes with many connections between the members and few connections from the members to the rest of the network. And it can be formalized the intuition that “good” communities are both compact and well-connected internally while being relatively well-separated from the rest of the network. In quality measurement, it can be showed the quality of detecting communities in different point of view. There are many possible ways to mathematically formalize this intuition.
Among them it will be used the most useful five kinds of quality functions are as follows:
- Scoring functions based on internal connectivity
- Scoring functions based on external connectivity
- Scoring functions based on community goodness metrics
- Scoring functions based on a network model
5.2.1. Scoring functions based on internal connectivity
Internal density is defined as ratio between the intra-community edges and all the edges in the graph and is one of the
simplest measures for community quality which is biased towards coarse-grained communities.
Internal density: is the internal edge density of the node set where be the set of nodes, is the number of edges between the members of and is the number of nodes in . The greater the value is the better for internal density.
5.2.2. Scoring functions based on external connectivity
The fraction of existing edges (out of all possible edges) leaving the cluster where n be the number of nodes in the network and cS be the number of edges on the boundary of S. The smaller value is the better for this external connectivity compare with the internal density.
5.2.3. Scoring functions based on community goodness metrics
A clustering coefficient is a measure of the relationship to which people in a network tend to group together. Evidence suggests that in most real-world networks, and in particular social networks, nodes tend to create tightly knit groups characterized by a relatively high density of ties; this likelihood tends to be greater than the average probability of a tie randomly established between two nodes. It is a real number between zero and one that is zero when there is no community, and one for maximal community, which happens when the network consists of disjoint cliques.
Clustering coefficient (CC) is based on the premise that network communities are manifestations of locally inhomogeneous distributions of edges, because pairs of nodes with common neighbors are more likely to be connected with each other.
5.2.4. Scoring function based on a network model
Modularity is defined as having more internal edges and less external edges as is defined as modularity measures the strength of each partition by considering the degree distribution. One main problem with modularity approach is that it cannot detect well defined small communities when the graphs are extremely large. let us talk about the brief definition of modularity. The Q value is between 0 and 1 and the real network modularity function value is generally between 0.3 and 0.7. Community structure is more obvious with the greater value of modularity.
5.3. Results
To prove the proposed approach we first test it on the well-known karate friendship studied by Zachary, which has been become a classical studies workbench by many researchers for community detection algorithm testing. There are 34 member nodes, 78 edges and splits into two communities.
As shown in figure, node 34 and node 1 are seed nodes, the most important node among their neighboring is the main part of our proposed approach. We had to start those nodes to detect communities and identify outliers by using similarity measurement based on edge structure. We found that nodes which have no any overlapped value among their neighbors are determined as outliers which are node 10 and node 12. Table 2 is shown about the detected node community memberships better correspond to ground-truth node community memberships.
Table 2: Communities of Ground-Truth and Proposed Approach, their members and number of members in corresponding communities
| Karate Dataset | Communities | Member (Node) in Community | No. of Members |
| Ground- Truth | Community1 | 34, 9,10, 15, 16, 19, 21, 23, 24, 25, 26,27, 28, 29, 30, 31, 32, 33 | 18 |
| Community2 | 1, 2, 3, 4, 5, 6, 7, 8, 11, 12, 13, 14, 17, 18, 20, 22 | 16 | |
| Proposed Approach | Community1 | 34, 9, 15, 16, 19, 21, 23, 24, 25, 26 27, 28, 29, 30, 31, 32, 33 | 17 |
| Community2 | 1, 2, 3, 4, 5, 6, 7, 8, 11, 13, 14, 17, 18, 20, 22 | 15 |
This paper is assumed that the definition of community is gotten the notion that there must be more edges inside the community than edges linking vertices of the community with the rest of the graph. For this reason it has been used the quality measurement based on the internal connectivity, external connectivity and average clustering coefficient (ACC). The significant evaluation result of community is shown in Table3.
Table 3: Community C, Number of Intra-Nodes (Intra-N), Number of Intra-Edges(Intra-E), Internal Connectivity(IC), External Connectivity(EC) and Average Clustering Coefficient (ACC)
| C | Intra-N | Intra-E | IC | EC | ACC |
| 1 | 17 | 34 | 0.25 | 0.12 | 0.7033 |
| 2 | 15 | 32 | 0.3 | 0.11 |
Some methods based on the idea that nodes can be the member of two or more communities. But some condition, in thinking of which user should be situated on individual community. Our proposed approach intends to split the multiple communities clearly and remove the nodes which are not necessary to group into any communities. In OCNS method had been proved that they can detect the overlapping node definitely. However, they could not be considered which overlapped node is the member of which community exactly. In considering of detection community without studying the overlapping node combines spectral methods with clustering techniques, and uses the concept of modularity in order to develop a working algorithm and the quantitative of individual communities are different from the ground truth community. Moreover, even removing the outliers, the modularity value (Q) of the proposed approach is better than the other system as shown in Table4.
Table 4: Comparison with other methods in Modularity Value(Q).
| Algorithms | Q | No. of Communities | Outlier (node) |
| GN | 0.4013 | 5 | – |
| Detecting network communities: a new systematic and efficient algorithm | 0.4 | 5 | – |
| OCNS | 0.4304 | 2 | – |
| Gephi | 0.416 | 4 | – |
| Proposed Approach | 0.534 | 2 | 10,12 |
6. Conclusion
This proposed approach was used neighborhood overlapping with vertex similarity to detect community and outlier based on edge structure. It showed the steps of detecting outliers and communities in detail. Then, it was discussed about the evaluation measurement in different point of view because of different community criteria. The experiments on real Zachary Karate club network show that our algorithm outperforms other community based algorithms in terms of modularity value, number of communities and members in communities. On the other hand, our approach gets the high quality measurement in the assumption of no ground-truth community. In similarity measurement, nodes
which have the overlapped values are detected as communities correspond with its vertex centrality. Nodes which have no any overlapped values in the communities or which need not be necessary to group into the community is defined by outliers. However, in case of node which has no any overlapped value and is connected with multiple communities are still leaving as our future work.
- Htwe Nu Win and Khin Thidar Lynn, “Community Detection in Facebook with Outlier Recognition”, 18thIEEE/ACIS International Conference on Softerwar Engineering, Artificial Intelligence, Networking and Parallel /Distrubuted Computing (SNPD 2017) , June 26-28, 2017, Kanazawa, Ishikawa, Japan, Pages 155-159.
- Y. Chen, O. R. Zaiane, R. Goebel, “Detecting Communities in Large Networks by Iterative Local Expansion”, International Conference on Computational Aspects of Social Networks, 2009.
- Jaewon Yang and Jure Leskovec,“Defining and Evaluating Network Communities based on Ground-truth”, the Proceedings of 2012 IEEE International Conference on Data Mining (ICDM), 2012.
- Jimeng Sun, HuimingQu, DeepayanChakrabarti, and Christos Faloutsos, “Neighborhood formation and anomaly detection in bipartite graph”, ICDM, November 27-30 ,2005.
- Keith Henderson, Tina Eliassi-Rad, Christos Faloutsos, Leman Akoglu, Lei Li, Koji Maruhashi, B. AdityaPrakash, and Hanghang Tong, “Metricforensics: A multi-level approach for mining volatile graphs”, In Proceedings of the 16th ACM International Conference on Knowledge Discovery and Data Mining (SIGKDD), Washington, DC, 2010, pages 163–172.
- Leman Akoglu, Mary McGlohon and Christos Faloutsos , “Anomaly Detection in Large Graphs”, November 2009, CMU-CS-09-173.
- Lei Tang and Huan Liu, “Community Detection and Mining in Social Media”, ISBN:9781608453559, A Publication in the Morgan & Claypool Publishers series, 2010.
- Luca Donetti and Miguel A Mu˜noz,”Detecting network communities: a new systematic and efficient algorithm”, 2004 IOP Publishing Ltd PII: S1742-5468(04)87880-4 , doi:10.1088/1742-5468/2004/10/P10012, Journal of Statistical Mechanic: Theory and Experiment, an IOP and SISSA Journal, http://stacks.iop.org/JSTAT/2004/P10012.
- E. J. Newman and M. Girvan, “Finding and evaluating community structure in networks”, Phys. Rev. E, vol. 69, p. 026113, Feb 2004.
- E. J. Newman, “Modularity and community structure in networks”, Proceedings of the National Academy of Sciences, vol. 103, no. 23, pp.8577–8582, 2006.
- Girvan, M.E.J.Newman, “Community structure in social and biological networks”, Proc.Natl. Acad. Sci. USA 99, 7821-7826, 2002.
- Mathieu Bastian, SebastienHeymann and Mathieu Jacomy, “Gephi: An Open Source Software for Exploring and Manipulating Networks”, Copyright 2009, Association for the Advancement of Artificial Intelligence (www. aaai.org)
- Meng Wang, Chaokun Wang, Jeffrey Xu Yu and Jun Zhang, ”Community Detection in Social Networks: An In-depth Benchmarking Study with a ProcedureOriented Framework”, 41st International Conference on Very Large Data Bases, August 31st September 4th 2015.
- Michel Plantie’ and Michel Crampes, “Survey on Social Community Detection”, Social Media Retrieval, Springer Publishers, Computer Communications and Networks, 978-1-4471-4554-7, pp.65-85, 2013.
- Mingming Chen, Tommy Nguyen and Boleslaw K. Szymanski, “On Measuring the Quality of a Network Community Structure”, Proceedings of the IEEE Social Computing Conference, Washington DC, September 8-14, pp. 122-127,2013.
- Fortunato, “Community Detecction in Graph”, Phys. Rep. 486, 75 (2010).
- William Eberle and Lawrence B. Holder.“Discovering structural anomalies in graph-based data”, In ICDM Workshops, 2007, pages 393– 398.
- Zachary, W. W.: “An information how model for conflict and fission in small groups”, J. Anthropol. Res, 33 452-473. 1977.
- Zuo Chen, MengyuanJia , Bing Yang, and Xiaodong Li,” Detecting Overlapping Community in Complex Network Based on Node Similarity”, Computer Science and Information Systems 12(2):843–855 DOI: 10.2298/CSIS141021029C , 2014.