Enhanced Outdoor to Indoor Propagation Models and Impact of Different Ray Tracing Approaches at Higher Frequencies

Adv. Sci. Technol. Eng. Syst. J. 3(2), 58–68 (2018);
 DOI: 10.25046/aj030207
The main target of this article is to study the provision of indoor service (coverage) using outdoor base station at higher frequencies i.e. 10 GHz, 30 GHz and 60 GHz. In an outdoor to indoor propagation, an angular wall loss model is used in the General Building Penetration (GBP) model for estimating the additional loss at the intercept point of the building exterior wall. A novel angular wall loss model based on a separate incidence angle in azimuth and elevation plane is proposed in this paper. In the second part of this study, an Extended Building Penetration (EBP) model is proposed, and the performance of EBP model is compared with the GBP model. In EBP model, the additional fifth path known as the “Direct path” is proposed to be included in the GBP model. Based on the evaluation results, the impact of the direct path is found significant for the indoor users having the same or closed by height as that of the height of the transmitter. For the indoor users located far away from the exterior wall of building, a modified and enhanced approach of ray tracing type is proposed in this article. In the light of acquired simulation results, the impact of a modified ray tracing approach is emphasized.
1. Introduction
This article is an extension of research work originally presented at International Wireless Communication and Mobile Computing (IWCMC’17) conference [1]. In reference [1], studies were made at 10 GHz only; whereas in this article the impact of different propagation models is also analyzed at 30 GHz and 60 GHz. Additionally, two different ray tracing approaches are also analyzed in this article.
The angular wall loss model presented in [2] and used in [4] depends on a single three-dimensional incidence angle. This paper presents a new angular wall loss model based on a separate incidence angle in azimuth and elevation plane. An Extended Building Penetration (EBP) model is proposed in this article. Path gain is used as a metric to compare the performance of different angular wall loss models and building penetration loss models. Section II provides the details about the GBP model, frequency dependent penetration models, angular wall loss model, and ray tracing. Whereas Section III explains the proposed angular wall loss model and extended building penetration model. Section IV gives the description of the simulation environment and provides the details about the assumptions and simulation parameters. Section IV discusses the results in detail. Finally, Section V concludes the paper. Outdoor to indoor propagation in a small cell environment involves Line of Sight (LOS) and Non-LOS (NLOS) propagation. It includes path loss computation, determination of reflection and diffraction loss, penetration loss, and other indoor losses. The penetration loss can be divided into four major categories i.e. building exterior wall penetration loss also known as building penetration loss, floor (ceiling) penetration loss, indoor propagation (room penetration) loss, and angular wall loss [2]. Several propagation models are given in literature e.g. General Building Penetration (GBP) model provides and evaluates the candidate paths, Berg’s recursive method for micro cell path loss [3], and the linear attenuation model for indoor propagation. The frequency dependent penetration loss models are presented at [4].
2. Background Theory
2.1. General Building Penetration (GBP) Model
The General Building Penetration (GBP) model is based on the COST231 building penetration model presented at [2]. The model considers a path from each exterior wall of the building. A top view of a single building scenario with a Transmitter (TX) located in an outdoor environment is shown in Figure 1. For each Receiver (RX) point located inside the building, there exist four candidate paths. A path coming from the front face of the building without any diffraction is called the “LOS path”, and the paths which are reaching the receiver point after diffracting from the corners of the building are known as “NLOS paths”. For the NLOS paths, the Berg’s recursive model is used to capture the additional path loss due to the diffraction around the building, before entering the building, whereas the outdoor to indoor and other indoor losses are determined from the COST231 building penetration model as done in [4]. Each multipath has two propagation parts; the first part comprises free space propagation between the transmitter and the building’s exterior wall intercept point. The second part is the propagation of a path in an indoor environment after penetrating through the exterior wall to the receiver point.
 Figure 1. Illustration of propagation paths from outdoor base station to indoor location (top view).
A well-known Friis free space path loss model is used to find the path loss in the first free space propagation part. For the second part of the propagation path, along with the free space path loss model, the building penetration loss model, an indoor wall loss model, and an angular wall loss model is used to compute the additional loss due to indoor propagation. The received signal strength at the receiver location inside the building is the sum of four paths as shown in Figure 1.
Figure 2 shows the side view of the paths entering the building for the two receiver points RX1 and RX2 located on the Floor 1 and Floor 4, respectively. The signal path intercepts the building wall at the same height as that of a receiver height; therefore the ceiling penetration loss is not taken into account. It is important here to mention that in GBP model both the LOS path and NLOS paths do not penetrate through the ceiling.
 Figure 2. Illustration of LOS paths entering the building (side view).
2.2. Building Penetration Loss (BPL)
The signal experiences a penetration loss while penetrating from the outdoor environment to the building. Outdoor to indoor penetration loss is generally termed as Building Penetration Loss (BPL). The building penetration loss relies heavily on the frequency and on the material characteristics of the building; therefore the BPL can be significantly different for different material types at different frequencies. Generally, the old houses are composed of plane standard glass windows and concrete wall, while the Infrared Reflective (IRR) glass windows are commonly used in the new modern energy saving houses. In reference [4], the old buildings are assumed to have 30 % of the standard glass windows and 70 % of the concrete wall. Similarly, the assumption for new modern building type corresponds to the 70 % of the IRR glass windows and 30 % of the concrete wall.
A simple model structure has been proposed in [4] to model a single material frequency dependent penetration loss. The penetration loss for different material types is provided at references [5-9].
 The penetration loss for the concrete wall is modeled as
![]()
As the buildings are composite of windows and concrete wall, the building penetration loss for old buildings and new buildings is modeled as shown in (5) and (6), respectively [10].

The building penetration loss as a function of frequency for different types of building is shown in Figure 3.
 Figure 3. Building penetration loss as a function of frequency.
2.3. Indoor Propagation Loss
In an indoor environment, generally the indoor walls are made up of standard glass alternatively plaster. In [4], two different indoor wall loss models are presented as a function of the frequency assuming an average wall distance of 4 m. The Indoor Loss Model 1 assumes an indoor wall of standard glass, whereas Indoor Loss Model 2 is based on the measurements performed in [5]. Two indoor wall loss models are modeled as shown in (7) and (8).
 Indoor loss as a function of frequency for two different indoor wall loss models, expressed as db/m is shown in Figure 4.
 Figure 4. Indoor loss models as a function of frequency.
2.4. Body Loss as Function of Frequency
In reference [10], the frequency dependency of the body loss is modeled as given in (9).![]()
Equation (9) shows that frequency has a negligible impact on a considered body loss model at 10 GHz or lower frequencies, as traditionally the body loss is assumed to be 3 dB. However, equation (9) gives additional 0.5 dB and 1 dB body loss at 30 GHz and 60 GHz, respectively.
2.5. Angular Wall Loss Model Based on a Single Three-dimensional Incidence Angle
In addition to the building penetration loss and indoor wall loss, there exists an angular wall loss. An angular wall loss model presented at [2, 4] is used to include the angular loss that can be experienced at the building’s exterior wall intercept point. The angular wall loss model is given by (10),![]()
where is the single three-dimensional incidence angle.

 Figure 5. Illustration of incidence angles at intercept point on wall in,
a) Azimuth (horizontal) plane, and b) Elevation (vertical plane).
To understand the geometry and the computation of , consider an example scenario in an azimuth plane (top view) as shown in Figure 5(a). The receiver point is located inside the building and the transmitter is located in an outdoor environment. The distance between the transmitter and the receiver point along the x-axis and the y-axis is given by x_length and y_length, respectively. HYP1 is the distance between the transmitter and the incidence point on the wall, and is given in (11).![]()
In Figure 5(b), z_length is the difference of height between the transmitter and the receiver point, and HYP2 is the three dimensional distance between the transmitter and the wall intercept point. HYP2 is calculated as follows:![]()
The single three-dimensional incidence angle can be computed as
Considering the geometry shown in Figure 5, the equation given in (13) can also be re-written in a simplified form as![]()
2.6. Ray Tracing (RT)
Ray tracing techniques can be used for estimating the received signal level and for the characterization of the radio propagation environment. Finding the multipath components between the transmitter and receiver is the first step towards the computation of the received electric field or power at the receiver point. By using Image Theory (IT) algorithm, all multipaths with the given finite number of reflections and diffractions can theoretically be found between the transmitter and receiver. An Image theory algorithm shows a high level of accuracy and precision. Determination of multipath components by image based ray tracing technique may require large computation time. The complexity and the computational time of the ray tracing algorithm increases with the increase in number of supported reflections and diffractions [11-13]. Reflection losses are determined by reflection coefficients. The reflection coefficient depends upon the polarization and on the material permittivity. For perpendicular and parallel polarization, the reflection coefficients are given in (15) and (16), respectively. is the angle between the incident ray and the reflected surface, and is the material permittivity of the reflecting surface.
There are several ways for computing the diffraction loss; however a recursive method proposed in [14] is used in this article to compute the diffraction loss.
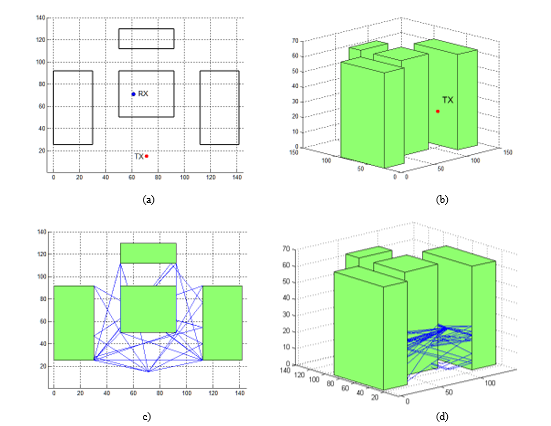 Figure 6. Illustration of ray tracing, (a) Two dimensional view of sample building scenario, (b) Three dimensional view of sample building scenario, (c) Two dimensional view of ray tracing, and (d) Three dimensional view of ray tracing.
Figure 6(a) shows the sample building scenario in two-dimensional environment with transmitter and receiver locations marked with TX and RX, respectively. Figure 6(b) shows the three-dimensional view of a sample scenario with TX height at 31.5 meter. The receiver point is located inside the central building at the height of 10.5 m. Figure 6(c) illustrates the ray tracing in two-dimensional view, whereas Figure 6(d) shows the three-dimensional view of ray tracing. Blue lines show different propagation paths with finite number of reflections and diffractions, and LOS path.
3. Proposed Models
3.1. Angular Wall Loss Model based on Separate Incidence Angle in Azimuth and Elevation Plane
In this article, a novel angular wall loss model based on a separate incidence angle in azimuth and elevation plane is proposed. It is proposed to compute the total angular loss as a sum of the angular loss in an azimuth and elevation plane. Unlike the single three-dimensional angle, in this proposed approach the incidence angle in the horizontal plane and vertical plane should be computed separately. The azimuth angular loss and elevation angular loss is given in (17) and (18), respectively.
The angles and used in (17) and (18), respectively, are shown in Figure 5. The angles and are the incidence angles computed separately in an azimuth and elevation plane. Now, the total angular loss is given by (19).![]()
While considering a fixed x_length of 50 m for a geometry shown in Figure 5, the Figure 7 shows the angular loss based on a single three-dimensional incidence angle as a function of y_length and z_length.
 Figure 7. The angular loss based on single 3D incidence angle.
Figure 8 shows the angular loss based on a separate incidence angle in azimuth and elevation plane. The first approach of the angular wall loss model based on a single three-dimensional incidence angle gives higher angular loss at the lower values of y_length and z_length. The angular wall loss model based on a separate incidence angle in azimuth and elevation plane considers the change of angle of an incident ray in both domains separately, and therefore it can be seen in Figure 8 that the angular loss increases with the increase in z_length which is not the case in Figure 7. The impact of change of z_length especially at the lower values of y_length, is minimal on the angular loss based on a single three-dimensional approach, whereas Figure 8 shows that dual-angle model has greater dependency on the change of angle in the elevation plane compared with the single three-dimensional angle approach.
 Figure 8. The angular loss based on separate incidence angle in an azimuth (horizontal) and elevation (vertical) plane.
3.2. Extended Building Penetration (EBP) Model
The extended building penetration model is the extension of the general building penetration model. In this model, the additional fifth path known as the “Direct path” is proposed to include as shown in Figure 9. In 3D environment, the direct path is the shortest path between the transmitter and the receiver and it can penetrate through the building wall and through the ceilings of the floors. Figure 10 shows two receiver points RX1 and RX2 located inside the building at Floor 1 and Floor 4, respectively.
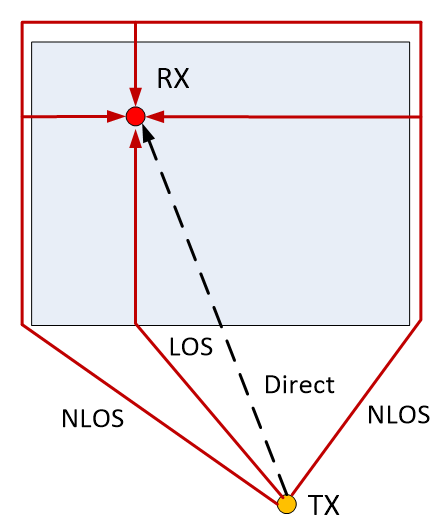 Figure 9. Illustration of direct path along with other paths (top view).
In Figure 10, the LOS paths are shown with the red arrows and the direct paths are shown with the black arrows. It can be seen that the direct ray follows the shortest path between the transmitter and the receiver, and intercepts the building wall at different height compared with that of a receiver height. In Figure 10, it can also be seen that the direct path to RX1 penetrates through the single ceiling, whereas the direct path to RX2 penetrates through the ceilings of two floors. Therefore, the ceiling penetration loss needs to be taken in to account for the direct path.
 Figure 10. Ray path entering the building while penetrating through the ceiling (side view).
Generally, the ceilings are made up of concrete. Therefore, the ceiling penetration loss model is assumed to follow the concrete penetration loss model as given by (20). The given ceiling penetration loss model provides the ceiling penetration loss of 45 dB, 85 dB, and 125 dB at 10 GHz, 30 GHz and 60 GHz, respectively.![]()
4. Simulation Environment and Simulation Results
For the first and second part of research work, a single twenty-one stories building with an average floor height of 3 m is considered for simulation as shown in Figure 11. An outdoor base station is located at a distance of 10 m away from the building as shown in Figure 11.
 Figure 11. Two-dimensional map of a single building scenario with transmitter 10 m away from the building.
The transmission power and the height of the base station antenna are 33 dBm and 31.5 m, respectively. The simulations are performed at the frequency of 10 GHz. The indoor location points are placed on each floor with the separation of 5 m among them. An old building type was assumed with indoor wall loss model 1.
In the first part of this research work, the impact of angular wall loss models is analyzed. In case of an angular wall loss model based on a single three-dimensional incidence angle, the incidence angle was set to 60 for the NLOS paths. Similarly, in case of an angular wall loss model based on a separate incidence angle in azimuth and elevation plane, the incidence angle in an azimuth plane ‘ ’ and the incidence angle in an elevation plane ‘ ’ were also set to 60 for NLOS paths. Therefore, both models give similar results for NLOS paths.
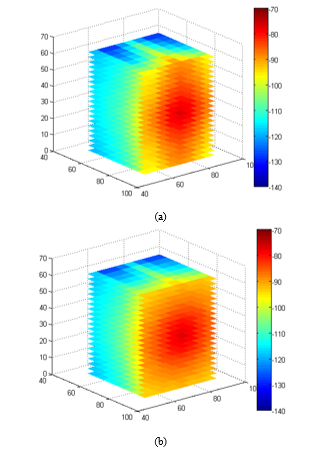 Figure 12. Path gain, a) Angular wall loss model based on single three-dimensional incidence angle, and (b) Angular wall loss model based on separate incidence angle in azimuth and elevation.
Figure 12 shows the heat map of a path gain achieved with two angular wall loss models. The difference between the two angular wall loss models is evident and visible. In Figure 12(b) as we move away from the centre point of the building wall, the path gain starts to fade (deteriorate) in a perfect circular pattern. However, in Figure 12(a) the change of the path gain with the change in an azimuth and elevation angle is not in a perfectly circular way.
 Figure 13. Difference of angular wall loss models.
The difference between the two angular wall loss models is computed by subtracting the received signal power at each point using angular loss model based on separate incidence angle in azimuth and elevation plane from the received signal power calculated using angular wall loss model based on a single three-dimensional incidence angle. The difference was computed assuming only LOS path. The NLOS paths were neglected for calculating the difference, as both models show similar results for NLOS paths. Figure 13 shows the CDF plot of difference between the two angular wall loss models. It can be seen in Fig. 10 that the difference between the two angular wall loss models has values up to 7 dB. The CDF curve with the large number of positive values shows that the angular wall loss model based on a single three-dimensional angle provides aggressive angular loss compared with the dual-angle based angular loss model.
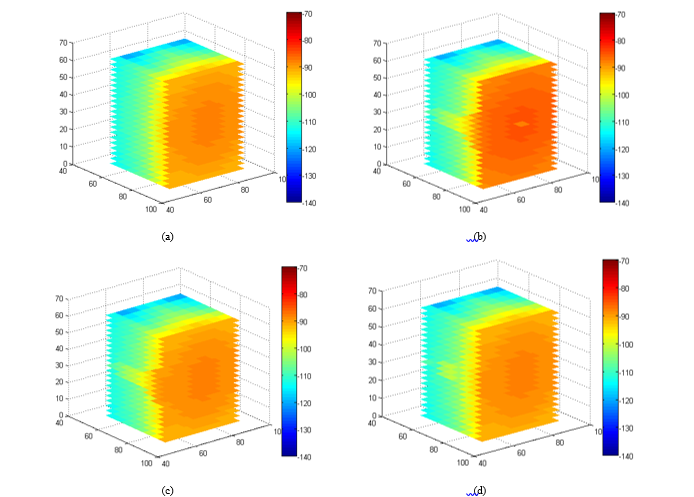 Figure 14. Path gain at 10 GHz, a) GBP model, (b) EBP model without any filter, (c) EBP model with 3 dB filter, and (d) EBP model with 7 dB filter.
In the second part of this research work, the impact of the direct path in the extended building penetration model is analyzed, and the performance of the general building penetration model is compared with the extended building penetration model. The angular wall loss model based on a separate incidence angle in horizontal and vertical plane is assumed, and the separation between the building wall and transmitter is set to 35 m.
Figure 14 shows a heat map of path gain for different cases. Figure 14(a) shows a path gain for GBP model, and while going from front to the back of the building an almost similar path gain is achieved on all the floors of the building. In Figure 14(b), a direct path is included. Now, due to an additional path a higher path gain is obtained. It is interesting to see that an additional direct path improves the received signal level of the users located on the floors which are close to the height of the outdoor transmitter
It can be seen in Figure 14(b) that due to higher ceiling penetration loss at higher frequency, the impact of a direct path diminishes as the difference between the outdoor antenna height and the user height increases. However, the impact of a direct path is clearly evident to the users located deep inside the building at the same floor height as an outdoor antenna, or on one floor above and below. On the other hand, it can also be observed that in Figure 14(b) the path gain is overestimated at the front face of a building, as the “LOS path” and the “Direct path” are almost identical, and they are both included in the modeling. Therefore, a filtering threshold of 3 dB is used in Figure 14(c) to filter out the direct path if the difference between the LOS path and the direct path is less than or equal to 3 dB. An impact of simple 3 dB filter can be seen in Figure 14(c) as the front face of a building is showing now almost similar results as in Figure 14(a). Similarly, a filtering threshold of 7 dB was used in Figure 14(d). The direct path has quite significant impact on the floors close to the outdoor antenna height even with 3 dB filtering threshold. Therefore, it will improve the model of outdoor to indoor propagation by including a direct path along with the certain filtering threshold, as we have used in this study.
For ray tracing simulations in order to acquire reflected and diffracted multipaths a multiple building scenario is considered as shown in Figure 15.
 Figure 15. Two-dimensional map of a multiple building scenario with transmitter 35 m away from the building.
In this scenario, a single twenty stories building surrounded by four other buildings of the same height are considered. However, the focus area is the central building, and therefore indoor location test points are distributed in the central building only. An outdoor base station is located at a distance of 35 m away from the central building as in the case of a single building case.
In the third part of this research work, two different ray tracing approaches are considered for the indoor users:
Ray tracing type 1 (RT type 1): In this case, an Image Theory (IT) based ray tracing technique is used to find the propagation paths between the outdoor transmitter and the indoor receiver point. A smooth building surface is assumed, which acts as a perfect reflecting surface. For the transmitter and the receiver points at different heights, the incidence ray path does not intercept the building wall at receiver height. Therefore, for the paths which pass through the ceiling of a floor as shown in Figure 10, the ceiling penetration loss model is used to include the ceiling penetration loss.
Ray tracing type 2 (RT type 2): It is the modified approach of ray tracing type 1. In this case, the propagation paths between the transmitter and receiver in an azimuth plane are found by using the image theory. However, in an elevation plane for the transmitter and receiver at different heights the incidence ray path “always” intercepts the building wall at receiver height. It means that the ray path would never penetrate through the ceiling of a floor. Therefore, the ceiling penetration loss model is not used in this case.
 Figure 16. Path gain at 10 GHz, a) Ray tracing type 1, (b) Ray tracing type 2.
Figure 16 shows a path gain map for different cases. It is interesting to see the results obtained by ray tracing type 1. In Figure 16(a), the acquired results from ray tracing type 1 for the indoor users located 6 m or more deep inside the building are quite pessimistic in comparison with the results obtained with ray tracing type 1. As explained earlier, that in case of ray tracing type 1 approach, the ray path entering the building intercepts the building wall at different height compared with that of a receiver height. For the users located deep inside the building the most of the ray paths reach at the receiver point after penetrating through a single or through the multiple ceilings of the floor. Due to high ceiling penetration loss, the signal power attenuates significantly after passing through the ceilings.
Therefore, the ray tracing type 1 is found not suitable for the indoor users located far away from the exterior wall of the building. However, the results obtained with ray tracing type 2 seem more optimistic and realistic in comparison with the ray tracing type 1. It is critical here to mention that in ray tracing type 2, the incident ray always intercepts the building wall at the same height as that of a receiver height, and therefore the ceiling penetration loss is ignored in ray tracing type 2.
 Figure 17. CDF plot of path gain for different propagation models at 10 GHz.
Figure 17 shows the CDF plot of path gain for different considered cases. For an extended building penetration model, a 3 dB filtering threshold was used. For the top nearly 14.5 % of the samples, the ray tracing type 1 shows an almost identical result as ray tracing type 2. Those 14.5 % of the samples mainly represent the receiver locations from the front row and few from the second row i.e. receiver points at the front face of the building. Again, for the same top 14.5 % of the samples the general building penetration model provides an almost similar result like that of an extended building penetration model and other ray tracing approaches. Then, the path gain starts to drop significantly for the receiver points located deep inside the building. A large portion of samples have the extremely pessimistic values of the path gain with a ray tracing type 1. For the considered cases, the ray tracing type 2 was found the most optimistic approach. For ray tracing simulations, all the possible ray paths with two reflections and two diffractions were considered.
Therefore, there is a large number of considered ray paths in case of ray tracing compared with the GBP and EBP. The results provided in Figure 14 and Figure 16 reveal that ray tracing type 2 is a better and realistic approach compared with ray tracing type 1 for estimating the received signal level, especially for the indoor users located deep inside the building.
 Figure 18. Path gain at 30 GHz, a) GBP model, (b) EBP model with 3 dB filtering threshold, c) Ray tracing type 1, and (d) Ray tracing type 2.
Figure 18 shows a heat map of path gain for different models assuming old building type at 30 GHz and indoor wall loss model 1. Path gain is the function of frequency and a significant impact of frequency of operation can be seen between the results presented in Figure 16 (at 10 GHz) and Figure 18 (at 30 GHz). In Figure 18(b), the path gain for EBP model with 3 dB filtering threshold is shown, and the impact of the direct path is even
 Figure 19. Path gain at 60 GHz, a) GBP model, (b) EBP model with 3 dB filtering threshold, c) Ray tracing type 1, and (d) Ray tracing type 2.
visible at 30 GHz frequency for the center floors. The impact of a direct path is not prominent in overall results. Again, the ray tracing type 1 is found as an inadequate approach for estimating the path gain, and it provides the extremely low values of path gain at 30 GHz. However, it is interesting to see the results acquired with ray tracing type 2. It is fascinating to compare the results of two ray tracing approaches, as ray tracing type 1 clearly shows lack of indoor coverage with the outdoor base station except the front wall of the building. On the other hand, the simulation results of ray tracing type 2 show that the low indoor coverage can be provided with the outdoor base station. Similarly, GBP and EBP models show lack of indoor coverage at 30 GHz. These results leave an open discussion that the results acquired from the ray tracing type 2 are more realistic or the results acquired with ray tracing type 1 are more realistic. As we don’t have any measured reference data therefore it is hard to make a clear statement.
Figure 19 shows a heat map of path gain for old building type at 60 GHz assuming indoor wall loss model 1. At 60 GHz, all of the considered propagation models show that due to high propagation and penetration losses the indoor coverage cannot be provided with the outdoor base station. Higher antenna gain at higher frequencies can compensate the high penetration and propagation losses. Otherwise, an indoor coverage with the outdoor base station at 60 GHz can be provided if new buildings are constructed with the material having better signal penetration properties.
5. Conclusion
In this paper, the outdoor to indoor propagation at higher frequency is studied. Furthermore, a novel angular wall loss model based on a separate incidence angle in azimuth and elevation plane is proposed. In the proposed angular wall loss model, the total angular loss is the sum of loss due to the change of angle of an incident ray in both azimuth and elevation plane. The simulation results show that the angular wall loss model based on a single three-dimensional angle provides aggressive angular loss compared with the proposed dual-angle angular wall loss model. In the second part of this study, an Extended Building Penetration (EBP) model is proposed, and the performance of EBP model is compared with the COST231 building penetration model. In an extended building penetration model a fifth path known as a “Direct path” is added. Through the simulation results, it is shown that the direct path has a significant impact on the indoor receiver points located close to the height of the transmitter. Therefore, the extended building penetration model can be considered as a better approach for modelling the outdoor to indoor propagation at higher frequencies.
The ray tracing is a promising and precise technique for estimating the received signal level and for channel modeling. In this study, a performance comparison between the general building penetration model and the ray tracing model is done. It was found that the traditional ray tracing technique provides good approximation for the users located close to the wall of the building. However, the traditional ray tracing approach was found in-efficient for modeling the outdoor to indoor propagation especially for the indoor users located far away from the exterior wall of the building. A new approach of ray tracing is also proposed in this study. The simulation results show that ray tracing performance is significantly improved by the proposed recommendation. With the proposed ray tracing approach the results of a path gain were fairly better compared with the other models. Later, the performance of different propagation models was compared at 10 GHz, 30 GHz and 60 GHz frequency of operation. It was found that for the considered simulation scenario the adequate coverage can be provided for the indoor users with the outdoor base station at 10 GHz. However at 30 GHz, the general penetration model clearly showed the lack of indoor coverage. Whereas the proposed ray tracing type 2 approach showed a fair indoor coverage at 30 GHz. The propagation and building penetration losses were quite high at 60 GHz; therefore the simulation results show no indoor service at 60 GHz.
Acknowledgment
Authors would like to thank European Communications Engineering (ECE) Ltd, TAKE-5 project, and Oy L M Ericsson Ab for supporting this research work.
- U. Sheikh, K. Hiltunen and J. Lempiäinen, “Angular wall loss model and Extended Building Penetration model for outdoor to indoor propagation,” 2017 13th International Wireless Communications and Mobile Computing Conference (IWCMC), Valencia, 2017, pp. 1291-1296.
- Damosso and L. M. Correia, Eds., Digital mobile radio towards future generation systems, final report ed. European Commission, 1999.
- E. Berg, “A recursive method for street microcell path loss calculations,” Proceedings of 6th International Symposium on Personal, Indoor and Mobile Radio Communications, Toronto, Canada, September 1995, pp. 140-143 vol. 1.
- Semaan, F. Harrysson, A. Furuskär and H. Asplund, “Outdoor-to-indoor coverage in high frequency bands”, 2014 IEEE Globecom Workshops (GC Wkshps), Austin, TX, 2014, pp. 393-398.
- Larsson, F. Harrysson, B.-E. Olsson, and J. E. Berg, “An outdoor-to-indoor propagation scenario at 28 GHz,” in 8th European Conference on Antennas and Propagation (EuCAP 2014), The Hague,The Netherlands, April 2014, pp. 3301-3304.
- C. Stone, “Electromagnetic signal attenuation in construction materials, ”NIST Building and Fire Research Laboratory, Gaithersburg, Maryland, NISTIR 6055 Report No. 3 6055, Oct. 1997.
- M. Frazier, “Radar surveillance through solid materials,” in Proceedings of the SPIE – The International Society for Optical Engineering, vol. 2938, Hughes Missile Syst. Co., Rancho Cucamonga, CA, USA, 1997, pp. 139-146.
- Wilson, “Propagation losses through common building materials 2.4 GHz vs 5 GHz,” University of Southern California, CA, Tech. Rep. E10589, Aug. 2002.
- A. Remley, G. H. Koepke, C. L. Holloway, C. A. Grosvenor, D. G. Camell, J. M. Ladbury, R. Johnk, D. R. Novotny, W. F. Young, G. Hough, M. McKinley, Y. Becquet, and J. Korsnes, “Measurements to support modulated-signal radio transmissions for the public-safety sector,” NIST, Boulder, CO, Tech. Rep. Tech. Note 1546, Apr. 2008.
- White paper on “5G Channel Model for bands upto 100 GHz”.
- W. Son, and N.H. Myung, “A deterministic ray tube method for microcellular wave propagation prediction model,”Antennas and Propagation, IEEE Transactions on , vol.47, no.8, pp.1344-1350, Aug 1999.
- N. Schettino, F.J.S. Moreira, C.G. Rego, “Efficient Ray Tracing for Radio Channel Characterization of Urban Scenarios,” Magnetics, IEEE Transactions on , vol.43, no.4, pp.1305-1308, April 2007
- Soni, and A. Bhattacharya, “An efficient two-dimensional ray-tracing algorithm for modeling or urban microcellular environment”, International Journal of Electronics and Communications (AEU), volume 66, issue 6, pp. 439-447, June 2012.
- E. Berg, “A recursive method for street microcell path loss calculation”, 6th PIMRC’ 95, Toronto, Canada, September 1995, pp. 140-143.