Detection of ExoMars launcher during its passage over Europe with Space Surveillance radar breadboard

Adv. Sci. Technol. Eng. Syst. J. 3(2), 99–105 (2018);
 DOI: 10.25046/aj030212
A bistatic radar breadboard for space surveillance has been developed by ONERA for the European Space Agency. This item was operated during the launch of the ExoMars mission on March 14th 2016. The spacecraft, attached to the Proton launcher, was well detected in real-time during its passage over South Europe. This paper presents the setting up of an experiment to detect this particular type of targets with the radar breadboard. The results of its operation as space surveillance system as well as a specific kinematic analysis of the ExoMars spacecraft as viewed from the radar.
1. Introduction
This paper is an extension of works originally presented in 2017 IEEE Radar Conference (RadarConf17) [1].
ABISS project (Antenna BIstatic for Space Surveillance) is relative to the breadboarding of a ground-based surveillance radar demonstrator for European Space Agency (ESA) [2]. This paper presents the setting up of an experiment to detect certain types of targets with this Space Surveillance radar demonstrator
The first section presents a description of the radar demonstrator and its principle of operation for Space Surveillance. Results obtained during the different campaigns of measurements are presented.
The second section is relative to the experiments which have been done during ExoMars launch in March 2016. A kinematic analysis of the radar parameters has been realized from the measurements of detection of this particular target.
2. Radar demonstrator
The European Space Surveillance radar breadboard is a bistatic system that is located on two separate sites in the northern part of France around Paris as shown in Figure 1.
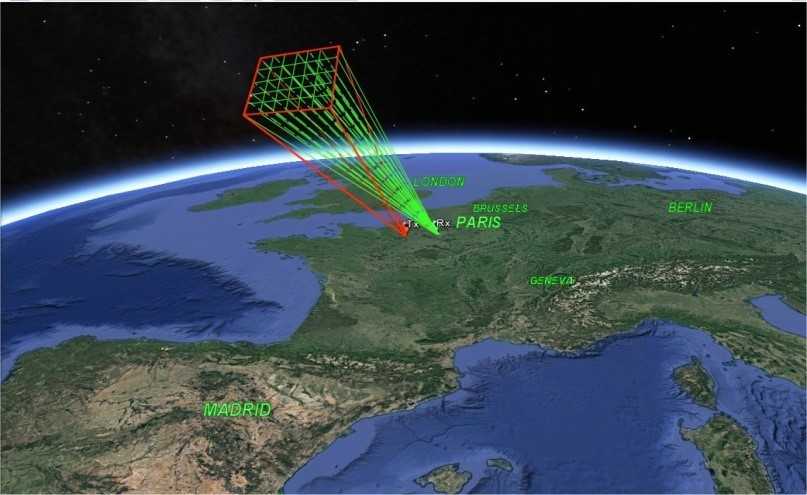 Fig:1 Bistatic radar configuration (Tx: transmitting site in red, Rx: receiving site in green)
This radar operates in L-band for the detection of space objects over a steerable Field of Regard (FoR) defined as 30° in azimuth by 25° in elevation oriented preferably to the South.
One of the advantages of such a system is its operation with a continuous wave (CW) signal, which is easier for spectral management as it is strictly limited to the carrier frequency.
The breadboard has been designed on the basis of simulations of performances, as a radar which should have a reference detection range at 500 km for a reference target of 0 dBm² as Radar Cross Section (RCS) for a revisit time of 10 seconds, meaning that the beam of the radar should revisit the same azimuth and elevation position within 10 seconds.
These are the reference values that have been used in the power budget computation for the design of the system. The principle of the detection for such radar is only based on Doppler measurement; there is no evaluation of the distance of the target.
The transmitting system (Tx, presented in figure 2 and figure 3) is constituted of one antenna array of surface area 1.5 m² with 49 radiating elements, and 49 CW solid state power amplifiers, controlled in both phase and gain, associated to each radiating element.
All electronics equipments for transmitting and control are in a shelter. The antenna array is set up under a radome on the roof oriented to the South. The positioner which hosts the antennas array can be steered in +/-90° in azimuth around a central position oriented in South direction, and 0° to 90° in elevation.
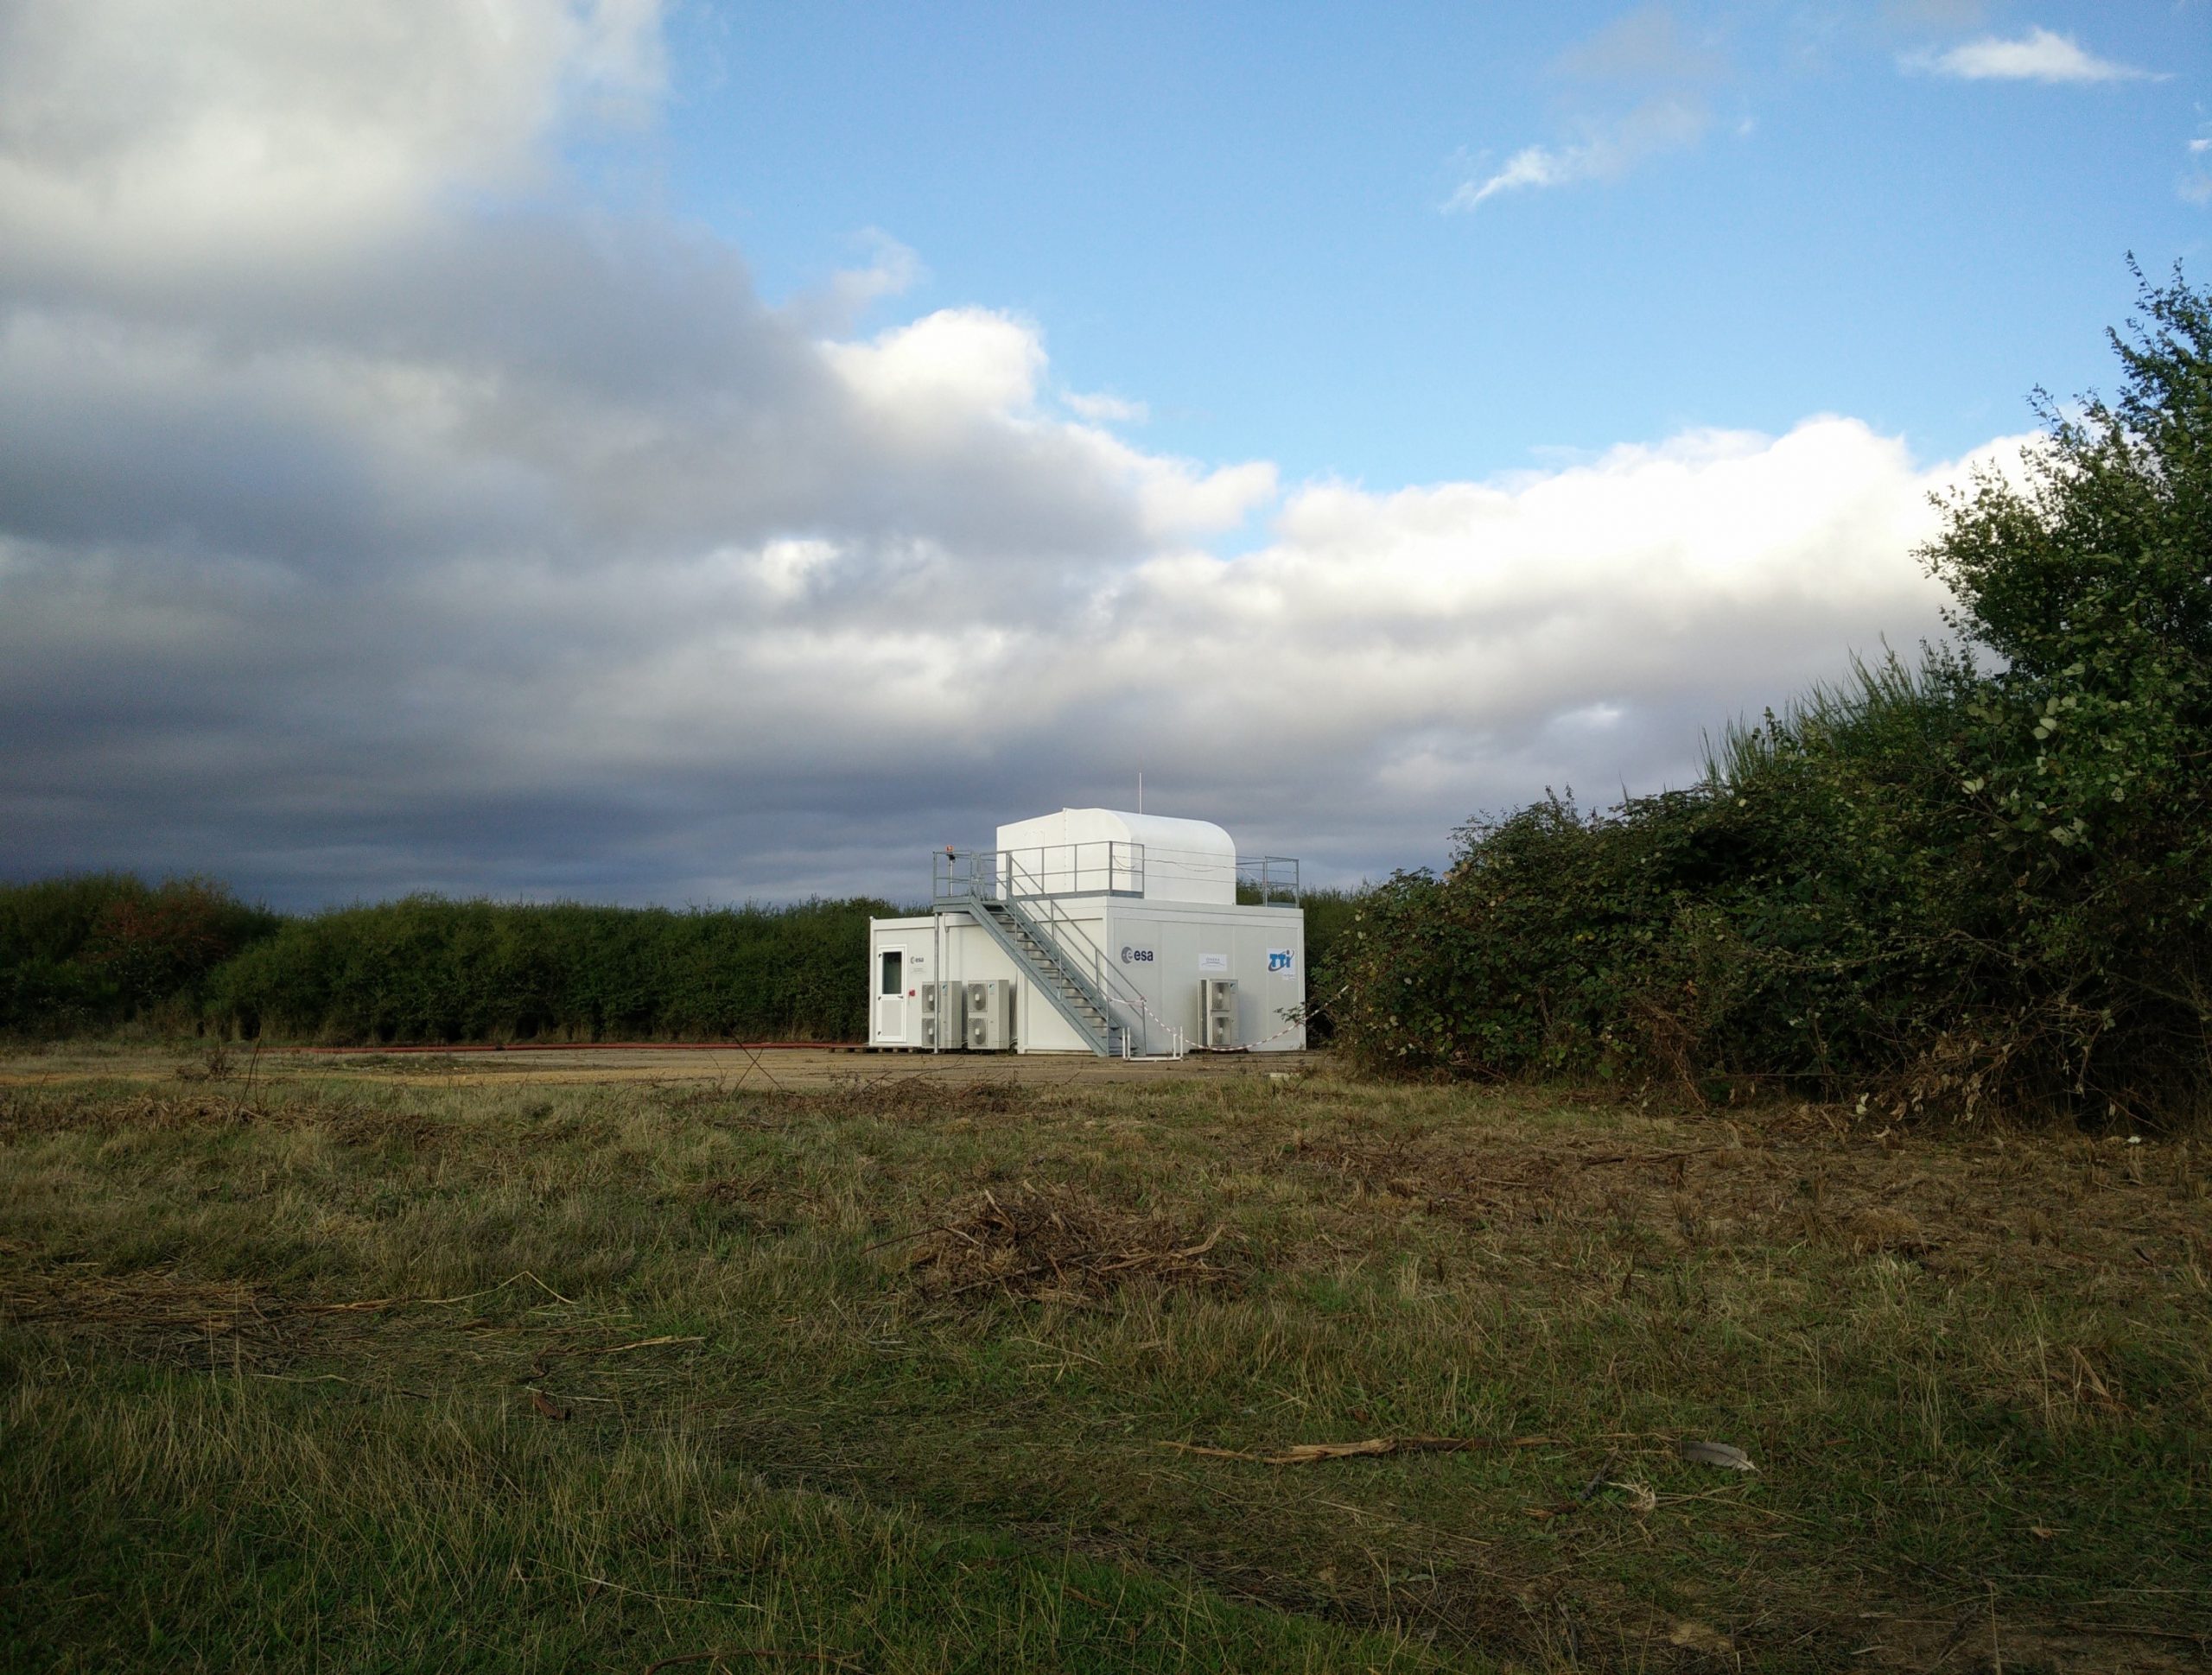 Fig:2 The transmitting system the shelters with the antenna on the roof under a radome)
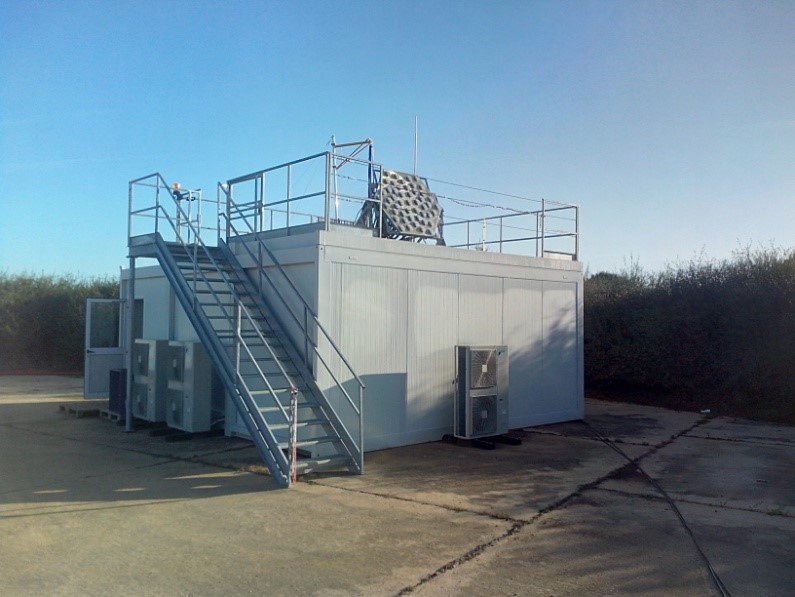 Fig:3 Transmitting system (the shelters with the antenna on the roof without the radome)
The receiving site (Rx) is within ONERA centre in Palaiseau. The antenna panel, with a surface area of 10.5 m² and 64 receiving antennas, is installed on the roof of an office building as shown on Figure 4.
The antennas array can be steered in +/-90° in azimuth around a central position oriented in South direction, and it can be inclined from 0° to 90° in elevation. The receiving system is constituted of 64 analog front-edge stages in one cabinet, 4 digital receivers of 16 channels and a cluster of 10 PC servers to process the data.
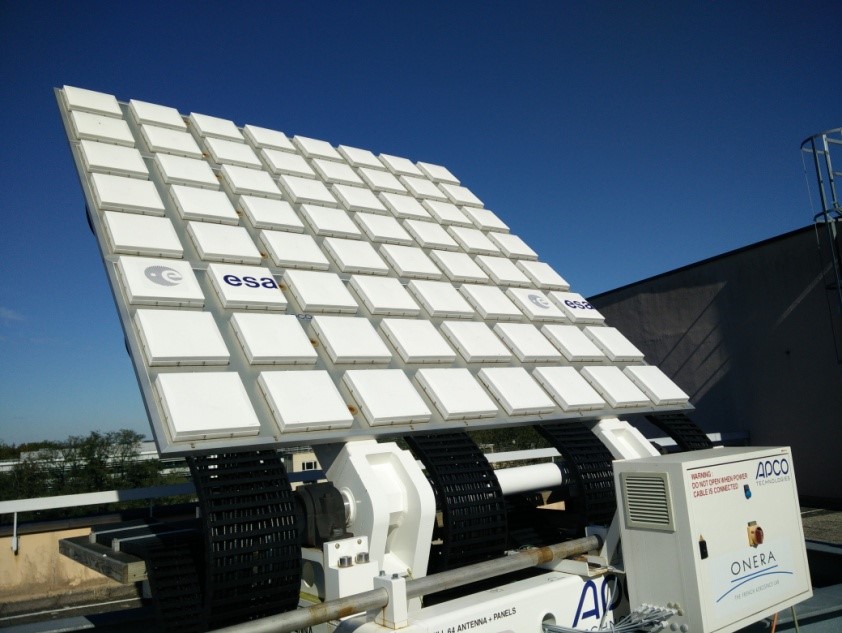 Fig:4 The receiving antenna panel in Palaiseau (ONERA centre)
In order to achieve the simulated detection performances, the whole Field of Regard of 30° in azimuth by 25° in elevation as shown in Fig.5, should be revisited every 10 seconds.
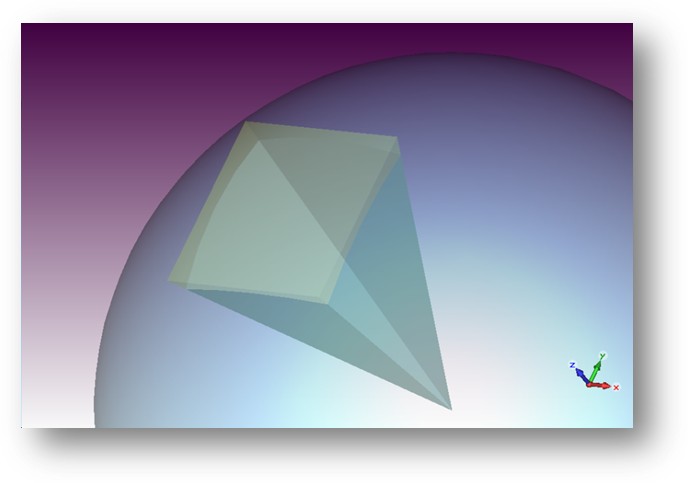 Fig:5 The Field of Regard (FoR) of the radar
According to simulations taking into account the geographical constraints and the maximization of objects detection, the difference of pointing between the two beams oriented South is few degrees between the two boresight directions.
The aperture of the transmitting beam plotted on Figure 6 is 11° azimuth by 11° elevation. Thus, the entire Field of Regard is covered by 10 scanning positions of this beam as presented on Fig.7.
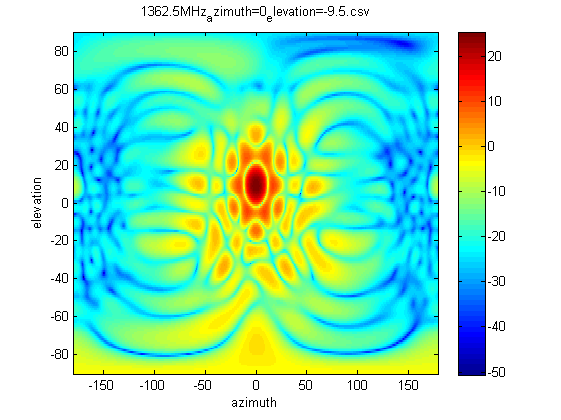 Fig:6 Pattern of the transmitting beam formed with transmitting array (11° aperture in azimuth and elevation).
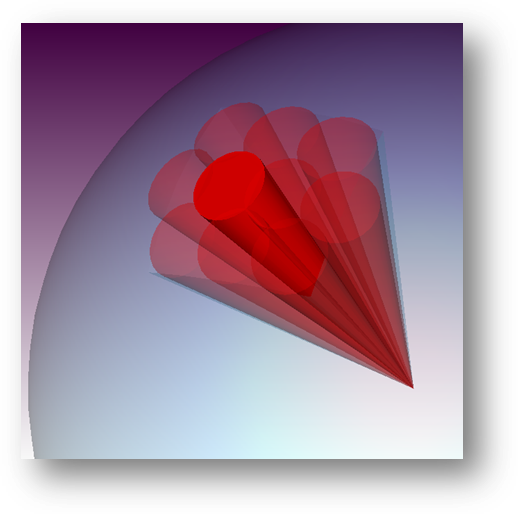 Fig:7 The 10 beams positions necessary to cover the Field of Regard
The Field of Regard is completely covered with an average gain greater than 22 dB as presented on Fig.8.
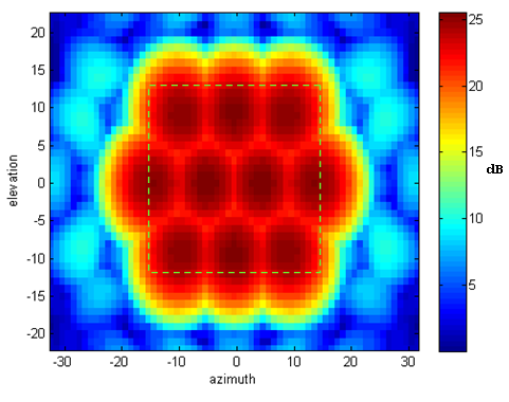 Fig:8 Optimization of the coverage of the Field of Regard for detection requirement
An evaluation of the number of receiving beams to form to cover each transmitting beam is done with an overlapping factor of 0.8 with a beam width of 4° (the aperture of receiving beam). The Figure 9 shows the results of the evaluation of receiving beams to form for extreme positions of the transmitting beam in the four corners and in the middle of the Field of Regard.
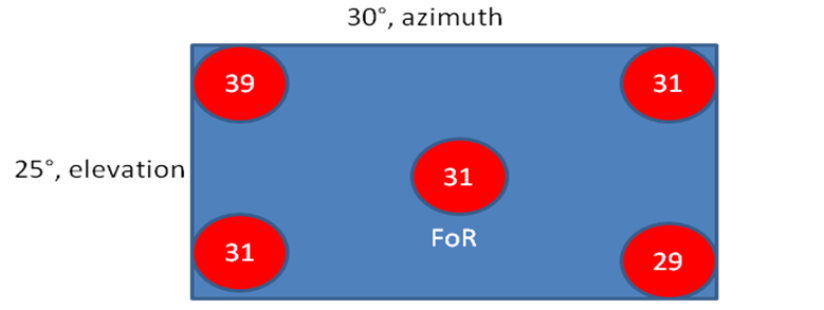 Fig:9 Number of Rx beams required in different locations of transmitting beam (Red areas) in the Field of Regard (Blue area: 30° azimuth x 25° elevation).
The most critical position which requires most of receiving beams to compute is when transmitting beam is focalized in the position corresponding to the upper left corner of the Field of Regard. Maximum number of beams to form for this steering direction of the transmitting beam is around 39, according to the following result represented on Figure 10 with a drawing which takes into account the distortion of the illuminated area.
The full receiving antenna array (including coupling and losses of materials) has been simulated. The global gain in the central boresight of the panel is 31.8 dB as shown in the 3 dimension display of the Figure 11.
 Fig:10 Transmitting beam deformed (yellow) and viewed from receiving site with the coverage of associated receiving beams (green)digitally formed
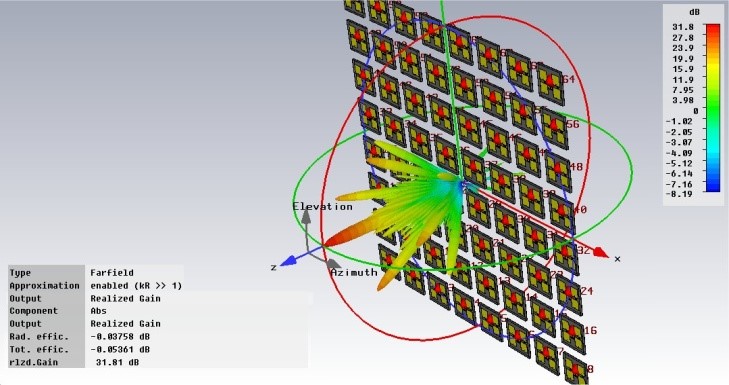 Fig:11 3D simulation of the full receiving antenna panel (normal direction pointing)
The average gain has been evaluated over the whole Field of Regard of the radar. It is greater than 29.9 dB by computing all the beams formed for each of the 10 positions of the transmitting beam.
The signal processing implemented in the radar consists in Doppler/acceleration measurements (i.e., speed estimation), detection and monopulse compression for precise direction finding. As the Field of Regard is covered by 10 positions of the transmitting beam in 10 seconds, one second of signal is analyzed at each position. Consequently, the coherent integration time is 1 second.
Thus, detections of objects that pass through the Field of Regard are characterized by Doppler traces versus time. The passage of one space object is signaled by a series of closely spaced radar plots as it can be observed on Fig.12.
Each extracted plot contains all measurements parameters, namely azimuth, elevation, Doppler (speed), radial acceleration and time of detection.
Tracking of a previously detected target is realized with consecutive plots using the Track-While-Scan (TWS) method, which combines both search and track functions. The orbital trajectory can be built from the track from latitude and longitude positions of the transmitting site and receiving site of the radar.
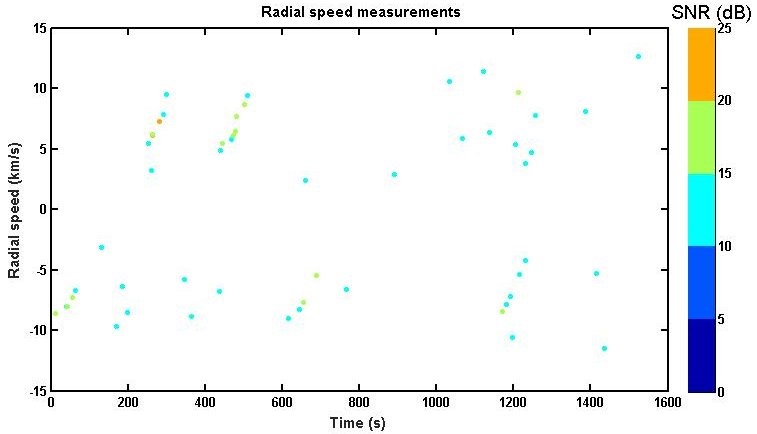 Fig:12 Doppler traces (speed) versus time (many traces of detected space objects are characterized by alignments of closed detected plots at 50 s, 250 s, 430 s, 620 s and 1200 s)
The breadboard radar has been regularly operating for more than one and half year.
Around 700 space objects have been detected and their associated tracks have been generated. The tracked objects are plotted as red dots over the Space track catalogue display on the Figure 13. More than 60% of detections are related to targets at least 3 meters in diameter at ranges less than 700 km. Objects tracked over 800 km to 1000 km are generally bigger (more or less 5 meters in diameter).
More than 40% of detections are identified as rocket debris.
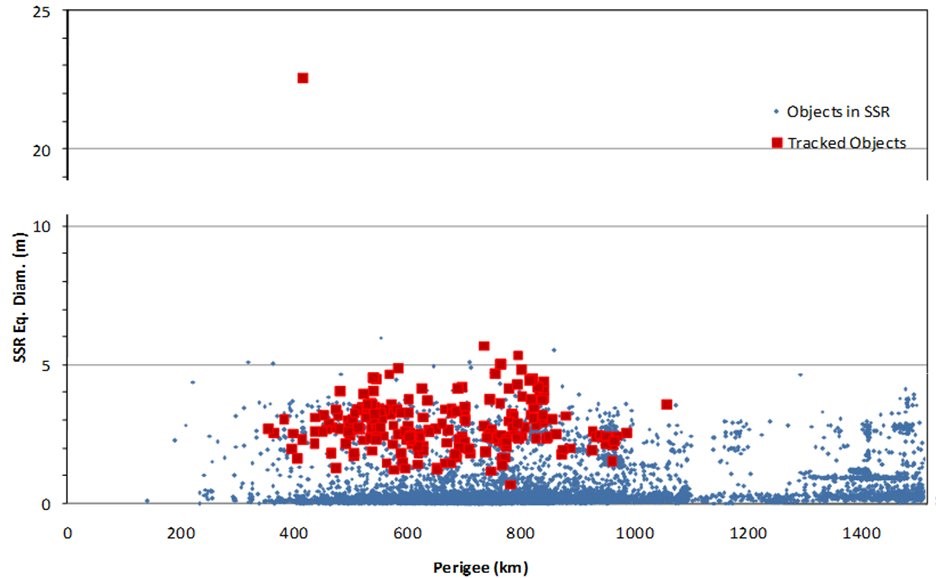 Fig:13 Estimated size of the detected objects with ABISS radar (Red) – Equivalent diameter (m) versus perigee (km) given by Space Track catalogue (Blue dots)
3. Operation of ABISS radar during ExoMars mission
The first ExoMars mission started with the launch of the spacecraft in collaboration with Russian agency Roscosmos. The launch is operated with a Proton rocket from Baikonur cosmodrome, Russian launch center.
Before separating from ExoMars, the Proton launcher vehicle needs three steps to place the spacecraft on its required Earth escape trajectory as shown on Figure 14:
- One first complete revolution around the Earth on a low parking orbit after the lift-off concluded by a boost to change its altitude,
- A second complete revolution on an intermediate eccentric orbit with a new burn to place the launcher on its transfer orbit just above North-West of Spain (in term of ground track),
- A third quasi-complete revolution with a final maneuver to eject the spacecraft on the way to Mars, above Central Africa.
 Fig:14 Estimate trajectory of the launcher (Maneuver sections in red, separation from ExoMars above Africa at magenta dot)
(Sources: blogs.esa.int, http://www.russianspaceweb.com)
The maneuver to move from intermediate eccentric orbit to its transfer orbit during the second phase of the flight is exactly realized in the area where the Field of Regard of ABISS radar can be steered. The radar was set up to steer its Field of Regard so as to cover the area where this maneuver would take place as it can be seen on Figure 15.
 Fig:15 Trajectory of the launcher in the Field of Regard of ABISS radar (orange) during the second passage
The spacecraft was launched on March14th 2016 at 10:31 CET. The burn for this change of orbit was operated around 5 hours after lift-off.
The last stage of the launcher, with the ExoMars spacecraft, was detected by the radar approximately at the expected time when it passed through the Field of Regard [3]. At the beginning of the detection the object was just coming off the perigee of its second revolution and a new burn was operated to go on its transfer orbit. Few plots were directly extracted from the signal processing but a corrected trajectory was calculated after a correlation with a refined trajectory. As the ExoMars launcher is a specific object in terms of kinematic behavior, we decided to have a detailed analysis of radar parameters concerning this detection [1].
Other space objects were detected during the measurements campaign for ExoMars observation. One of them is particularly useful because it appeared almost at the same time as the passage of the launcher as it can be observed on Fig.16. This space object has been identified by data processing as the rocket-debris named SL-14 R/B with a well-known actualized TLE (Two lines Elements).
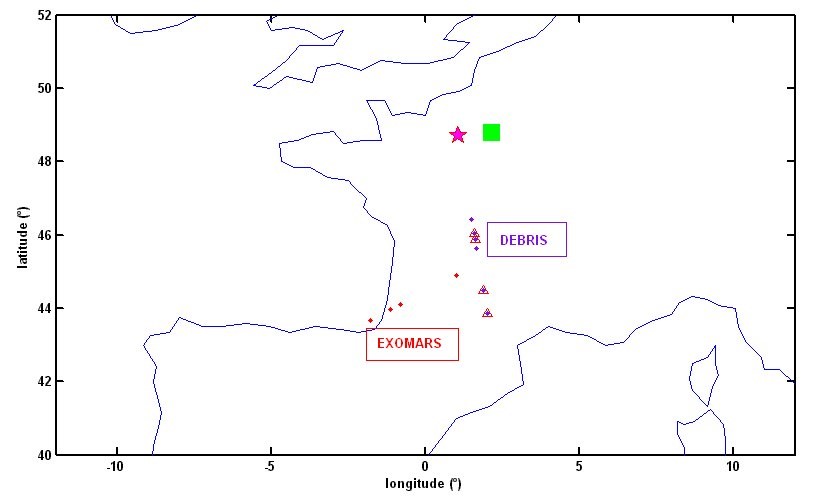 Fig:16 ExoMars launcher and rocket-debris SL-14 R/B detected simultaneously – 14th march 2016 – 10:31 CET – Triangles represent the confirmed positions of detected plots (dots)
Rocket-debris SL-14 R/B, which was detected just before ExoMars passage, is used as a calibration source for speed and acceleration measurements. The visualization of its trajectory in radar axis on Figure 17 shows the good correlation between the plots positions and the TLE of the object.
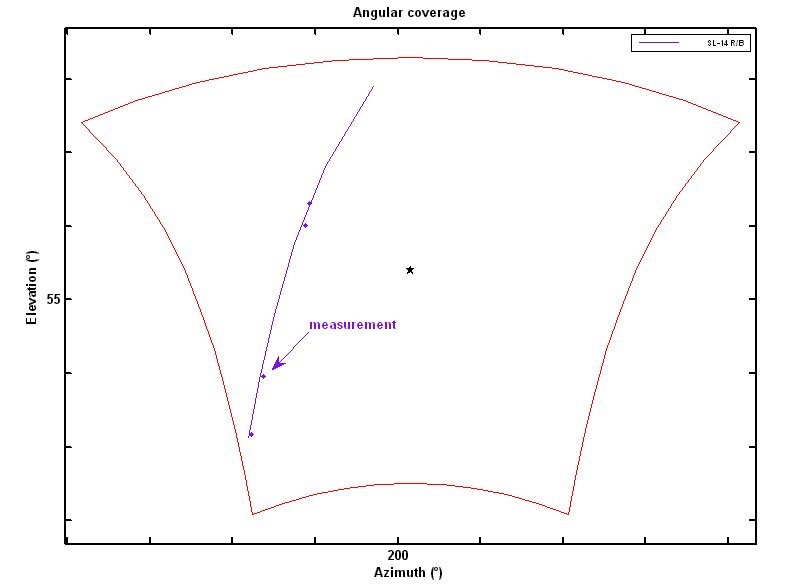 Fig:17 Rocket-debris SL-14 R/B passage in radar axis in UTC reference
As the passage of this object through the Field of Regard was confirmed by the successful tracking and approved by the identification process, the calibration of the radar was realized by evaluating the shift observed on radial speed DV (as shown in Fig.18) and radial acceleration parametersDg (as shown in Fig.19) for each detected plot compared to TLE.
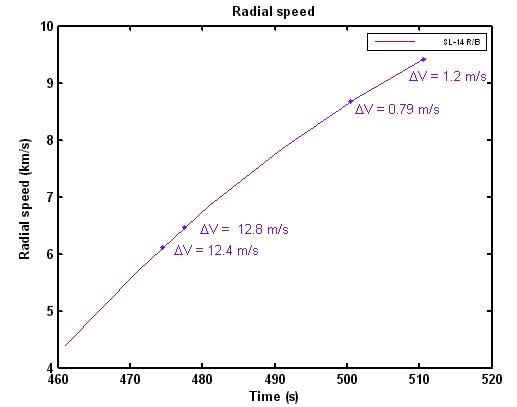 Fig:18 Rocket-debris SL-14 R/B radial speed and error margins
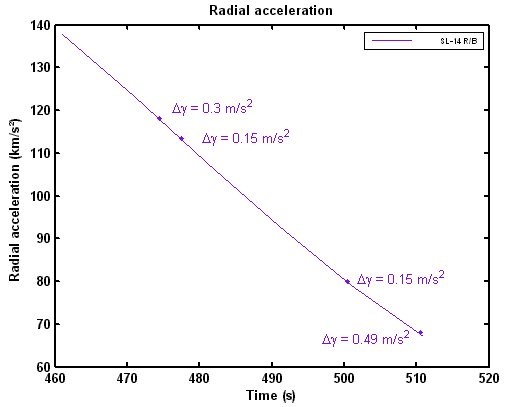 Fig:19 Rocket-debris SL-14 R/B radial acceleration and error margins
Measurements are in accordance with the parameters of movement of the target, no major bias can be observed in comparison with the values deduced from the TLE. The good correlation of acceleration versus speed confirms the synchronization of detections as presented in Fig.20. This could be used to estimate the time shift to apply for recalibration of ExoMars detections. Indeed, biases are expected to be observed along the trajectory of ExoMars because its orbit is not keplerian especially during the thrust phase for the change of altitude of the spacecraft.
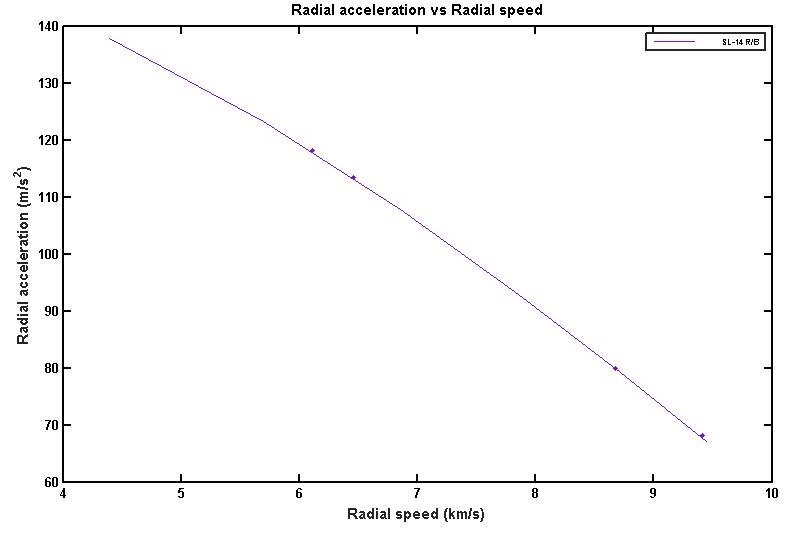 Fig:20 Radial acceleration versus radial speed of SL-14 R/B
Four detected plots of the ExoMars launcher appeared during the time window of the passage through the Field of Regard as spotted on Figure 21.
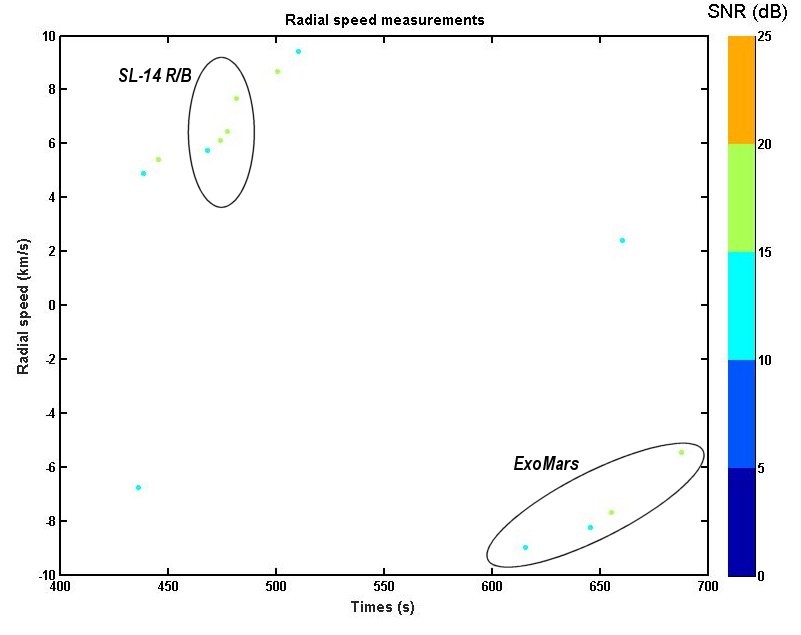 Fig:21 Detected plots around the time of ExoMars passage in the Field of Regard – Radial speed versus time (The two targets of interest have been circled – 4 plots characterize the passage of ExoMars)
The synchronization of these detections was obtained by shifting the reference time by +6 seconds (UTC + 6 s). Only two of them were matched to the estimated trajectory, especially for the beginning of the passage when the object is still in an eccentric orbit at its perigee around 600 km as shown with an estimated trajectory of classical orbit on Figure 22.
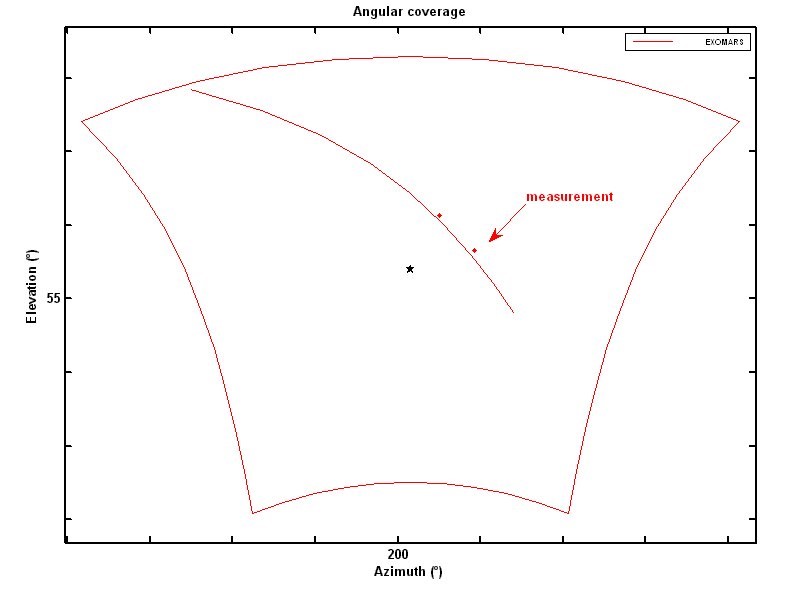 Fig:22 ExoMars launcher passage in the radar axis in UTC + 6 sec
The other two plots are not visible due to the thrust phase of the launcher (change from the second orbit to the third). The figure of radial acceleration (Dg) versus radial speed (DV) for the two matched plots shows an important shift between measurements and predicted parameters from the TLE as observed on Figure 23.
These two biases measured on the parameters of radial speed and radial acceleration, are presented respectively on Figure 24 and Fig.25.
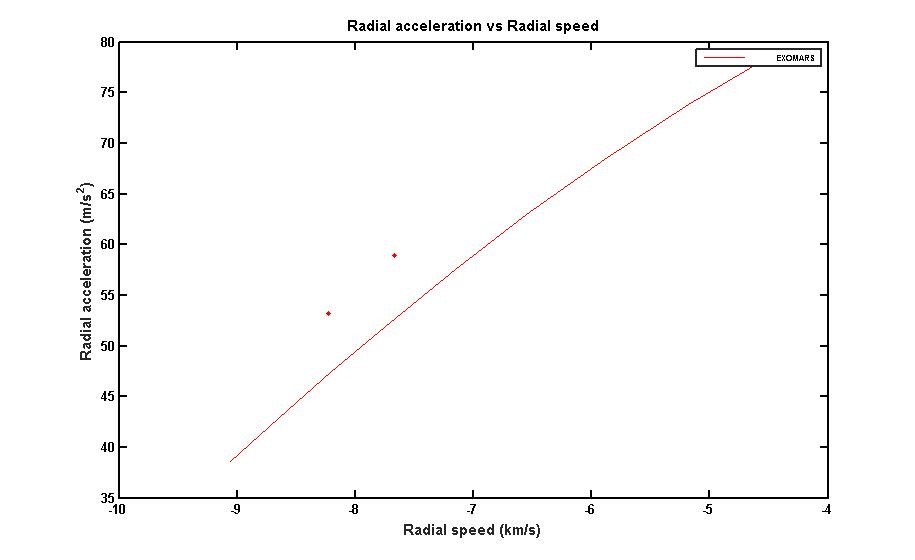 Fig:23 Radial acceleration (Dg) versus radial speed (DV) of ExoMars
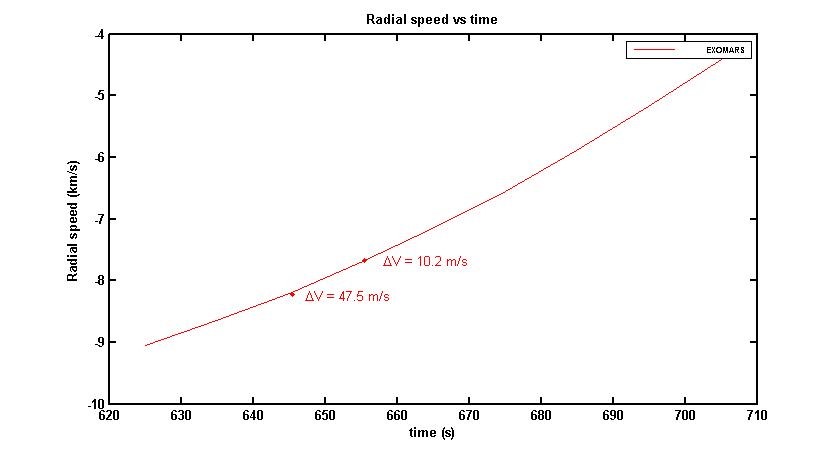 Fig:24 Radial speed of ExoMars for the first 2 detected plots
It can be noticed that the observation of the launcher was excellent during the thrust phase for orbit change, in accordance to the predicted trajectory. As shown on Fig.25, the two last plots of detection of the launcher are outside the limits of the coherence domain with a classical orbit consideration. This is due to the increase of the acceleration for the thrust.).
 Fig:25 Radial acceleration of ExoMars for the last 2 detected plots
4. Conclusion
The challenge was to detect the ExoMars spacecraft still attached to the launcher during its passage of over South Europe with the demonstrator of Space surveillance radar ABISS. The results obtained during this campaign of experiments have shown that such a system has the capacity to detect as well as to match a specific target in the radar area of surveillance during its thrust phase as long as it stays within the domain of coherence of a classical orbit consideration in terms of kinematic.
Conflict of Interest
The authors declare no conflict of interest.
- Saillant, S., ” Kinematic analysis of the ExoMars launcher change of orbit as detected during its passage over Europe “, Proceedings of IEEE Radar Conference (RadarConf17), Seattle (2017).
- Saillant, S., ” Bistatic L-Band Radar To Monitor Space”, Proceedings of International Radar Conference, Lille (2014).
- Saillant, S., ” ExoMars spacecraft detection with European Space Surveillance bistatic radar”, Proceedings of CIE International Conference On Radar, Guangzhou (2016).