Detection the Places of the Heat Energy Leak on the Underground Thermal Pipelines Using the Computer System

Adv. Sci. Technol. Eng. Syst. J. 4(3), 01–09 (2019);
 DOI: 10.25046/aj040301
The purpose of this paper is to improve the thermographic method for detection the places of heat energy losses on the urban underground thermal pipelines using the computer system. This goal was achieved by building a heat map of the surveyed heating main with data layering directly on a computer map of the area, which can be accessed from a mobile device by authorization via the Internet (profile on the social network Google, Facebook, Twitter, etc.). An analytical model was proposed for converting the temperature values measured over the underground heating main by a non-contact digital pyrometer to an image of the RGB color model using the parameters of the HSV color model. The implementation of the integrated Google technologies complex (Google Firebase, Firebase Authentication, and Google Maps) in the technological process of urban housing and public services was realized. The information-measuring computer system (IMCS) was developed. The proposed improvements in the thermographic method provided independently from each other work of different service teams due to the exchange of data between structural units through the cloud data storage. The results of the practical research allowed detecting the place of the underground breakthrough of the heat pipe quickly, to position the repair equipment over the accident section precisely using the GPS module on the mobile device. Thus, the size of the dug road section was minimized, material resources were saved. The experimental studies carried out confirmed the correctness of the theoretical assumptions
1. Introduction
The urgency of the searching problem and the reduction of heat loss via the construction elements is due to the need for a rigorous energy saving. This problem is exacerbated by the work of heat power engineering in many countries because of limited natural fuel resources. Therefore, significant attention is paid to reducing operating costs, and timely detection and elimination of emergencies on the heat mains. The detection of heat energy losses on underground thermal pipelines is the most problematic.
In the conditions of the modern urban economy, losses on heating lines are enormous. Increased heat losses along the pipelines and massive coolant leaks, in addition to economic damages, cause excessive thermal pollution.
In order to comply with environmental requirements, it is necessary to implement a set of measures to eliminate the causes of heat leaks on heating mains. It is necessary to improve the methods allowing receiving thermal energy on the main highways.
2. Related Works
2.1. Overview of methods for determining losses in heat pipes
Methods for detecting and eliminating defects in main pipelines have been described by many researchers and scientists. [1, 2]. All over the world, common attention is paid to non-destructive techniques and technologies like acoustic leak detection, thermal imaging, tracer gas, radiotracers, etc. [1–4].
Scientifically based methods for non-destructive testing of leakages in pipelines are methods based on analysis of transient processes in pipes, in particular, the impedance method [5]. However, these methods have substantial limitations in the representation of system characteristics such as pipeline length (no more than 90 m) and location of leakage.
The detection and recovery time of the carrying capacity of pipeline sections with local damage can be significantly reduced through the measuring and statistical analytical procedures with using of the information-measuring computer system (IMCS).
The method of the negative pressure wave (NPW) is one of the most modern. Using this method, it is possible to track the appearance of a leak on the heating main without leaving the pipeline zone, while remaining at the central control station [6, 7]. At the time of occurrence of leakage of fluid in the pipeline, dilution waves appear. The pressure wave reaches the measuring points on either side of the leak and is recorded at the central dispatch post. The computing system processes the results of the incoming information and promptly calculates the leak location (within 1 minute). However, the accuracy of this method does not exceed ± 200 m.
Currently, sophisticated methods that combine acoustic and correlation principles of leak detection with remote registration on servers over the air are used on heating mains. However, the authors themselves have determined that such practices are ineffective when the heating main is located deeper than 2.5 m [8]. Also, the instruments used in the implementation of these methods do not work in the presence of increased noise (for example, moving vehicles). Considering that the majority of urban heating pipelines are laid under highways, these factors have a negative impact on the research results. The harmful properties of these methods also include the fact that to obtain the measurement results it is necessary to insert the peak of the sensor a good swift kick in the road ground (thus, destroying the highway). Also, there is a danger of the sensor damage by a stone, metal object, the ice, etc. on its way.
2.2. The advantages and features of using the thermographic method
From the analysis of the above methods, we can conclude that the thermographic method is the most promising. Infrared is a proven noninvasive technology, which locates leaks in the systems of heat pipes without any destruction owing to the digging of highways, under which heating mains in cities are usually laid.
Thermal infrared cameras can see leaking heating pipes, water/steam leaks, etc. If used properly, infrared technology is one of the most highly useful diagnostic tools available today.
It’s available to detect places of the local heat leak on the underground thermal pipelines using the IMCS. Such a system should use infrared thermographic devices which can transmit data through wireless ports. This solution helps to determine thermal energy loss location to eliminate unnecessary digging, destruction and expense.
Figure 1, a shows how infrared technology is used to detect a heat loss from steam pipes located under the streets of New York and attributed as a breakdown [9]. These thermal mains demand immediate repair.
Infrared technology in combination with automatic analysis of aerial thermal images allows localizing leaks on district heating pipes immediately in several neighborhoods as shown in Figure 1, b.
In this case, it is essential that the diagnostic equipment moves strictly within the spatial corridor (street) along the heating main [10]. For example, such methods as remote sensing or airborne thermography are widely used in Sweden and Norway [11].
 Figure 1. Infrared detection the local (a) and large-scale (b) places of heat loss following an accident
Figure 2 shows the location of a non-leaking, but un-insulated unions on the heat pipelines (Mykolaiv, Ukraine). Thanks to the thermal imager, it is determined that this is a non-emergency situation and, in this case, a planned repair is needed. In addition, the thermal imaging method has helped not to unearth the entire section of the roadway over the heating main, but to carry out repairs through point pits.
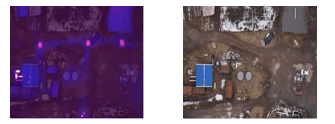 Figure 2. Detection of the places technological heat energy losses through un-insulated unions
Results of heat pipeline leak detection have statistically analyzed using the methods of variance analysis and the pairwise comparison methods. The researches have shown that a higher going speed of IR camera would reduce the effect of noise on the collected thermal contrast and, therefore, would give better results of prediction the leak location [12].
2.3. On lineaments and permits for the use of UAVs for moving thermographic equipment
Usually, the leak imaging system is placed on rotor-wing and fixed-wing UAVs [13, 14]. One of the best modern hardware solutions for studying energy losses on the thermal line is the thermal imaging cameras mounted on a quadrocopter. By applying a UAV, it is possible to specify its operation area accurately [15]. But this solution is relatively expensive and costs about USD 20,000.
Moreover, most often such systems don’t determine accurate GPS coordinates of the accident and are therefore useless for the repair team. At present, the leak detection team should wait for repairers at the identified accident section or create written and photo records.
It is positive that modern leak detection methods locate heat leak accurately to 1 sq. m, so any excavation reduces to a minimum when the pipes are repaired. However, such systems also don’t have an accurate reference to the location by GPS coordinates. After detection, the place of thermal energy leaks, the written report with photos of thermogram locations and recommendations are made [3, 16, 17].
Due to the lack of the identification of technological objects in these methods, a manual inspection with accordance to the route was visualized on the map is done, after which a heat map is created [18].
In the Czech Republic, the system Workswell WIRIS has been developed, which can be fitted with a GPS sensor for storing location information on the position of the drone when producing a record about the detection of hot water leaks [14]. This system is designed to be mounted on a drone (UAV) too.
But there are two problems for the implementation of this method of study of energy losses. First, the above means of the thermal measurements are too expensive. Second, on June 11, 2018, the State Aviation Service of Ukraine banned flights of remotely manned aircraft (drones or UAVs) over roads of state importance, streets of cities and villages, etc. [19]. Similar prohibitions on the use of drones on the territory of settlements exist in other countries – Italy, Austria, Czech Republic, Great Britain, etc. [20, 21]. In USA the FAA rule will not allow operation of a small unmanned aircraft over a moving vehicle because impact of a small unmanned aircraft may distract the driver of a moving vehicle and result in an accident [22].
Thus, the problem under consideration is relevant not only for Ukraine but also for the majority of countries of the world using underground heat mains.
3. Problem Formulation
The purpose of the work is to improve the thermographic method for detection the places of heat energy losses on the urban underground thermal pipelines using the IMCS.
The object of the work is the data receiving and handling process for detection heat loss using a combination of terrain maps and results of heat measurements.
The subject of the work is a system for creating heat maps of energy leak on thermal pipelines according to the data of pyrometric non-contact measurements over the surface of underground heat mains.
The purpose of the work is achieved by solving the following research tasks:
- Analysis of existing algorithms and methods implementing heat map construction on the basis of collected data.
- Analysis of the existing base of devices for research and analysis the current temperature of objects.
- Development of an analytical model for forming a heat map and calculating its statistical indicators.
- Development of a software application for detection of heat energy leaks on thermal pipelines and visualizing the results of measurements on heat maps of the area.
In this article, it is proposed to collect thermal data using an on-duty car equipped the IMCS based on tablet and manual pyrometer with wireless transmission of measured temperatures to achieve the goal.
Unlike the above examples, this measuring device (that costs about $100 USD) has several advantages such as:
- Measuring the temperature of the object with the help of non-contact infrared beam.
- The ability to transmit data through Bluetooth port 4.0 to the computer equipment.
- Laser sight in the form of a circle with a point in the middle, that well visible at a sufficiently large distance (from the on-duty car).
- It is compact, convenient and not harmful for the operator health, unlike the equipment described in [5–9].
The practical value of the work is:
- Detection and localization of the breakthroughs of the heating main for the planning of repairing works, maintenance, etc.
- The possibility of identifying objects which emit heat.
4. Methods and techniques used for the solution of the problem
4.1. Development of the information-measuring computer system for detecting heat leaks
Thus, due to the inability to use drones for the inspection of heating mains in urban areas, it is proposed to analyze the thermal pipe state using a non-contact pyrometer. For example, the Testo 805i model can be used. The pyrometer and the tablet are the part of the IMCS on board the on-duty machine moving the diagnostic team.
Bluetooth infrared thermometer Testo 805i allows transmitting the measurement data to the mobile device (smartphone, tablet, etc.) via Bluetooth port 4.0 at a distance of 15–20 m. It requires iOS 8.3 (or later) / Android 4.3 (or later).
Unfortunately, the Testo 805i doesn’t measure automatically, so, to receive data, it is necessary to press the button on the device each time. Doing every 10 seconds, the temperature will be measured every 100 m at a speed of 40 km/h (10 m/s).
The measured temperature is recorded into the database of the mobile device and uploaded to the cloud storage.
The structure of such a database should include separate fields for displaying different types of data in the processed request (dates, ambient temperature, temperature above the surface of the heating main, geolocation data of the break section, etc.) [23].
Then measured data can be plotted on the terrain map as values or as a heat map.
The structural scheme of the improved thermographic method of detecting leak places on heat pipes is shown in Figure 3.
Black color indicates the main blocks, hardware and software components and the primary connections between them, used in currently applied thermographic methods for detecting the breakthroughs of the heating main. The first proposed improvements to existing methods are highlighted in red.
It should be noted that thanks to the proposed modifications, the repair team can operate autonomously, regardless of the diagnostic team, and receives information about the place of the necessary repairs directly from the cloud storage. Also, the presence of the geo-coordinates of the accident section allows you to accurately position the repair equipment over the place of the heating main breakthrough. Replacing equipment from thermal imaging to pyrometric not only significantly reduces the cost of the solution, but also allows you to obtain digitized data associated with GPS coordinates.
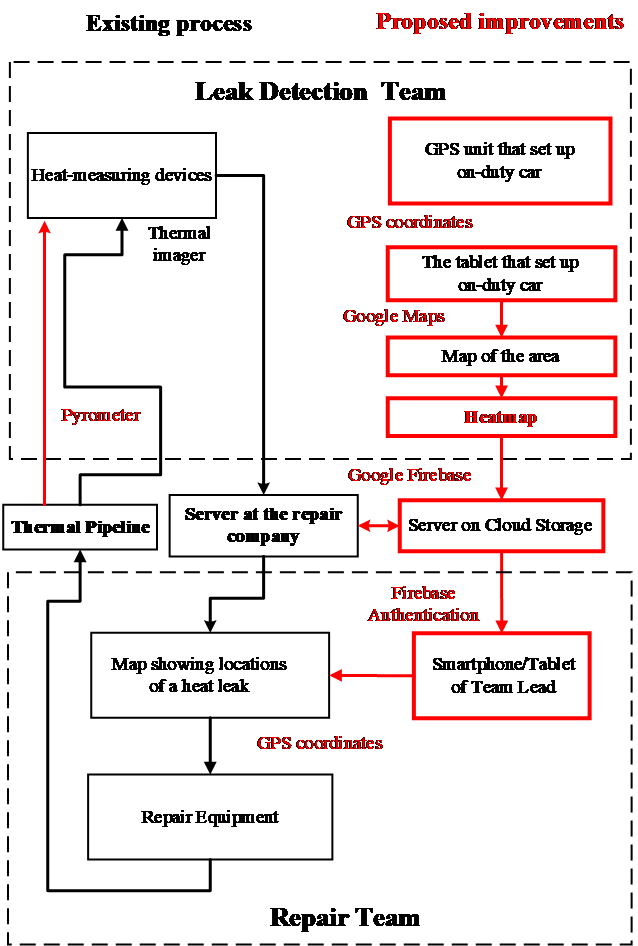 Figure 3. Structural scheme of the improved method for detecting leak places on heat pipes
Figure 4 shows a flowchart of the heat map formation.
Initially, temperature data is measured with a pyrometer, and if these data have been measured, they are recorded in the database, if not – the heat map will not be built, further measurements are crucial.
Further, when the temperature data have been received to the phone (or tablet), there is a process of tracking the coordinates, namely latitude, and longitude, using a GPS module of mobile phone or tablet. If the data is received – it is also entered in the database, and in the case of its absence – the heat map will not be built. The on-duty car equipped with IMCS moves further, to a point with new geolocation, where subsequent measurements would be made.
The final stage is the very construction of a heat map. To do this, you need to add GPS coordinates with measured temperature values into Google Maps [24]. To do this, it is necessary to use the library com.google.maps.android:android-maps-utils.
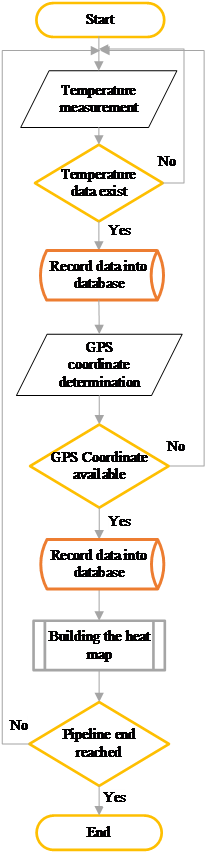 Figure 4. Flowchart of the heatmap building algorithm
The distinctive feature of the proposed method is the application of cloud technologies when obtained data (temperature and GPS coordinates) is uploaded to Google Firebase [25]. In this case, we propose an extended technological process shown in Figure 3.
4.2. Results of measurements and input data for research
During the practical research, measurements of the temperature over the heating main were carried out in preparation for the heating season (in October) on the segment of the thermal pipeline limited by the geocoordinates given in Table 1, along one street.
As a result of the temperature measurements, a breakthrough of the heat pipe was detected. The temperature over the heat main that differs significantly from others evidenced that.
Table 1. Temperature measurements on the thermal pipe in preparation for the heating season (in October)
| Temperature (оС) | East longitude (degree) | North latitude (degree) | Conclusion on the state of the thermal pipe |
| +13.8 | 32.011009 | 46.970312 | holistic |
| +14.2 | 32.012510 | 46.967368 | holistic |
| +14.1 | 32.013154 | 46.965597 | holistic |
| +22.6 | 32.013060 | 46.962030 | breakthrough |
| +25.2 | 32.012781 | 46.961381 | breakthrough |
| +7.2 | 32.012688 | 46.958510 | holistic |
| +7.0 | 32.011994 | 46.953942 | holistic |
| +7.1 | 32.012019 | 46.949474 | holistic |
Table 2. Temperature measurements on the thermal pipe
during the heating season (in January)
| Temperature (оС) | East longitude (degree) | North latitude (degree) | Conclusion on the state of the thermal pipe |
| +3.6 | 32.011009 | 46.970312 | holistic |
| +4.1 | 32.012510 | 46.967368 | holistic |
| +4.4 | 32.013154 | 46.965597 | holistic |
| +5.2 | 32.013060 | 46.962030 | holistic |
| +5.2 | 32.012781 | 46.961381 | holistic |
| +3.4 | 32.012688 | 46.958510 | holistic |
| +3.0 | 32.011994 | 46.953942 | holistic |
| +4.1 | 32.012019 | 46.949474 | holistic |
After carrying out repairs, another temperature measurement of the heating main was made at the same points. Measurements were made during the heating season (in January), then the environment temperature was lower (Table 2). Therefore, the average temperature over the surface of the thermal pipelines has decreased compared to the previous measurements made in October.
However, as it can be seen, the temperature along the heating main does not differ significantly from one another, which is why we conclude that the breakthrough of the heating main in this place has been eliminated.
4.3. An analytical model for the formation of a heat map
It should be noted that tabular data is very inconvenient for perception and rapid analysis. Therefore, it was decided to build the heat map with visualizing of found heating main emergency sections on the area map on the basis of the measurements. For this purpose, an analytical model for the formation of a heat map was developed.
Two color models, RGB and HSV, are selected for conversions [26]. The RGB model describes the color space based on Red, Green and Blue colors (Figure 5, a). The HSV model operates with parameters Hue, Saturation and Value (Figure 5, b).
 Figure 5. RGB (a) and HSV (b) color models
However, if the colors are supposed to be interpreted using the human visual system, it is advisable to integrate the RGB space and the HSV space [27]. Besides, diagnostic and repair work on heating mains can be carried out at different times of the day, and the HSV color space is more resistant to changes in lighting. Therefore, it is advisable to formulate the mathematical equivalent of the projection of the HSV model vectors in the RGB color space.
In contrary to the studies about the usage of color models mentioned above [26–27], in this article, we propose using parameters Hue and Value of the HSV color model to construct the color gradient in the RGB color model. In this case, parameter Saturation equals a constant value. This approach reduces the computing power requirements concerning an IMCS set in an on-duty car. Thanks to that building a heat map for the thermal mains and combining it with a terrain map can be performed even on a tablet instead of a laptop with higher performance, but also more cumbersome and inconvenient to use in a moving car.
The pyrometer readings, corresponding to the seasonal temperature value of the section of the pipeline, are successively added to the array of temperatures where is the number of all rows of temperature values for each from seasons, – the number of columns of each temperature value in the matrix of the input file data to build a heat map.
To recount the parameters of the HSV color model in the value of each spectrum of the RGB color model, the temperature coefficient k of the HSV model should be calculated according to (1). This will allow scaling the temperature values to the color of a certain tone. To switch to the parameters of the color model, it is also necessary to calculate the basic statistical parameters, namely the maximum and minimum values of the temperature (2) – (3) from the set of temperatures (4):
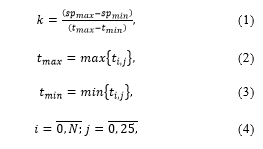 where – selected the maximum value of the color tone (Hue) of the HSV model, which corresponds to the red color; – selected the minimum value of Hue of the HSV model, which corresponds to the green color. On the basis of the set minimum (green) and maximum (red) Hue values, a range is formed in the middle of which the value of 240° corresponds to the blue color, which in turn is the spectrum of the RGB color model.
Then the color tone parameter for each heat map segment using the temperature coefficient for the conversion the temperature values to the color values are calculated on the basis of the formula (5):
![]() In a heat map, to draw a small segment of a certain color of the RGB palette, you need to convert the temperature values using the HSV color parameters. In the proposed analytical model (6) – (9) the saturation ” ” is taken as a constant ( ). This parameter does not appear in further calculations to reduce the computing costs of a mobile device with limited computing capabilities, which is used in the described IMCS for thermal pipelines inspection. – the minimal digit of the parameter “Value”.
In a heat map, to draw a small segment of a certain color of the RGB palette, you need to convert the temperature values using the HSV color parameters. In the proposed analytical model (6) – (9) the saturation ” ” is taken as a constant ( ). This parameter does not appear in further calculations to reduce the computing costs of a mobile device with limited computing capabilities, which is used in the described IMCS for thermal pipelines inspection. – the minimal digit of the parameter “Value”.
Therefore, the next step in forming a thermal image in the proposed analytical model is the conversion of temperature data into a color RGB model based on the rated values of HSV model parameters.
The values of the red, green, and blue components of the RGB spectrum are labeled , , and , respectively and calculated as follows:
 In this case, the higher the temperature the more the color is close to the red, and vice versa – the colder the temperature the more the color is closer to the blue. As shown in Figure 6, a, in the described model, the temperature scale is implemented in the temperature range from 0 to +25°C, which corresponds to the season when the heat pipelines in the region under consideration are prepared for the heating season.
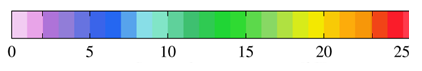 Figure 6. Temperature scale for the season
It should be noted that thermal measurements can be carried out in different seasons when the temperature of the environment varies considerably over the seasons. When researching at another time of year, the visual temperature scale should be replaced by another scale reflecting temperature values that coincide with the seasonal ones.
When constructing temperature scales, it should be noted that the operating temperature range for the pyrometer is from minus 10°С to +50°С. But with negative values of the ambient temperature, the measurement error is significantly increased. Therefore, further temperature scales were built only for ranges in which the pyrometer measurement error did not exceed 1.5 %.
4.4. The software development
The software was developed in Android Studio 3.3.1, an application created for the Android platform with JDK ver. 11.0.
Let’s consider the life cycle of the application. On the initial phase of the application, the task should be sent to diagnostic teams for inspection of the area.
Using the Firebase Cloud Messaging (FCM), the system server sends messages to clients about current tasks. There is an ability to send notifications (up to 2K bytes) and data messages (up to 4K bytes).
Upon receiving the assignment, the diagnostic teams on a duty car are headed to places of information gathering. After their arrival, the system reads its GPS coordinates and sends a message to the server about the diagnostic team location.
The diagnostic team of specialists measures the temperature values using pyrometers. Data via Bluetooth 4.0 technology are transmitted to a tablet/notebook storing a local database in SQLite. When the tablet is connected to the Internet, information is sent to the cloud database.
After completing the inspections by the diagnostic team, other services (mobile clients) will receive a message through the FCM for further works on the territory.
Using the web version of the application helps to create reports based on the data collected. The JasperReports library is used to generate reports on the server.
The UML Class Diagram of the developed application is given in ”the help file” in the code repository. The shared code that would be good for further researching by other scientists is also placed there.
The following classes were developed:
CurrentApplication – the class responsible for the life cycle of the application. It performs one or another action depending on the state of the application.
PointModel is the class responsible for representing the single point information that is displayed on the map.
PointPackModel – a class serving as a container for the PointModel list.
BaseActivity is the base class (parent) for all Activity entity. This class is responsible for the elements with visual content.
BaseMapActivity is a class with the basic functionality of Google Map.
SplashActivity is the class responsible for displaying the application loading screen.
MainActivity is the class responsible for displaying a map with functional points.
5. Experimental Results and Analysis
Figure 7 shows screenshots of the interface of the developed Android application.
In Figure 7 you can see the map and two buttons. The button “Location” is responsible for the current location of your mobile device (or tablet). The button “Open” is responsible for opening a file from the database needed to build a heat map.
The file was filled via a Bluetooth-port with results of temperature measurements made a pyrometer Testo 805i.
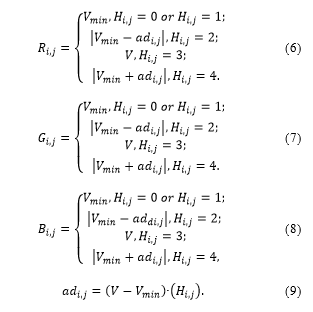
From the analysis of the heat map in Figure 7, the place of heat energy leak from the underground pipeline can be seen (in the area highlighted by a yellow square). It is possible to speak about the presence of heat leaks based on the temperature gradient constructed on the scale in fig. 6. The red color inside the selected two spots (in the color spots above on the map there is no such color at all, or it is represented in an insignificant proportion to the area of the whole spot) indicates the presence of heat leaks in these places of the heating main. In the developed system, accurate geo-coordinates (latitude and longitude) of the section of the break of the underground heating main are registered and available to the repair team (see Table 1). These coordinates can be refined by more frequent pyrometric measurements at a previously diagnosed area and marked on a Google map of a larger scale. Then it will be possible, with higher sampling, to perform image segmentation of the spot of the color scale for sensors of the automated system of technological control [28]. The maximum spot area, indicated in the red inside, will show a more accurate accident section. This will allow the positioning of repair equipment directly above the area of the heating main break. The accuracy of diagnosis is limited only by the measurement interval of the device (3 seconds) and the speed of movement of the operator of the diagnostic team.
Automated fixation of the geo-coordinates of the accident site with their plotting on the terrain map is performed in none of the methods described in the literature.
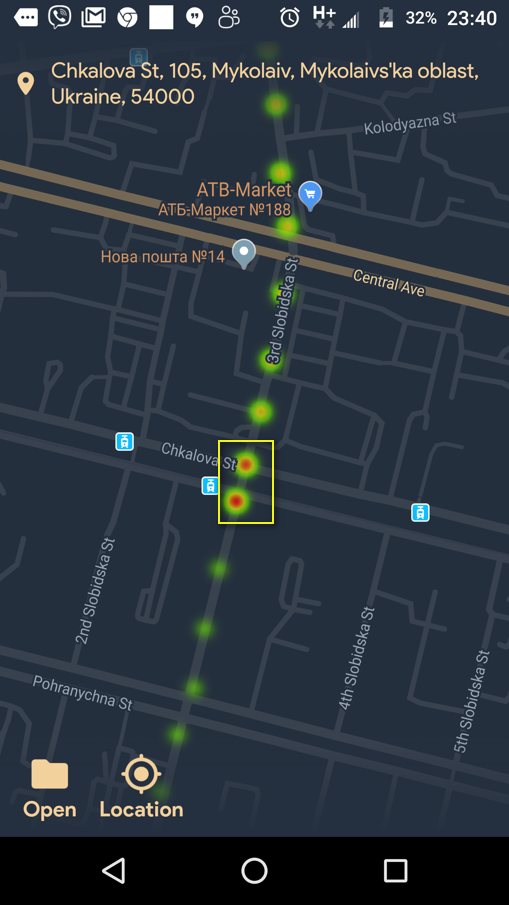
 Figure 7. The heatmap showing the breakdown (а) on the thermal pipeline and its eliminated (b)
With the data of the developed IMCS, it is also possible to conclude that after the detected leakage point along the pipe main, the temperature over the surface of the underground heating pipe has been reduced to the ambient temperature on the date of measurement (green labels in Fig. 7, but without a color gradient according to the developed temperature scale for the studied season).
After the computer diagnostics were carried out, the received data was transferred to the corresponding repair company. The unearthing of the heating pipeline by the found coordinates of the breakthrough has confirmed the fact of the accident precisely in the detected place of the heating main. It was discovered as a result of temperature measurements and reflected in Figure 7, a. The red color in the center of the spot corresponds to the raised temperature. And Figure 7, b shows the same place, but already with the eliminated breakthrough (see the yellow rectangle).
The advantages of the proposed method are that the repair team can operate independently of the work schedule and the location of the diagnostic team specialists. When the repair team arrives at the place of heat energy leakage, the brigadier is authorized on Firebase by any mobile device (smartphone, tablet, etc.). In this case, his profile in any social network can be used – Google, Facebook, Twitter, etc.
When the access to the heat map of the thermal pipeline has given, brigadier of the repair team can compare the own GPS coordinates with the coordinates received from the cloud service. Then it is able to combine the repair equipment accurately (excavator, pump, etc.) with detected places of the heat energy leak from the heat map.
6. Conclusion
Based on the analysis of the methods the detection of the thermal energy leak places on thermal pipelines, the relevance and necessity of developing new analytical models and software for the search and mapping leaks on heating mains with the help of heat maps have been established.
An analytical model for forming a heat map and calculating its statistical parameters was proposed. The convert of the temperature values of a non-contact digital pyrometer from an underground heating main to the image of the RGB color model using the parameters of the HSV color model was substantiated.
A software application for building heat maps based on measured temperature data for the Android platform with JDK 11.0 version was developed. Introduced Firebase Authentication, integrated with popular social services. Due to the heat map layered on Google Maps, the repair team got the opportunity access to detected places of the heat energy leak regardless of the work schedule and the location of the diagnostic team.
Experimental researches with the developed IMCS for the needs of urban housing and communal services for detection places of heat energy leak in the city underground thermal mains due to pipe accident have been carried out. The conducted studies confirmed the sufficient accuracy of the results for the optimal location of repair equipment on detected places of the pipe breakthrough.
The perspective of further development of the thermographic method to detect the places of heat energy loss using the IMCS and cloud services has shown.
As a development of the method, it can be supplemented, besides the technology of processing surface temperatures, also with information technologies of visual information processing on purpose more accurate geo position of heat leaks [29].
In the future, the proposed method for the diagnosis of thermal outflows can be used for both technical and biological objects. For each of the goals, it will be necessary to build separate temperature scales in the appropriate temperature range based on the proposed analytical model. Also, the pyrometric equipment should also be selected with the accuracy of measurement and the price of dividing the scale corresponding to the constructed temperature scale.
The developed system has a lower cost (up to 50 times) compared with similar thermographic systems based on thermal imagers. Also, the proposed system is safe for the operator compared to diagnostic systems based on ultrasound, radiation and electromagnetic non-invasive methods for monitoring heat leaks described in the analyzed literature.
Conflict of Interest
The authors declare no conflict of interest.
Acknowledgment
The research was carried out with the support of the Ministry of Education and Science of Ukraine within the framework of the state-funded scientific research works at the Petro Mohyla Black Sea National University.
- Non-destructive Testing and Repair of Pipelines. E. N. Barkanov, A. Dumitrescu, I. A. Parinov (eds), Springer, Cham, 2018. doi: 10.1007/978-3-319-56579-8.
- M. Fahmy, O. Moselhi, “Detecting and locating leaks in Underground Water Mains Using Thermography” in 26th International Symposium on Automation and Robotics in Construction (ISARC 2009), 61–67, 2009. https://www.irbnet.de/daten/iconda/CIB14819.pdf.
- “Central heating leaks” [L.D.S Leak Detection Specialists Ltd.]. https://www.leakdetectionspecialists.co.uk/central-heating-leaks.htm.
- “Leak Detection in Heat Exchangers and Underground Pipelines Using Radiotracers” [Material for education and on-the-job training for practitioners of radiotracer technology], Vienna, International Atomic Energy Agency, 2009. https://www-pub.iaea.org/MTCD/Publications/PDF/TCS-38_web.pdf.
- S. Kim, “Holistic diagnosis of pipeline system with impedance method” PROCEDIA ENGINEER, 70, 924–933, 2014. doi: 10.1016/j.proeng.2014.02.103.
- J. Liua, H. Sua, Ya. Maa, G. Wanga, Yu. Wangb, K. Zhang, “Chaos characteristics and least squares support vector machines based online pipeline small leakages detection” CHAOS SOLITON FRACT, 91, 656–669, Oct. 2016. doi: 10.1016/j.chaos.2016.09.002.
- M. Valincius, M. Vaisnoras, A. Kaliatka, “Study and demonstration of pressure wave-based leak detection in a district heating network” STRUCT INFRASTRUCT E, 14 (2), 151–162, 2018. doi: 10.1080/15732479.2017.1330892.
- X. H. Tang, Y. B. Liu, L. J. Zheng, C. B. Ma, H. Wang, “Leak Detection of Water Pipeline Using Wavelet Transform Method” in International Conference on Environmental Science and Information Application Technology (ESIAT 2009), Wuhan, PEOPLES R CHINA, 2009, 2, 217–220. doi: 10.1109/ESIAT.2009.57.
- “Infrared Inspection Services – Thermography and Thermal Imaging in New York, NYC, Long Island and New Jersey for Commercial Industry and Property Management” [web-site of Infrared Imaging Services LLC]. http://www.infraredimagingservices.com/commercial.
- M. P. Musiyenko, I. M. Zhuravska, I. V. Kulakovska, A. V. Kulakovska, “Simulation the behavior of robot sub-swarm in spatial corridors” in 2016 IEEE 36th International Conference on Electronics and Nanotechnology (ELNANO–2016), Kyiv, Ukraine, 2016, 382–387. doi: 10.1109/ELNANO.2016.7493090.
- O. Friman, P. Follo, J. Ahlberg, S. Sjokvist, “Methods for large-scale monitoring of district heating systems using airborne thermography” IEEE T GEOSCI REMOTE, 52 (8), 5175–5182, Aug. 2014. doi: 10.1109/TGRS.2013.2287238.
- A. Hawari, M. Khader, W. Hirzallah, T. Zayed, O. Moselhi, “Integrated sensing technologies for detection and location of leaks in water distribution networks” WATER SCI TECH-W SUP, 17 (6), 1589–1601, Dec. 2017. doi: 10.2166/ws.2017.044.
- G. R. Stockton, “Leak Detection – Aerial Thermal Mapping Reveals Leaks in All Types of Systems” in CampusEnergy2017 [International District Energy Association]. Miami, FL, Feb. 20–24, 2017. https://www.districtenergy.org/HigherLogic/System/DownloadDocumentFile.ashx?DocumentFileKey=5ae4b471-ee47-9f2f-4443-94a8fe505273.
- “Inspection of hot-water and warm-water pipes” [web-site of the Workswell s.r.o.]. https://www.workswell-thermal-camera.com/inspection-hot-water-warm-water-pipes/.
- I. Zhuravska, I. Kulakovska, M. Musiyenko “Development of a method for determining the area of operation of unmanned vehicles formation by using the graph theory” Eastern-European Journal of Enterprise Technologies, 2, 3 (92), 4–12, 2018. doi: 10.15587/1729-4061.2018.128745.
- “Thermal Mapping – Inspection of District Heating” in Case Study for Drone Systems – with Thermal Capture Recorder 2.0 640, Copenhagen, Denmark. https://thermalcapture.com/thermal-mapping-inspection-of-district-heating/.
- P. M. Bach, J. K. Kodikara, “Reliability of infrared thermography in detecting leaks in buried water reticulation pipes” IEEE J SEL TOP APPL, 10 (9), 4210–4224, 2017. doi: 10.1109/JSTARS.2017.2708817.
- E. Cornelis, F. Meinke-Hubeny, “The STRATEGO Project No: IEE/13/650 (Multi-level actions for enhanced Heating & Cooling plans)”, European Union, May 29 2015. http://stratego-project.eu/wp-content/uploads/2014/09/D3_7a-STRATEGO-WP3-Mapping-methodology-and-data-sources.pdf.
- “Rules for Use of Airspace of Ukraine”, State Aviation Administration of Ukraine, 430/210, May 11 2018. https://avia.gov.ua/wp-content/uploads/2018/05/TYMCHASOVYJ-poryadok-VPPU_31.05.18-2.doc (In Ukrainian).
- “Regulation of the European Parliament and of the Council on common rules in the field of civil aviation”, Brussels, July 12 015. http://ec.europa.eu/smart-regulation/impact/ia_carried_out/docs/ia_2015/swd_2015_0262_en.pdf.
- “Airspace restrictions for unmanned aircraft and drones” [Civil Aviation Authority – CAA in the United Kingdom]. https://www.caa.co.uk/Consumers/Unmanned-aircraft/Our-role/Airspace-restrictions-for-unmanned-aircraft-and-drones/.
- “Unmanned Aircraft Systems (UAS)” [U.S. Department of Transportation – Federal Aviation Administration, FAA]. https://www.faa.gov/uas/.
- M. Fisun, M. Dvoretskyi, A. Shved, Y. Davydenko, “Query parsing in order to optimize distributed DB structure” in 2017 IEEE 9th International Conference on Intelligent Data Acquisition and Advanced Computing Systems: Technology and Applications (IDAACS 2017), Bucharest, Romania, 2017, 1, 172–178. doi: 10.1109/IDAACS.2017.8095071.
- E. Price, “Create a heat map of your Google location history with this tool”, Apr. 11, 2018. https://lifehacker.com/create-a-heat-map-of-your-google-location-history-with-1830215410.
- K. S. Ashok, Mastering Firebase for Android Development: Build real-time, scalable, and cloud-enabled Android apps with Firebase, Packt Publ., 2018.
- S. Kolkur, D. Kalbande, P. Shimpi, C. Bapat, J. Jatakia, “Human skin detection using RGB, HSV and YCbCr color models” [ICCASP/ICMMD-2016] ADV INTEL SYS RES, Atlantis Press, 137, 324–332, 2017.
- M. Loesdau, S. Chabrier, A. Gabillon, “Hue and saturation in the RGB color space” [Lecture Notes in Computer Science], 8509, 203–212, Springer, Cham, 2014. doi: 10.1007/978-3-319-07998-1.
- M. Fisun, W. Smith, A. Trunov, “The vector rotor as instrument of image segmentation for sensors of automated system of technological control” in the 12th International Scientific and Technical Conference on Computer Sciences and Information Technologies (CSIT 2017), Lviv, Ukraine, 2017, 1, 458–463. doi: 10.1109/STC-CSIT.2017.8098828.
- G. Shcherbakova, S. Antoshchuk, A. Sachenko, M. Gerganov, M. Polyakova, V. Krylov, “ “ in the 2018 IEEE 2nd International Conference on Data Stream Mining and Processing (DSMP 2018), Lviv, Ukraine, 2018, 1, 605–608. doi: 10.1109/DSMP.2018.8478551.