User’s Demographic Characteristic on the Evaluation of Gamification Interactive Typing for Primary School Visually Impaired with System Usability Scale

Adv. Sci. Technol. Eng. Syst. J. 5(5), 876–881 (2020);
 DOI: 10.25046/aj0505107
This paper extends the gamification interactive typing for Primary School Visually Impaired in Indonesia with some development according to previous user’s feedback. This study focuses in to renew the application and evaluate the updated application for visually impaired children developed by utility Unity software. Besides, standards of good gamification are worthy of study and can increase the motivation to learn, and it only can happen if it meets the needs of the user. To achieve those goals, it has completed some development on several sections includes the homepage, input text, text size, and scoring. In this paper, System Usability Scale (SUS) is utilized, and some statistical model is conducted such as average, mean, Pearson-Product Moment correlation, T-test, and ANOVA. T-test results show that no difference between the partial and fully visually impaired participant, gender, and participants who used a similar application and not. The grades do not affect the SUS score, so it proved that the collected SUS score as average 75 is an objective result from the users although the average grade is 46. Moreover, both variable usability (0.884) and variable learnability (0.771) are positively correlated toward the System Usability Scale, notwithstanding variable usability and variable learnability is not correlated (0.383). The impact of this research can improve the industries especially the education field in Indonesia and some expectations from that result are included experience, knowledge, and skills of the users that need to be evaluated in further research. Hence, in the future, by using this application, we can increase the standard of living visually impaired people and enhance industry 4.0 in Indonesia.
1. Introduction
The International Organization for Standardization ISO 9241-11 has defined usability as the “Extent to which a product can be used by specified users to achieve specified goals with effectiveness, efficiency, and satisfaction in a specified context of use”[1].
This paper extends the gamification interactive typing for Primary School Visually Impaired in Indonesia to meet some suggestions [2] with some studies on the context of the effectiveness of the games in learning for visually impaired children. According to that paper, several categories include name page, score, subject matter, sound, user experience, and information. This study focuses on updating the application and evaluating the latest application for visually impaired children developed utilizing Unity engine.
There are many models for evaluating the usability of the application or software such as the User Experience Questionnaire (UEQ)[3], Game Experience Questionnaire (GEQ)[4–6], Computer System Usability Questionnaire (CSUQ)[7], Quality Function Deployment (QFD)[8], Questionnaire for User Interface Satisfaction (QUIS), and System Usability Scale (SUS). CSUQ, QUIS, and SUS reach only 30-40% accuracy with a sample size of only 6, while SUS increases about 75% accuracy at a sample size of 8 and reaches 100% at a sample size of 12 as stated by Tullis and Stetson [9]. In this paper, we utilized the System Usability Scale conducted by John Brooke[10]. This system is utilized to access the nutrition application that provides an effective human and virtual coaching approach to raise parent’s awareness about children’s eating behavior and lifestyle [11]. Moreover, the System Usability Scale (SUS) is also has used to access user satisfaction on interactive maps for the visually impaired [12] and e-learning systems [13]. Furthermore, the questionnaire is modified with GEQ and UEQ so that applications can be tailored to the needs of users.
2. Research Method
Based on the results of research from a previous paper [2], proper gamification standards are feasible to study and can increase learning motivation because user needs are met. After conducting several model evaluations, the applications created ordinarily require the development of user input, so that what is expected is achieved.
This application, which is intended for the blind Primary School in Indonesia, was developed using Unity Engine which has a universal system that can adapt to current technology needs, such as a personal computer, a mobile, head-mounted display, the internet of things, and various platforms (see figure 1).
Figure 1: Compatible Platform with Unity Engine [14]
Unity engine also offers all the features needed to create beautiful, engaging, and enhanced content with sustainable engine upgrades with multi-platform support, documentation, forums, and tutorials, and therefore a lot of developers eager to use that engine.
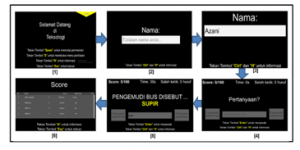
Figure 2: Page Flow of Application
In this paper, we adopted the DECIDE framework to utilize the evaluation. This framework is proposed by Rogers et al. (2011) [15] as a usability evaluation framework. This framework used as a guide for evaluating the usability of the LMS Moodle by Melton [16], Planning Support System (PSS) conducted by Russo et al. (2015) [17], and virtual laboratory of open-source programming in a virtual classroom based on Moodle in 2016 [18]. The phase-in of this framework includes six stages, namely:
- Determine the Evaluation Goals
In this first phase, we determine the purpose of this evaluation. The purpose is to evaluate the usability of the updated application.
Table 1: Comparison Previous and Current Application
| Section | Old Application | New Application |
| Home Page | The application on the information section is still unclear, some buttons sound ambiguous. More information (tutorial) is required. In addition, the question has not varied and currently available a question of classes 1 and 2 only. | The application is currently equipped with some information (tutorials) and some selection keys: the “space” button to start the game, the “S” button to open the scoring menu, the “H” button for information, and the “Esc” button to exit from game as shown in figure 2 no.1. In addition, the level of this application is more varied, not only for classes 1 and 2 but also for class 3 to class 6 of elementary school that is adapted to the curriculum. |
| Input text | This application is not equipped with backspace tones, so the user does not know which letters have been deleted. Also, in each question, the user does not get information related to what button information can be used. So that additional information for the user is not clear yet. | Figure 2 no.2 and no.3 show that the application is equipped with backspace tones so that when the user deletes the desired letter, it becomes easier to specify other letters that will be inputted. |
| Text Size | The text size is small and there is no option to continue to the next question or return to the previous question.
|
The applications are equipped with larger and clearer text sizes, also, the user can choose to proceed to the next question or return to the previous question. Then on each question page, as shown in figure no.4 and 5, the User knows the position of the letter being typed with information from the application. When the user enters the answer to each question, the application will guide the user to do the next step and some information to go ahead or exit the application. |
| Scoring | Information obtained by the user including the current generated value, the total time required, number of questions the user has done, and the number of letters incorrectly inputted by the user. | In the current application, as shown in figure no.6, it can display the scores by the user, the total time required, the number of incorrect letters entered by the user, and there are several selection information buttons, namely the “H” button for information and the “Esc” button for exit. |
- Explore the Questions
There are 13 participants included 9 elementary students and 4 teachers with visually impaired. First, the questionnaire included 10 item questions relating to the satisfaction, efficiency, and effectiveness using a Likert scale from 1 (strongly disagree) to 5 (strongly agree) was adopted from System Usability Scale (SUS) to understand usability assessment of user responses to this application.
Table 2: List of Questionnaires
| System usability scale | |
| 1. | I think that I would like to use this application frequently. |
| 2. | I found the application unnecessarily complex. |
| 3. | I thought the application was easy to use. |
| 4. | I think that I would need the support of a technical person to be able to use this application. |
| 5. | I found the various functions in this application were well integrated. |
| 6. | I thought there was too much inconsistency in this application. |
| 7. | I would imagine that most people would learn to use this application very quickly. |
| 8. | I found the application very cumbersome to use. |
| 9. | I felt very confident using the application. |
| 10 | I needed to learn a lot of things before I could get going with this application. |
The SUS questionnaire is shown in Table 2. Positive statements are displayed on odd items as the score is calculated from scale minus 1, while negative statements are displayed on even items as the score is calculated from 5 minus scale. As a result, the SUS score is generated from the total score of all items multiplied 2.5 so it ranges from 0 (completely disable) to 100 (completely usable).
- Choose the Evaluation and Data Collection Methods
The evaluation is a controlled setting involving users. Before doing testing, the user is given some brief guidance about this application, and then they should fulfill the questionnaire about the application.
- Identify the Practical Issues
As Russo et al. has stated that some practical issues must be considered when conducting an evaluation [17]. In this issue, the participants have chosen that represent for this application. For that purpose, the teachers, and students from the elementary school with disabilities have asked to participate in evaluating this application. When conducting the evaluation, the participants rely on the voices to fill out the questionnaires, while the questionnaire is given in the written form, so some volunteers read out each question which is then answered orally by the participants and recorded in writing by the volunteer.
- Decide How to Deal with the Ethical Issues.
The participants have been informed that the collected data during the evaluation and how it is used will be for this research.
- Evaluate, Analyze, Interpret, and Present the data
In this phase, evaluation has been done and analyzed on the profile of participants such as gender (female or male), age, role (teacher or student with grade), and type of disabilities (fully visual impaired or partial visual impaired). Besides, the experience of using a similar application also asked.
Also, according to Bangor et al. (2008) [19] and Lewis and Sauro [20] in their paper, the SUS questionnaire has two variables are usability (8 items) and learnability (2 items) as implemented in this study. Question numbers 1, 2, 3, 5, 7, and 9 are grouped to the usability variable while question numbers 4 and 10 are grouped to learnability variable. Based on the results of questionnaires, validity is tested by utilizing Pearson-Product Moment correlation while reliability is examined by adopting Cronbach’s Alpha method [21].
Subsequently, in the T-test, it can analyze the comparison of SUS score by gender, role, type of disabilities, and their experience of using a similar application. Meanwhile, an analysis of variance (ANOVA) is used to test the hypothesis of a comparison of two or more than two groups. This test has been used in research such as road damage classification [22], factors affecting behavioral intention [23], factors that determine consumer perceptions [24]. In this study, ANOVA is examined to make sure whether the application’s score affects the SUS score or not. Therefore, we can make conclusions according to the analysis test that has been carried out.
3. Results and Analysis
According to the data collected with the result in a response rate of 100 percent, as stated in figure 3 and figure 4, they are 7 out of 13 (54%) male participants and the rest (46%) are female participants aged as 69% are 6-11 years old, 8% are 25-34 years old, and 23% are 35-44 years old.
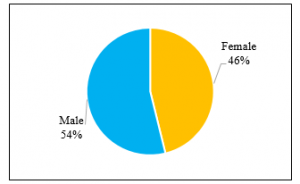
Figure 3: Percentage of Participants by Gender
Based on question 1 to 10, Table 3 shows the results of the SUS calculation. The method to calculate the results can be looked at in session 2. The SUS score has a level acceptable as produced by Bangor et al. (2008) [19]. SUS score below 50 is not acceptable while between 70 and 80 are acceptable although more than 90 are excellent. In this study, the average SUS is 75 of 100 means this system has 75% usable.
Cronbach’s Alpha [21] calculation is conducted to examine the reliability and validity of SUS. Hossain reported that reliability is acceptable when 0.6 ≤ α ≤ 0.7 [25]. This finding indicates that this SUS is reliable (α = 0.601).
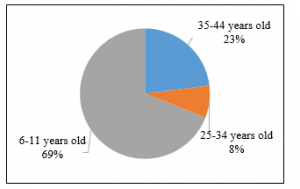
Figure 4: Percentage of Participants by Age
Table 3: SUS Score Results
| Participant | Q1 | Q2 | Q3 | Q4 | Q5 | Q6 | Q7 | Q8 | Q9 | Q 10 | SUS Score | Grade Score |
| 1 | 5 | 3 | 4 | 2 | 5 | 1 | 3 | 1 | 5 | 1 | 85 | 04 |
| 2 | 5 | 1 | 5 | 2 | 5 | 3 | 4 | 2 | 3 | 2 | 80 | 63 |
| 3 | 5 | 3 | 5 | 4 | 5 | 5 | 5 | 3 | 4 | 4 | 63 | 37 |
| 4 | 5 | 3 | 5 | 2 | 4 | 2 | 5 | 2 | 5 | 5 | 75 | 72 |
| 5 | 5 | 1 | 5 | 5 | 5 | 1 | 5 | 1 | 5 | 5 | 80 | 69 |
| 6 | 5 | 2 | 4 | 3 | 3 | 2 | 4 | 1 | 4 | 4 | 70 | 60 |
| 7 | 5 | 3 | 4 | 3 | 5 | 2 | 5 | 2 | 4 | 3 | 75 | 23 |
| 8 | 5 | 2 | 4 | 3 | 3 | 4 | 5 | 2 | 5 | 3 | 70 | 32 |
| 9 | 5 | 3 | 4 | 2 | 4 | 3 | 4 | 3 | 4 | 3 | 68 | 46 |
| 10 | 4 | 3 | 4 | 4 | 4 | 1 | 4 | 2 | 5 | 3 | 70 | 48 |
| 11 | 5 | 2 | 5 | 3 | 5 | 3 | 5 | 2 | 4 | 4 | 75 | 51 |
| 12 | 5 | 3 | 4 | 2 | 4 | 2 | 4 | 2 | 5 | 3 | 75 | 73 |
| 13 | 4 | 1 | 5 | 1 | 4 | 1 | 4 | 1 | 5 | 2 | 90 | 23 |
Table 4: Correlation on Usability and Learnability
| ALL | Usability | |
| Usability | 0.884 | 1 |
| Learnability | 0.771 | 0.383 |
Based on the Pearson-Product Moment correlation calculation, both variable usability (0.884) and variable learnability (0.771) are positively correlated toward the System Usability Scale, notwithstanding variable usability and variable learnability are not correlated (0.383) as shown in Table 4.
Moreover, 11 (85%) full visual impaired and 2 (15%) partial visual impaired with the distribution as stated in Figure 5.
According to the results in Table 5, the T-test is conducted to confirm our assumption that the Ha1: SUS score of participants with partial visually impaired differently from the SUS score of participants with totally loss vision, and 5% significant level. Table 4 described that P-Value 0.123 shows statistically that there is no difference between the SUS score of participants with partial visually impaired and the SUS score of participants with fully visually impaired.
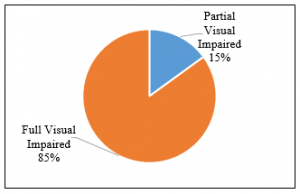
Figure 5: Percentage of Participants by Types of Visually Impaired.
Table 5: T-Test Results on SUS Score of Partial and Full Visual Impaired Participants
| Partial | Full | |||
| Mean | 82.5 | 73.727 | ||
| Variance | 12.5 | 50.018 | ||
| Observations | 2 | 11 | ||
| Pooled Variance | 46.6 | |||
| Hypothesized Mean Difference | 0 | |||
| df | 11 | |||
| t Stat | 1.672 | |||
| P(T<=t) one-tail | 0.061 | |||
| t Critical one-tail | 1.796 | |||
| P(T<=t) two-tail | 0.123 | |||
| t Critical two-tail | 2.201 | |||
Besides, a T-test was also conducted on gender to compare SUS score between male and female that Ha2: SUS Score of male participants is different from the SUS score of female participants.
Table 6 describes that there is no difference in SUS score by gender.
Table 6: T-Test Results on SUS Score by Gender
| Male | Female | |
| Mean | 75.429 | 74.667 |
| Variance | 52.952 | 64.667 |
| Observations | 7 | 6 |
| Pooled Variance | 58.277 | |
| Hypothesized Mean Difference | 0 | |
| df | 11 | |
| t Stat | 0.179 | |
| P(T<=t) one-tail | 0.430 | |
| t Critical one-tail | 1.796 | |
| P(T<=t) two-tail | 0.861 | |
| t Critical two-tail | 2.201 |
From 13 participants with disabilities, there were 4 (31%) teachers and 9 (69%) students as in Figure 6.
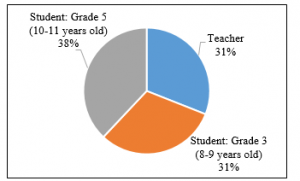
Figure 6: Percentage of Participants by Role
Table 7: T-Test Results on SUS Score by Role
| Student | Teacher | Grade 5 | Grade 3 | |
| Mean | 72.3 | 81.25 | 73.6 | 70.75 |
| Variance | 31.75 | 56.25 | 52.3 | 8.917 |
| Observations | 9 | 4 | 5 | 4 |
| Pooled Variance | 38.432 | 33.707 | ||
| Hypothesized Mean Difference | 0 | 0 | ||
| df | 11 | 7 | ||
| t Stat | -2.394 | 0.732 | ||
| P(T<=t) one-tail | 0.018 | 0.244 | ||
| t Critical one-tail | 1.796 | 1.895 | ||
| P(T<=t) two-tail | 0.036 | 0.488 | ||
| t Critical two-tail | 2.201 | 2.365 |
The T-test also performed comparing the SUS score between students and teachers that Ha3: SUS score of students is different from the SUS score of teachers and Ha4: SUS score on grade 5 is different from the SUS score on grade 3.
The results in table 7 show that there is a difference between the SUS score of students and the SUS score of teachers, but there is no difference between students of grade 3 and grade 5.
Some participants have used a similar application, therefore in this study, a comparison of the SUS score was carried out on participants who had a used similar application and not. The results can be seen in Table 8 that there is no difference in SUS scores between participants who have used a similar application and who have not.
Table 8: T-Test Results on SUS Score from Participants Used Similar Application and Not
| No | Yes | |
| Mean | 74.8 | 76 |
| Variance | 30.4 | 183 |
| Observations | 10 | 3 |
| Pooled Variance | 58.14545 | |
| Hypothesized Mean Difference | 0 | |
| df | 11 | |
| t Stat | -0.239 | |
| P(T<=t) one-tail | 0.408 | |
| t Critical one-tail | 1.796 | |
| P(T<=t) two-tail | 0.815 | |
| t Critical two-tail | 2.201 |
In addition, Moreover, after calculating the SUS Score with some T-test is completed, another hypothesis was developed with the assumption that Ha3: Grades do not affect SUS Score.
P-Value and significance F is more than 5% proved that the user’s grade does not significantly affect the SUS score as shown in Table 9.
Table 9: ANOVA and Partial (T) Results
| R Square | P-Value | F | Sig. F |
| 0.061 | 0.415 | 0.717 | 0.415 |
4. Conclusion
Based on the result, although the average grade is 46, the average SUS score is 75 of 100 shows that this application is 75% fulfill the usability of the application. This SUS is reliable with α = 0.601. Both variable usability (0.884) and variable learnability (0.771) are positively correlated toward the System Usability Scale, notwithstanding variable usability and variable learnability are not correlated (0.383).
After completed the T-test on the SUS score, it has concluded that no difference between the partial versus fully visually impaired participant, gender differences, and whether participants used similar applications. However, there is the difference between students’ SUS score with a mean of 72.3 and teachers’ SUS score with a mean of 81.3, even though there is no difference in the SUS score according to student’s grade. Also, grades do not affect the SUS score, so it proved that the collected SUS score as average 75 is an objective result from the users although the average grade is 46.
Therefore, some of the expectations from these results including the experience, knowledge, and skills of the users need to be evaluated in future research.
Acknowledgment
We thank Sekolah Luar Biasa Tuna Netra (SLB-A) Pembina Tingkat Nasional, and our participants for their help and contributions.
- W. ISO, “9241-11. Ergonomic requirements for office work with visual display terminals (VDTs).,” The International Organization for Standardization, 1998.
- Yanfi, Y. Udjaja, A.C. Sari, “A Gamification Interactive Typing for Primary School Visually Impaired Children in Indonesia,” in Procedia Computer Science, 2017, doi:10.1016/j.procs.2017.10.032.
- Y. Udjaja, “EKSPANPIXEL BLADSY STRANICA: Performance Efficiency Improvement of Making Front-End Website Using Computer Aided Software Engineering Tool,” Procedia Computer Science, 135, 292–301, 2018, doi:10.1016/j.procs.2018.08.177.
- Y. Udjaja, V.S. Guizot, N. Chandra, “Gamification for elementary mathematics learning in Indonesia,” International Journal of Electrical and Computer Engineering, 8(5), 3859–3865, 2018, doi:10.11591/ijece.v8i5.pp3859-3865.
- Y. Udjaja, “Gamification Assisted Language Learning for Japanese Language Using Expert Point Cloud Recognizer,” International Journal of Computer Games Technology, 2018, 2018, doi:10.1155/2018/9085179.
- D.P. Kristiadi, Y. Udjaja, B. Supangat, R.Y. Prameswara, H.L.H.S. Warnars, Y. Heryadi, W. Kusakunniran, “The effect of UI, UX and GX on video games,” in 2017 IEEE International Conference on Cybernetics and Computational Intelligence, CyberneticsCOM 2017 – Proceedings, 2018, doi:10.1109/CYBERNETICSCOM.2017.8311702.
- J.R. Lewis, “IBM Computer Usability Satisfaction Questionnaires: Psychometric Evaluation and Instructions for Use,” International Journal of Human-Computer Interaction, 1995, doi:10.1080/10447319509526110.
- Y. Udjaja, Sasmoko, Y. Indrianti, O.A. Rashwan, S.A. Widhoyoko, “Designing Website E-Learning Based on Integration of Technology Enhance Learning and Human Computer Interaction,” in 2018 2nd International Conference on Informatics and Computational Sciences, ICICoS 2018, 2019, doi:10.1109/ICICOS.2018.8621792.
- T.S. Tullis, J.N. Stetson, “A Comparison of Questionnaires for Assessing Website Usability ABSTRACT: Introduction,” Usability Professional Association Conference, 2004.
- J. Brooke, “SUS-A quick and dirty usability scale,” Usability Evaluation in Industry, 1996.
- S. Gabrielli, M. Dianti, R. Maimone, M. Betta, L. Filippi, M. Ghezzi, S. Forti, “Design of a Mobile App for Nutrition Education (TreC-LifeStyle) and Formative Evaluation With Families of Overweight Children,” JMIR MHealth and UHealth, 2017, doi:10.2196/mhealth.7080.
- A. Brock, P. Truillet, B. Oriola, D. Picard, C. Jouffrais, “Design and user satisfaction of interactive maps for visually impaired people,” in Lecture Notes in Computer Science (including subseries Lecture Notes in Artificial Intelligence and Lecture Notes in Bioinformatics), 2012, doi:10.1007/978-3-642-31534-3_80.
- N. Harrati, I. Bouchrika, A. Tari, A. Ladjailia, “Exploring user satisfaction for e-learning systems via usage-based metrics and system usability scale analysis,” Computers in Human Behavior, 2016, doi:10.1016/j.chb.2016.03.051.
- Unity Technologies, Game engine, tools and multiplatform, Unity Technologies, 2016.
- Y.R. Jenny Preece, Helen Sharp, “INTERACTION DESIGN: beyond human-computer interaction, 3rd Edition, Chapter 8: DATA ANALYSIS, INTERPRETATION, AND PRESENTATION. Publisher: John Wiley & Sons,” Interactive Computation: The New Paradigm, 2011, doi:10.1007/3-540-34874-3_10.
- J. Melton, “The lms moodle: A usability evaluation,” Prefectural University of Kumamoto Retrieved …, 2006.
- P. Russo, M.F. Costabile, R. Lanzilotti, C.J. Pettit, “Usability of planning support systems: An evaluation framework,” in Lecture Notes in Geoinformation and Cartography, 2015, doi:10.1007/978-3-319-18368-8_18.
- A. Zakiah, “Evaluation of interaction design of virtual laboratory of open source programming in virtual classroom based on moodle using decide framework case study: C programming,” International Journal of Psychosocial Rehabilitation, 2020, doi:10.37200/IJPR/V24I2/PR200708.
- A. Bangor, P.T. Kortum, J.T. Miller, “An empirical evaluation of the system usability scale,” International Journal of Human-Computer Interaction, 2008, doi:10.1080/10447310802205776.
- J.R. Lewis, J. Sauro, “The factor structure of the system usability scale,” in Lecture Notes in Computer Science (including subseries Lecture Notes in Artificial Intelligence and Lecture Notes in Bioinformatics), 2009, doi:10.1007/978-3-642-02806-9_12.
- L.J. Cronbach, “Coefficient alpha and the internal structure of tests,” Psychometrika, 1951, doi:10.1007/BF02310555.
- F.E. Gunawan, Yanfi, B. Soewito, “A vibratory-based method for road damage classification,” in 2015 International Seminar on Intelligent Technology and Its Applications, ISITIA 2015 – Proceeding, 2015, doi:10.1109/ISITIA.2015.7219943.
- Y. Yanfi, Y. Kurniawan, Y. Arifin, “Factors Affecting the Behavioral Intention of using Sedayuone Mobile Application,” ComTech: Computer, Mathematics and Engineering Applications, 8(3), 137, 2017, doi:10.21512/comtech.v8i3.3722.
- F.E. Gunawan, I. Sari, Y. Yanfi, “The consumer intention to use digital membership cards,” Journal of Business & Retail Management Research, 13(04), 117–124, 2019, doi:10.24052/jbrmr/v13is04/art-10.
- G. Hossain, “Rethinking self-reported measure in subjective evaluation of assistive technology,” Human-Centric Computing and Information Sciences, 2017, doi:10.1186/s13673-017-0104-7.