Using Big Data Analytics to Predict Learner Attrition based on First Year Marks at a South African University
Volume 5, Issue 5, Page No 920-926, 2020
Author’s Name: Gcobisile Matafenia), Ritesh Ajoodha
View Affiliations
School of Computer Science and Applied Mathematics. The University of the Witwatersrand, Johannesburg, 2050, South Africa
a)Author to whom correspondence should be addressed. E-mail: matafenigcobisile@gmail.com
Adv. Sci. Technol. Eng. Syst. J. 5(5), 920-926 (2020); ![]() DOI: 10.25046/aj0505112
DOI: 10.25046/aj0505112
Keywords: Expert system, predicting student success, statistical models, learner attrition

Export Citations
Due to high failure rates many students end up spending unnecessary years struggling to qualify and subsequently accumulate unnecessary debt. In this paper, our principal contribution is to provide an expert system that statistically predicts the success of a first year student in an undergraduate Science programme given only academic merit in their subject matter. Over the past decades, much work has been done in the field of predicting student success in first year computer science and in other first year courses. Historically, other authors focused on using linear statistical models to predict student success. These models had limitations as the prediction was designed for inference as compared to machine learning techniques. This paper presents an approach of using the naïve Bayes classifier, support vector machines and decision trees as models that can be used to predict the completion of an undergraduate science degree. This was done by firstly training the classifiers and then testing them. The support vector machine achieved the best accuracy (87%) in predicting the completion of a science degree based only on first year marks, this was followed by the naïve Bayes model (86.36%) and the decision tree (65.62%) came last.
Received: 17 August 2020, Accepted: 21 September 2020, Published Online: 12 October 2020
1. Introduction
The prevalence of high failure rates in South African universities results in students spending unnecessary years struggling to qualify and subsequently accumulate unnecessary debt. A view that is generally agreed upon is that acceptance into a university programme often proves to be life changing. The prospect of obtaining a degree is sometimes a promise of higher income and improves ones standard of living [1]. The idea of students having the ability to know after their first year of study which courses to take in order to maximize their chances of succeeding is helpful. Historically, institutions of higher learning have been struggling to improve their throughput rates over the years. Since the dawn of the democratic dispensation, enrolment rates in higher education institutions have sky rocketed while the dropout rates have increased significantly [2]. To mitigate drop-out rates and improve success, this paper will attempt to build a model for calculating the probability of a student completing an undergraduate degree at Wits University in order to promote early interventions focused on student success.
Some useful features to recognize the success of a student in first year computer science include using the Scholastic Aptitude Test (SAT) and the American College Testing (ACT) scores across different subjects [3, 4]. The approach in this paper will have the ability to calculate the alternative streamlines that might align a student with better options, so that they can reconsider their academic standing. In [3], the authors used statistical analysis in order to build a linear model that described the correlations using all linear combinations of the dependent variables. [5] made use of a step-wise discriminant analysis to identify all significant factors in a study group of 87 freshman computer science majors. The above papers demonstrate the methodologies that rely on using statistical models to perform the classification task. The purpose of this study is to explore the correlation between first year academic results and the probability of completing a Science degree at a South African university.
In this paper we trained the following three machine learning classification models: naïve Bayes classifiers, support vector machines, and decision trees to predict student attrition given their first year marks. The support vector machine achieved the best accuracy (87%) in predicting the completion of a science degree based only on first year marks, this was followed by the naïve Bayes model (86.36%) and the decision tree (65.62%) came last.
Our principal contribution from this paper, to stand along other contributions of this kind [6]–[8], is to provide a predictive model that statistically predicts the success of a first year student to complete their undergraduate Science degree given their first year marks. This will enable and promote early interventions to encourage student success.
This paper is structured as follows: section II reviews the related work; section III discusses the research methodology that was used to conduct the relevant experiments; section IV presents the qualitative results of the experiments and a discussion. Lastly, section v provides a summary of this paper, it also suggests some future work that can be explored.
2. Related Work
In [9], the authors attempt to deduce student attrition at a South African higher-education institution with the aim of identifying students who are likely to be in need of academic support so that a focus could be provided on improving their academic performance. The techniques used in the above paper are; Decision Trees, K-Star, naïve Bayes, Support Vector Machines, Random Forests, and Linear Logistic Regression. In [10], the authors attempt to provide a data-driven solution to the data-congested environment of attributes related to student success and contribute towards preventing the increased dropout rates at South African higher education institutions. The techniques used in the above paper are; Decision Trees, K-Star, naïve Bayes, Support Vector Machines, feed-forward neural networks, and linear regression models. In this research we are concerned with predicting the completion of an undergraduate science degree based only on first year marks. This research will be adapted from the work in the literature survey which focused on predicting student success in first year computer science by using marks from high school. This section provides the necessary background and related work that was used during the research project.
2.1. Predicting success at first year computer science
In this section, we look at different approaches that were used to predict the performance of first year students who majored in computer science. We first evaluate how multiple factors were used for this purpose, we then move into how mathematics as a single subject was used for prediction purposes. Lastly, we look at how English as another single subject was used for prediction purposes.
2.1.1 Predicting success using multiple factors
There are many approaches that can be used to look at what affects student performance in first year courses. One approach is to use multiple variables to compute the probability of succeeding in a freshmen major. In [3], 13 variables were used and these were independent to each other, these included the American College Testing (ACT) scores for mathematics, the American College Testing (ACT) scores for English, the American College Testing (ACT) scores for natural science and the student’s class rank to name a few. The American College Testing (ACT) are assessments that are used to measure the college readiness of high school students in America. The authors focused their study on a sample size of 269 students. For every variable; the mean, standard deviation, minimum and the maximum were calculated. Utilizing the correlations that were developed, a linear model was used to fit the data and the results indicated that it was possible to calculate the probability of a pass or a fail in an introductory computer science course. In [4], the authors used multiple factors to predict the performance in a computer science major and some of their work which focused on ACT English and other scores was extended in [3]. In [4], the authors consider the SAT scores, the sex of the student and their high school grades. By combining all of these, they developed a linear discriminant as a function to perform classification. In a data sample of 256 students, they were able to successfully classify 175 students which is 68.4% of the data into the correct group.
In [5], the author studied 10 factors and used these to find their relationship to student success in a first year computer science major. The ACT scores were used similarly to what [3] used in their variables. According to [5], the placement factors that reduced the failure rate in first year were the ACT English scores and the UTM mathematics placement scores, with the former scores being the best predictor. To identify the factors that contribute to the forecasting of success, a discriminate function was used. In [5], the author found that the other factors were not significant to be used as predictors. [4] found SAT mathematics and verbal scores as best predictors but did not indicate which one was the best predictor. In [11], the author builds a model that forecasts the success in a programming course, with the hope of counseling students to make informed decisions. On top of using past academic achievement as used in [3]–[5], the author includes certain cognitive skills and personality traits. The study focused on a sample size of 120 students that was randomly selected from a population of 600 students. The variables that were used in this paper are both independent and dependent, and they are 21 in total. This is significantly more variables in comparison to the number of variables that were used in other papers; [3]–[5]. The multiple regression equation that was developed was able to classify 61 students out of 79 (77.2%). The approach of using multiple factors to build a model for predicting the success of students worked in the papers mentioned above but there are other approaches. 2.1.2 Predicting success using Mathematics
In [12], the author uses the IBM Aptitude Test for Programmer Personnel (ATTP) scores to classify the students who are doing different computing courses, one based on COBOL and the other based on FORTRAN. The study focused on 46 students who had written the ATTPs. A positive correlation between the FORTRAN course and the arithmetical component of the ATTP was found, another correlation was found between the letter series and the COBOL course. The only factor that was used for forecasting the performance in an introductory computer course were the ATTP scores which is a different approach from using a combination of variables. In a paper that focuses on a commerce degree, the author [13] argues for the use of mathematics as a single variable rather than the matric aggregate to predict the performance in first year. The study focused on results that spanned a period of 4 years. The approach used was to take the individual mathematics scores and compare them to pass rates in first year. According to [13], a good mark in matric mathematics is the best predictor of first year success compared to the matric aggregate scores.
2.1.3 Predicting success using English
Similar to the approaches used in [12] and [13], in [14] the authors use a single factor to predict the success in first year computer science. The paper studies the correlation between success in English and the actual performance in first year. Analysis took place by use of qualitative data from a survey and an in-depth quantitative look at matric results. Results show that language scores from matric results are better predictors of success. In contrast, a recent publication by [13] argues about an important relationship between mathematics results in matric and the performance in a commerce degree. The argument is of great importance as it bases its findings on the same matric results as in [14]. Also, in [13] the author did not consider language in their study and according to [14] there is a possibility that it might have been a factor. As alluded to earlier, [4] states that it is inappropriate to only use a single matric subject as a predictor of success for a first year computer science major. A holistic approach is to use the matric aggregate as a predictor. It is worthy revisiting the findings of [5], the research found that amongst the several variables that were used in the study, the best single predictor for success were the ACT English scores. The overall best predictor for success in computer science was the combination of UTM mathematics and ACT English placement scores. The predictor that was developed in [5] was able to to successfully reduce the failure rate in computer science the following year from 28% to 18% as stated in [14].
3. Research Methodology
Predicting the success of a first year computer science student is affected by many variables as demonstrated in [3]. The background to the problem has been presented in the previous section and it also lays out the different approaches that have been used by other authors who focused on first year performance by using previous student grades. It must be noted that the previous authors who are surveyed in the literature had their focus on predicting success in first year computer science and other first year courses. This research will be taking this work further by trying to predict the completion of a science degree based only on first year marks. The naïve Bayes classifier, support vector machines and decision trees can be used to build classification models for this particular problem area as presented in section II. These classification models will use the first year marks as training data.
3.1. Data and Preprocessing
The study participants were learners who studied at a South African higher-education institution. The study ethics application has been approved by the Human Research Ethics Committee of the University (Non-Medical). The ethics application addresses key ethical issues of protecting the identity of the learners involved in the study and ensuring the security of data. The clearance certificate protocol number is H19/03/02. The dataset had a total of 216 features with 8557 observations. The features were selected according to their relevance in order to serve our aims and objectives. The data was received in a spreadsheet format and this had to be converted into a format that Weka can work with. Weka can work with comma separated values (csv) or attribute-relation format files (arff), the spreadsheet was converted into a csv file. The spreadsheet was read into an iPython notebook which uses Python and a package called pandas to work with stored data, this platform makes it easy to perform exploratory data analysis. The student numbers were anonymized in order to protect the students identity. The dataset contained students who did their year of study 1,year of study 2 and year of study 3 and in our case since we were working with year of study 1 so we dropped the other records (YOS2 and YOS3). After dropping the unnecessary rows, the rows that were left contained the subject and its mark for each student, say student x, the first 6 rows would be student x with the 6 subjects they did in first year with the corresponding marks and Progression Outcome Type. Since each student had more than one row identifying them we performed a transpose on the given table so that each record is one unique student with the columns having the subject matters and marks. The last column was the class label which was either a Yes or a No for the Progression Outcome Type. There was 216 features in total after the data was prepared correctly. The data was then saved onto a Weka readable format in order to run the supervised learning algorithms.
3.2. Classification Models
After the implementation of the classifiers the focus shifted to evolving the models in order to improve their accuracy. This was done by performing feature extraction and selection techniques. A 10-fold cross validation scheme was used.
3.2.1 Naïve Bayes
The naïve Bayes pre-defines a finite set of mutually exclusive classes and assumes that all of the features are conditionally independent given the class label of each instance [15], [16]
3.2.2 Support Vector Machine
SVMs are a type of supervised learning algorithm that can be applied to both regression and classification problems. In SVMs, the required hyperplanes and weights are learned during training, these have the required optimal plane and correctly chosen support vectors. The default kernel used by Weka is the RBF with gamma equal 1/k. [17], [18]
3.2.3 Decision Tree
The decision tree is based on the J48 algorithm that is also known as Iterative Dichotomiser 3, in this research this will construct a tree from top down using the ID3 algorithm. [19]
After performing the feature extraction techniques we chose one supervised learning algorithm in order to see if the accuracies were comparable to the generalized models. Training was done on the Correlation, Information Gain and Wrapper Evaluation attributes. The tailored degrees have their specified subjects so for each category the training was performed as well. After learning the parameters of the classifiers, these will be used to either confirm or reject the hypothesis through testing.
4. Experimental Results
In the previous section we discussed how the hypothesis of the research project would be tested and in this section we look at the performance of the machine learning techniques that were mentioned in section III. Firstly, we do simple plots of the data distribution in order to have a better picture of our data and then we evaluate the performance of the 3 main techniques. This evaluation occurs on the full dataset that has 216 features and the results will be subsequently recorded. We then perform feature extraction using the techniques that were also mentioned in section III, we use one of them (of the three algorithms) in order to observe if there’s any improvement on the model after feature extraction. The last batch of experiments involve training models for tailored degrees in the Faculty of Science, this is done due to the fact that in the initial models we generalized students in the Faculty. The tailored degrees fall under four categories which are; Physical Sciences, Mathematical Sciences, Biological and Life Sciences and the last one is Earth Sciences. The algorithms were ran on Weka (Waikato Environment for Knowledge Analysis) which is tool developed at the University of Waikato, New Zealand [20].
4.1. Graphs
The stacked plot in Figure 1 represents the distribution of the Progression Outcome Type, and this is referred to as the class label. The color blue represents students that have successfully completed their degrees in record time (3 years) and red represents the class of students that have not completed their degrees. The total number of unique students is 8557 for a period of 7 years.

Figure 1: Stacked plot of the distribution of Progress Outcome Type
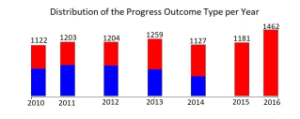
Figure 2: Stacked bar plot of the Progress Outcome Type per year
Figure 2 represents a stacked bar plot that compares the Progress Outcome Type for each year from 2010 until 2016. Blue represents students that have completed their degrees in record time and the color red represents students that have not completed their degrees.
The last two years, 2015 and 2016 have students that have not completed their degrees which is a strange phenomenon because we would expect that in every 3 year cycle there would be students that complete their degrees. Students that enrolled in 2014 should have completed their degrees in 2016, and the same applies to students that enrolled in 2013, these students should have completed their degrees in 2015. This strange observation in Figure 2 can be accounted to the second phase of the research methodology, we might have dropped students who completed their degrees in 2015 and 2016 by mistake. This might have been caused by the format in which we received the dataset.
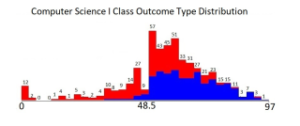
Figure 3: A plot that represents the distribution of Computer Science I marks
Figure 3, we have a stacked plot of the distribution of marks in Computer Science I. The plot resembles a normal distribution (Gaussian) which is what we expected for a set of marks for any given course. There are outliers in the Computer Science I marks and these are located at the far left in the plot.

Figure 4: A plot that represents the distribution of Mathematics I marks
Figure 4 illustrates a stacked plot of the distribution of marks in Mathematics I major. The plot resembles a normal distribution (Gaussian) more than the Figure 3, this is because we have more data points than before. There are also outliers to the far left of the stacked plot. Given that there is 216 possible courses that are features of the data, the same phenomenon of normally distributed marks can be generalized to these but we plot only 2 diagrams for the purpose of illustration.
Figure 5a represents the results of the 3 different machine learning algorithms that were used to test the hypothesis. The support vector machine outperformed the naïve Bayes and the decision tree. The results of the decision tree are the worst from the first two algorithms as an accuracy of 65.62% cannot be deemed as reasonable given that the support vector machine achieved an accuracy of 87%. Figure 5b, Figure 5c and Figure 5d represent the Confusion Matrices for the respective algorithms that are in Figure 5a. These tables describe the performance of each algorithm and this is another way of representing the accuracy of each algorithm.
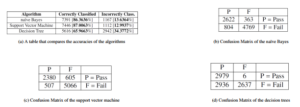
Figure 5: Tabulated results of the different algorithms
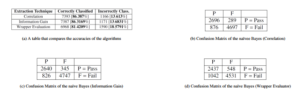
Figure 6: Tabulated results of the feature extraction techniques
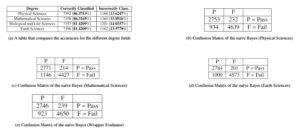
Figure 7: Tabulated results of the different degree fields
In Figure 8 we have a bar plot that compares the accuracy of the three algorithms. The legend of the plot indicates that the red color represents the category of the correctly classified instances and the cyan represents the incorrectly classified instances.
4.2. Results with Feature Extraction using Naïve Bayes
Figure 6a represents the results of the naïve Bayes classifier that was used on the 3 feature extraction techniques namely, correlation, information gain, and wrapper evaluation.
The Figure6b, 6c and 6d represent the Confusion Matrices for the respective algorithms that are in Table 6a.
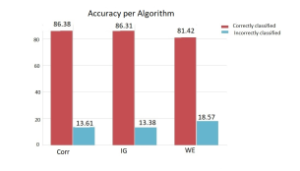
Figure 8: Bar plot
In Figure 8 we have a bar plot that compares the accuracy of the three feature extraction techniques.
4.3. Predicting the completion of a field specific Bachelor of Science degree based on first year marks
Figure 7a represents the results of the field specific degrees in the Faculty of Science. The naïve Bayes classifier was used for each of the 4 fields. The correctly classified instances for each of the fields have comparable accuracies and these are also comparable to the generalized case which uses the 216 features. Given that some students when they start their first year’s of study they pursue field specific degrees, the model was also tested for field specific degrees in order to see whether we could test our hypothesis for these cases.
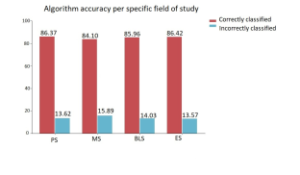
Figure 9: Bar Plot
In Figure 9 we have a bar plot that compares the accuracy of the the naïve Bayes when used on each of the four field specific degrees in the Faculty of Science. The graphical representation gives a better picture than Figure 7a and the Confusion Matrix tables. Here we are able to visually analyze the accuracy of each field specific degree when the naïve Bayes classifier is applied.
5. Conclusion
Our primary objective of this research was to build a model that can successfully predict the completion of a student’s Science degree based only on their first year marks. To achieve this, we first conducted research on different machine learning techniques, analyzed their advantages and limitations of each. According to the literature survey, we selected the naïve Bayes classifier, support vector machine and the decision tree. These have reasonable performances in theory that is why they were selected to be used in this research. Data preprocessing was used in order to package the data into the correct format and the feature extraction techniques were used in order to minimize the effect of over-fitting. Following a certain methodology, we conducted experiments on the selected models and on their variations. The methodology we performed can be easily extended to build other models that can be used for prediction purposes.
To evaluate the predictive performance of the models, this research applied a combination of features to the given models and their accuracies were determined. The computation time of each model is comparable except to the support vector machine that took some time do build. The experiment results show that our hypothesis is true and the support vector machine is considered as the most efficient model that produces results of reasonable accuracy. This was followed by the naïve Bayes and the decision tree had the worst performance. The naïve Bayes classifier was chosen purely on discretion when it was used for the feature extraction techniques and the field specific degrees. The support vector machine could have been chosen as well for this purpose as it had a comparable accuracy. The results of the feature extraction techniques and the field specific degrees were comparable to the general case.
A lot of factors were not taken into account when building the necessary models, i.e. the social circumstances of a particular student, whether a student is on financial aid, personal preferences and this affects the future work of the research. It can also be argued that the gender of the student might also affect the performance of a particular student, so this can improve future models.
It would be interesting to apply these models on a dataset with more variables that describe the learners academic trajectory. It would also be interesting to compare the predictive across models trained from various South African institutions in order to discover if the same features drive success and failure at difference institutions. Further work could explore optimising the hyper-parameters used in this study to optimise on accuracy. Deep neural networks or other probabilistic graphical models, such as Bayesian networks, could be used to provide better explanatory power of the influence that these features play in determining student success. These models do not make a lot of assumptions about our data and they can also be used to achieve the research objectives.
Conflict of Interest
The authors declare no conflict of interest.
Acknowledgement
This work is based on the research supported in part by the National Research Foundation of South Africa (Grant number: 121835).
- L. Thurow, “Education and economic equality,” in In The Public Interest, 66,
1972. - I. Scott, “A proposal for undergraduate curriculum reform in South Africa: The case for a flexible curriculum structure,” in In Council on Higher Education, 2013.
- D. Butcher, W. Muth, “Predicting success in an introductory computer science course,” in Communications of the ACM, 263–268, ACM, 1985.
- P. Campbell, G. G. McCabe, “Predicting the success of freshmen in a computer science major,” in Oxford: Clarendon, 1102–1113, 1984.
- E. Gathers, “Screening freshmen computer science majors,” in ACM SIGCSE Bulletin, 44–48, ACM, 1986.
- N. Ndou, R. Ajoodha, A. Jadhav, “A Case Study: Educational Data-mining to Determine Student Success at Higher Education Institutions,” in The Interna- tional Multidisciplinary Information Technology and Engineering Conference, 2020.
- N. Mngadi, R. Ajoodha, A. Jadhav, “A Conceptual Model to Identify Vulnerable Undergraduate Learners at Higher-Education Institutions,” in The International Multidisciplinary Information Technology and Engineering Conference, 2020.
- N. Philippou, R. Ajoodha, A. Jadhav, “Using Machine Learning Techniques and Matric Grades to Predict the Success of First Year University Students,” in The International Multidisciplinary Information Technology and Engineering Conference, 2020.
- R. Ajoodha, A. Jadhav, S. Dukhan, “Forecasting Learner Attrition for Student Success at a South African University,” in In Conference of the South African Institute of Computer Scientists and Information Technologists 2020 (SAICSIT ’20), September 14-16, 2020, Cape Town, South Africa. ACM, New York, NY, USA, 10 pages., ACM, 2020, doi:https://doi.org/10.1145/3410886.3410973.
- R. Ajoodha, S. Dukhan, A. Jadhav, “Data-driven Student Support for Aca- demic Success by Developing Student Skill Profiles,” in International Mul- tidisciplinary Information Technology and Engineering Conference. ISBN: 978-1-7281-9519-9., IEEE, 2020.
- T. Hostetler, “Predicting student success in an introductory programming course,” in ACM SIGCSE Bulletin, 40–43, 1983.
- C. Capstick, J. Gordon, A. Salvadori, “Predicting performance by university students in introductory computing courses,” in ACM SIGCSE Bulletin, 21–29, 1975.
- D. Tewari, “Is matric math a good predictor of student’s performance in the first year of university degree? A case study of faculty of management studies, University of Kwazulu-Natal, South Africa,” in In International Journal of Science Education, 233–237, 2014.
- S. Rauchus, B. Rosman, G. Konidaris, I. Sanders, “Language performance at high school and success in first year computer science,” in ACM SIGCSE Bulletin, 2927–2948, 2006.
- Z. Ghahrami, “An Introduction to Hidden Markov Models and Bayesian Net- works,” in Journal of Pattern Recognition and Artificial Intelligence, 9–15, 2001.
- D. Pham, G. Ruz, “Unsupervised training of bayesian networks for data clus- tering,” in In Proceedings of the Royal Society of London A: Mathematical, Physical and Engineering Sciences, 2927–2948, 2009.
- D. Isa, L. Lee, V. Kallimani, R. Rajkumar, “Text document preprocessing with the bayes formula for classification using the support vector machine,” in IEEE Transactions on Knowledge and Data engineering, 1265–1272, 2008.
- D. Boswell, “Introduction to Support Vector Machines,” Carlifonia Institute of Technology, 2002, doi:http://www.work.caltech.edu/~boswell/IntroToSVM. pdf.
- D. Isa, L. Lee, V. Kallimani, R. R. Rajkumar, “Decision Tree Learning,” in In Machine Learning, 52–57, 1997.
- R. Remco, E. Bouckaert, M. Frank, “Weka Manual,” in In Weka Manual for version 3.6.9, University of Waikato, New Zealand, 2008.
Citations by Dimensions
Citations by PlumX
Google Scholar
Scopus
Crossref Citations
No. of Downloads Per Month
No. of Downloads Per Country