Strain–Displacement Expressions and their Effect on the Deflection and Strength of Plate
Volume 5, Issue 5, Page No 401-413, 2020
Author’s Name: Onyeka Festus1,a), Edozie Thompson Okeke2,a), Wasiu John1
View Affiliations
1Department of Civil Engineering, Edo University, Iyamho, Edo State, 312102, Nigeria
2Department of Civil Engineering, University of Nigeria, Nsukka Enugu State, 410101, Nigeria.
a)Author to whom correspondence should be addressed. E-mail: edozie.okeke@unn.edu.ng, onyeka.festus@edouniverity.edu.ng
Adv. Sci. Technol. Eng. Syst. J. 5(5), 401-413 (2020); ![]() DOI: 10.25046/aj050551
DOI: 10.25046/aj050551
Keywords: CSCS and SCFS rectangular plate, Shear deformation theory, Strain-displacement expression, Variation calculus, Critical lateral imposed load

Export Citations
This paper studied the bending analysis of an isotropic rectangular plate for the effects of aspect ratio, shear and deflection on the critical lateral load of the plates using the polynomial shear deformation theory (PSDT). One of the plate is clamped at opposite edge clamped and the other opposite edge simply supported (CSCS). The other of the plate is simply supported at the first and fourth edge, clamped at second edge and free of support at the third edge (SCFS). Direct variational method of analysis was adopted using strain-displacement expressions to obtain the direct governing equations for the determination of the coefficient of deflection and shear deformation along the direction of x and y coordinate. From the established equation, a new model for determination of the critical lateral imposed load of the plate is developed. The study revealed that: (i) as the specified thickness of the plate increases, the value of critical lateral imposed load increase (ii) the critical lateral imposed load decrease as the plates span increases. Numerical comparison was conducted to verify and demonstrate the efficiency of the present theory. The result obtained are in good agreement with those in the literature.
Received: 10 August 2020, Accepted: 11 September 2020, Published Online: 21 September 2020
Introduction
Plates are widely used as the main structural components of the hull of ships, automobiles, gate dams, aircrafts, bridges, etc., because they possess interesting structural characteristics. For instance, when they are subjected to transverse loading (loading perpendicular to their fiber direction), they transit from their stable state of equilibrium to the unstable one. Such transition is normally referred to as bending or structural instability. During this transition, a critical point exists where an infinitesimal increase in load can cause the plate surface to bend.
The load at this critical point defines the bending and shear strength of the plate, or the critical load. Increase in load beyond the critical load leads to collapse [1].
Meanwhile, it is proven that when the critical load is lesser than the value of allowable load of the structure, the structure will remain on the straight or limited deflection. When the critical load exceeds the design load of the structure, it will be in deflecting position [1]. Therefore, there is need to determine the critical load.
Due to enormous application of plate and their relevant in engineering, various theories for plate analysis have been developed using linear strain-displacement expressions. It is proven from previous studies that results obtained using linear strain-displacement expressions may be unreliable for nonlinear stress and bending analyses [2, 3].
Isotropic plates refer to plates whose material properties in all directions at a point are same while anisotropic or orthotropic plates refer to plates whose material properties are direction dependent [4, 5]. They can also be classified according to their shapes as rectangular, circular, triangular, skew and elliptical plates. Isotropic thick plates are being widely used in structures subjected to uniformly distributed load, which produce a very large stresses on it [6, 7]. In order to describe the correct bending response of any type of plates, including shear deformation effects, refined theories are required.
In classical plate theory, it is assumed that line which is normal to the neutral surface before deformation remain straight and normal on the neutral surface after deformation. This assumption results in under-estimation of deflection [8-10].
First order shear deformation theory (FSDT) has been employed by many researchers to analyze thick plates. The theory, unlike the classical plate theory (CPT) took account of the shear deformation by introducing shear correction factor to satisfy the constitutive relations for transverse shear stresses and shear strains. The authors in [11], adopted FSDT in their work by employing a stress and displacement based approach respectively, which incorporates the effect of shear deformation. FSDT is discovered to have assumed transverse shear stress to be constant through the thickness of the plate, which violates the shear stress free surface conditions on the top and bottom surfaces of the plate [11-13]. The errors in deflection and stresses, the importance of the shear effect in plate bending was realized and the higher order theories were developed which take transverse stresses and strains into account. Higher order theories aim at improving the accuracy by incorporating transverse strains/stresses in the formulation without shear correction factor.
Results obtained in [6, 7, 14, 15] using the above theories [Exponential, hyperbolic and Trigonometric shear deformation function] often shows slight errors in predicting responses of the lateral load on the structures because tedious nature and not too sure of ones works using Fourier series to analyze thick plate. In this present work, the polynomial shear deformation function is used.
In the present paper, nonlinear strain–displacement expressions are employed for the analysis of rectangular plates subjected to uniform distributed loads to suggest a more reliable, refined plate theory that satisfies the continuity of all of the transverse stress components. This theory, which is based on traditional fourth-order shear deformation plate is presented and applied in a bending analysis of rectangular thick plates using the direct variational energy method. The investigation involves two case studies. One of the plate has an opposite edge clamped and the other opposite edge simply supported (CSCS). The other on the plate has simply supported at the first and fourth edge, clamped at second edge and free of support at the third edge (SCFS). Furthermore, derivation of three simultaneous governing equations for the plate and numerical solutions for deformations and stress distributions of different points of the plate with a uniformly distributed mechanical load for various boundary conditions is presented.
The aim of this study is to determine bending analysis of an isotropic rectangular plate for the effects of aspect ratio and deflection on the critical lateral load of the plates. The study sought to achieve the aim through the following objectives:
To formulate the potential energy of a thick rectangular plate in line with the work of author in [17].
To perform general variation of the total potential energy and obtain the solution of resulting three simultaneous governing equations.
To perform a direct variation of the total potential energy and obtain formulas to calculate coefficients of deflection and shear deformation rotation in both x and y axes.
To determine the values of stiffness coefficients (k) using polynomial displacement functions.
To obtain the in-plane and out of plane displacement and stresses of the rectangular thick plate.
To determine the critical lateral imposed load before deflection reaches the maximum specified limit 〖(q〗_iw) and its corresponding critical lateral imposed load before the plate reaches an elastic yield stress (q_ip).
Previous Works
The authors in [7], applied a new hyperbolic shear deformation theory for the bending and free vibration analysis of isotropic, functional graded laminated plate. Hamilton principle was applied using a Navier procedure to obtain the deflection and stresses in the rectangular plate.
In [10], the authors developed a mathematical model that is based on direct variation procedures and potential energy principle, and applied to thin rectangular Plates with two opposite edges clamped and other opposite edges simply supported and thin rectangular plates with one edge clamped and the three other sides simply supported. Their result clearly shows that the direct variational method circumvents the tedious and rigorous procedures involved in the classical and numerical methods.
In [12, 13], the authors used a first order shear deformation theory which was applied in the analysis of thick rectangular plates clamped at opposite edge clamped and the other opposite edge simply supported (CSCS). They determined the centroidal deflection of the plate. The authors in [11] unlike [12] improved by using a generalized Levy solution approach in the analysis of thick rectangular plates, clamped at opposite edge clamped and the other opposite edge simply supported (CSCS). Both did not take into account effect of transverse shear deformation.
In [15], the authors used a trigonometric shear deformation theory (TSDT) was for the analysis of isotropic plate, taking into account transverse shear deformation effect is presented. The theory which was built upon the classical plate theory uses the virtual work principle to determine the displacement and stress in a thick rectangular plate with four edges simply supported plate. They got the results of stresses for static flexural analysis of simply supported thick isotropic plates for uniformly distributed load.
The authors in [16], used polynomial shear deformation theory (PSDT) for the analysis of rectangular plates. Their theory incorporates the effect of transverse shear stress and shear deformation in the analysis. Results obtained using the theories did not introduce much error and easier to apply in the analysis, but it ended up determining the displacements, moments and stresses that may occur due to the applied load without obtaining the critical lateral load in predicting responses of the applied load which can lead to failure on the structures.
The authors in [17, 18] have used PSDT for the analysis of rectangular plates. They obtained the expression for critical lateral load in predicting responses of the applied load determined to solve bending problem of rectangular plates with all four edges clamped (CCCC) and plate with free of support at third edge and the other edges clamped (CCFC) using third order shear deformation theory for rectangular thick plate respectively. They [17] did not check the effect of shear stress and [18] did not solve for order boundary condition.
Apart from the distinctiveness of the present study with respective individual previous works, there exists an aspect of distinctiveness of the present study over the previous works put together. This lies in exponential functions, hyperbolic functions, trigonometric and polynomial displacement function. The present work unlike the previous works which assumed the displacement function, perform general variation of the total potential energy in order to get a close form (exact) polynomial displacement function from first principle. They also went ahead to determine the critical lateral impose load used in predicting the flexural characteristics for an isotropic rectangular CSCS and SCFS plate, a feat previous work did not achieve.
Methodology
Assumptions
Considering the following assumptions, the total potential energy of a thick rectangular plate will be formulated. They includes:
The material of the plate is homogeneous and isotropic.
The plate material is elastic and obeys Hooke’s law.
The deflection (w) is less than one-fifth of the thickness.
The stress normal to x-y plane is so small that it can be neglected. That is to say those, the in-plane displacements, u and v are differentiable in x, y and z coordinates, while the out-of-plane displacement (deflection), w is only differentiable in x and y coordinates.
The effect of the out-of-plane normal stress on the gross response of the plate is small when compared with other stresses.
The vertical line that is initially normal to the middle surface of the plate before bending is no longer straight nor normal to the middle surface after bending.
Kinematics and Constitutive Relations
The kinematics in the structural mechanics sense mean the relationship between the engineering strains and displacement. The three displacements of thick place assumed to involve the deflection, w(x,y) and the two inplane displacements, u(x,y,z), and v(x,y,z) was used to establish the constitutive equations of the rectangular plate. The values of deflection (w), inplane displacement along x and y axis (u and v) as was gotten from the assumption made in the previous section as:
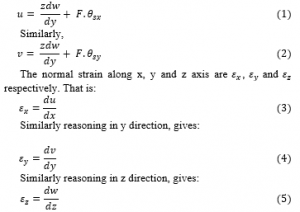
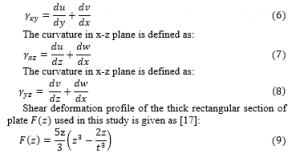
The curvature in x-z plane is defined as:
Where;
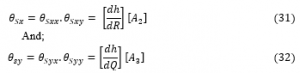
〖θ_Sx and θ〗_Sy=shear deformation rotation along x and y axis.
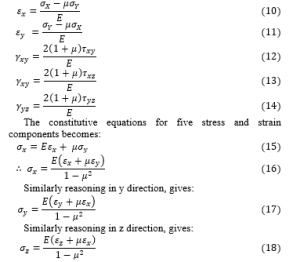
The constitutive equations for five stress and strain components are:
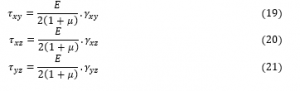
Rearranging equation 12, 13 and 14, the shear stress along (x-y), (x-z) and (y-z) respectively becomes:
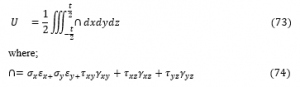
Total Potential Energy
The total potential energy functional (Π) of thick rectangular isotropic plate were derived [19] from the constitutive relations and presented as;
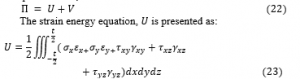
Substituting appropriately, gave:

By substituting Equation 24 and 25 into 22, gives:
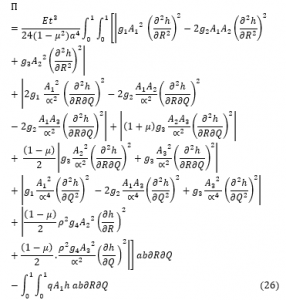
Where; breathe aspect
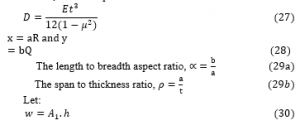
Where:
h is the plate shape function.
w, θ_Sx,and θ_Sy are the deflection , shear deformation along x axis and shear deformation along y axis respectively while,
A_1, A_2 and A_3 are the coefficient of the deflection , shear deformation along x axis and shear deformation along y axis respectively.
Governing Energy Equation
The elastic plate presented plate in Figure 1 and 2 under bending subjected to uniformly distributed load was used to obtain the displacement – strain relationships in terms of curvatures.
3.4.1. General Governing Equation
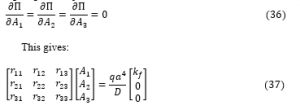
The total potential energy shall be minimized with respect to the deflection w, shear deformation along x axis, θ_Sx and shear deformation along y axis, θ_Sy. Minimizing or differentiating total potential energy equation with respect to w,θ_Sx,and θ_Sy is said to be the direct variation.
![]()
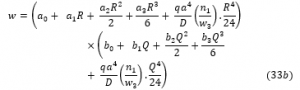
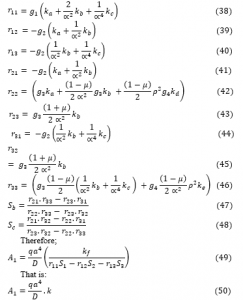
By solving the resulting three simultaneous governing equation the actual deflection w, shear deformation along x axis, θ_Sx and shear deformation along y axis, θ_Sy was gotten as:
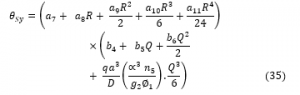
The general polynomial shear deformation function (Rotation equation for y-axis) of a rectangular plate as was obtained and presented:
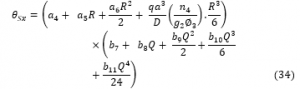
The general polynomial shear deformation function (Rotation equation for y-axis) of a rectangular plate as was obtained and presented:
The following type of plate with their respective support conditions are in consideration.
The following type of plate with their respective support conditions are in consideration.
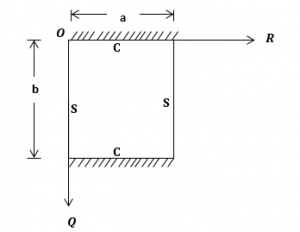
Figure 1: CSCS Rectangular Plate
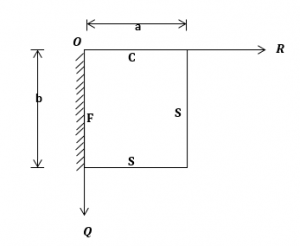
Figure 2: SCFS Rectangular Plate.
3.4.2. Direct Governing Equation
The total potential energy shall be minimized with respect to the coefficient of the deflection A_1, shear deformation along x axis A_2 and shear deformation along y axis A_3. Minimizing or differentiating total potential energy equation with respect to A_1, A_2 ,and A_3 is said to be the direct variation.
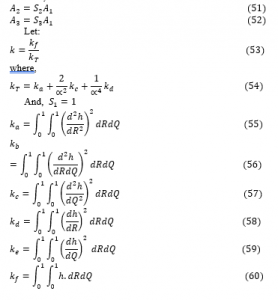
Let:
Also;
Displacement and stress analysis
By incorporating the established expression for deflection and shear deformation coefficients the deflection, and the two inplane displacement and stresses of the plate is presented as:

Where;
z=st
Formulation of Expression for the Critical Imposed Load Before Deflection Reaches Specified Maximum Limit, 〖q 〗_iw
The maximum critical lateral load on the plate before its deflection reaches allowable value will be determined [17]. This is to ensure that deflection does not exceed specified maximum limit.
Therefore:

where;
γ=Self weight of the plate
and,
〖q 〗_iw=Critical Imposed load of the plate
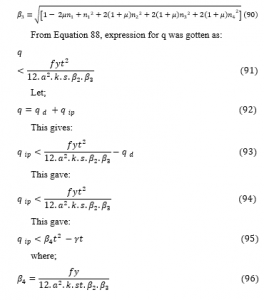
Where;
i=specific thickness
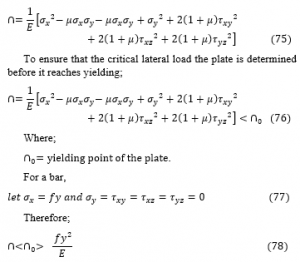
3.7. Formulation of Expression for the Critical Load before Plate Reaches Elastic Yield Stress, 〖q 〗_ip
The critical lateral imposed load on the plate before it reaches yielding point is determined [18], to ensure that the stress due to the applied stress on the plate does not exceed elastic yield point.
Recall that;
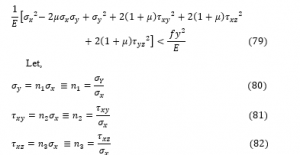
Substituting values of ε_x,ε_(y ),γ_(xy,) 〖 γ〗_xy,〖and γ〗_yz 10 to 14 into Equation 74 gives:
Substituting Equation 76 into 78 gives:
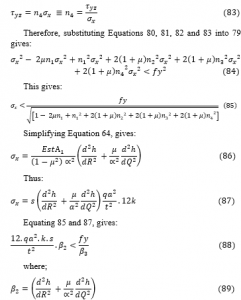
and,
〖q 〗_ip=critical imposed lateral load before plate reach yield stress;fy=strength
i=specific thickness
〖q 〗_d=Self weight of the plate
Results and Discussions
Results
The numerical analysis of CSCS and SCFS rectangular plate at various span-thickness ratios are presented in Figure 2 to 10 and Figure 11 to 19 respectively.
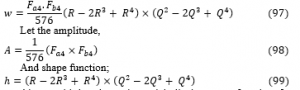
A fourth order polynomial displacement function for the analysis CSCS plate was derived as presented in Equation 97:
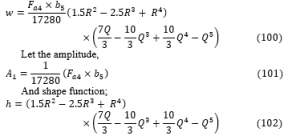
Also, a third order polynomial displacement function for SCFS plate was derived for the analysis as presented in Equation 100:
The values stiffness coefficient obtained from the above expression is presented in Table 1. Table 3 presents the result of the comparison made with previous work [11, 12 and 20] for non-dimensional center deflection multiplied by D/qa^4 of CSCS square rectangular thick plate at various aspect ratios while Table 4 presents the corresponding percentage difference between the values of centroidal deflection.
Figure 3 contains a graph of the critical lateral imposed load versus length to breadth aspect ratio of CSCS plate for a span (a) of 1000mm at allowable deflection, (w_a ) of 1.0mm. A length to breadth aspect ratio of 1.0 through 2.0 was used at an interval of 0.1 with a specified thickness (i) of 5mm, 10mm and 15mm. Figure 4 contains a graph of the critical lateral imposed load versus length to breadth aspect ratio of CSCS plate for a span (a) of 1000mm at allowable deflection, (w_a ) of 3.0mm. A length to breadth aspect ratio of 1.0 through 2.0 was used at an interval of 0.1 with a specified thickness (i) of 5mm, 10mm and 15mm. Figure 5 contains a graph of the critical lateral imposed load versus length to breadth aspect ratio of CSCS plate for a span (a) of 1000mm at allowable deflection, (w_a ) of 5.0mm. A length to breadth aspect ratio of 1.0 through 2.0 was used at an interval of 0.1 with a specified thickness (i) of 5mm, 10mm and 15mm. Figure 6 contains a graph of the critical lateral imposed load versus length to breadth aspect ratio of CSCS plate for a span (a) of 3000mm at allowable deflection, (w_a ) of 1.0mm. A length to breadth aspect ratio of 1.0 through 2.0 was used at an interval of 0.1 with a specified thickness (i) of 5mm, 10mm and 15mm. Figure 7 contains a graph of the critical lateral imposed load versus length to breadth aspect ratio of CSCS plate for a span (a) of 3000mm at allowable deflection, (w_a ) of 3.0mm. A length to breadth aspect ratio of 1.0 through 2.0 was used at an interval of 0.1 with a specified thickness (i) of 5mm, 10mm and 15mm. Figure 8 contains a graph of the critical lateral imposed load versus length to breadth aspect ratio of CSCS plate for a span (a) of 3000mm at allowable deflection, (w_a ) of 3.0mm. A length to breadth aspect ratio of 1.0 through 2.0 was used at an interval of 0.1 with a specified thickness (i) of 5mm, 10mm and 15mm. Figure 9 contains a graph of the critical lateral imposed load versus length to breadth aspect ratio of CSCS plate for a span (a) of 5000mm at allowable deflection, (w_a ) of 1.0mm. A length to breadth aspect ratio of 1.0 through 2.0 was used at an interval of 0.1 with a specified thickness (i) of 5mm, 10mm and 15mm. Figure 10 contains a graph of the critical lateral imposed load versus length to breadth aspect ratio of CSCS plate for a span (a) of 5000mm at allowable deflection, (w_a ) of 3.0mm. A length to breadth aspect ratio of 1.0 through 2.0 was used at an interval of 0.1 with a specified thickness (i) of 5mm, 10mm and 15mm. Figure 11 contains a graph of the critical lateral imposed load versus length to breadth aspect ratio of CSCS plate for a span (a) of 5000mm at allowable deflection, (w_a ) of 5.0mm. A length to breadth aspect ratio of 1.0 through 2.0 was used at an interval of 0.1 with a specified thickness (i) of 5mm, 10mm and 15mm. Figure 12 depicts a graph of the critical lateral imposed load versus length to breadth aspect ratio of SCFS plate for a span (a) of 1000mm at allowable deflection, (w_a ) of 1.0mm. A length to breadth aspect ratio of 1.0 through 2.0 was used at an interval of 0.1 with a specified thickness (i) of 5mm, 10mm and 15mm. Figure 13 depicts a graph of the critical lateral imposed load versus length to breadth aspect ratio of SCFS plate for a span (a) of 1000mm at allowable deflection, (w_a ) of 3.0mm. A length to breadth aspect ratio of 1.0 through 2.0 was used at an interval of 0.1 with a specified thickness (i) of 5mm, 10mm and 15mm. Figure 14 depicts a graph of the critical lateral imposed load versus length to breadth aspect ratio of SCFS plate for a span (a) of 1000mm at allowable deflection, (w_a ) of 5.0mm. A length to breadth aspect ratio of 1.0 through 2.0 was used at an interval of 0.1 with a specified thickness (i) of 5mm, 10mm and 15mm. Figure 15 depicts a graph of the critical lateral imposed load versus length to breadth aspect ratio of SCFS plate for a span (a) of 3000mm at allowable deflection, (w_a ) of 1.0mm. A length to breadth aspect ratio of 1.0 through 2.0 was used at an interval of 0.1 with a specified thickness (i) of 5mm, 10mm and 15mm. Figure 16 depicts a graph of the critical lateral imposed load versus length to breadth aspect ratio of SCFS plate for a span (a) of 3000mm at allowable deflection, (w_a ) of 3.0mm. A length to breadth aspect ratio of 1.0 through 2.0 was used at an interval of 0.1 with a specified thickness (i) of 5mm, 10mm and 15mm. Figure 17 depicts a graph of the critical lateral imposed load versus length to breadth aspect ratio of SCFS plate for a span (a) of 3000mm at allowable deflection, (w_a ) of 5.0mm. A length to breadth aspect ratio of 1.0 through 2.0 was used at an interval of 0.1 with a specified thickness (i) of 5mm, 10mm and 15mm. Figure 18 depicts a graph of the critical lateral imposed load versus length to breadth aspect ratio of SCFS plate for a span (a) of 5000mm at allowable deflection, (w_a ) of 1.0mm. A length to breadth aspect ratio of 1.0 through 2.0 was used at an interval of 0.1 with a specified thickness (i) of 5mm, 10mm and 15mm. Figure 19 depicts a graph of the critical lateral imposed load versus length to breadth aspect ratio of SCFS plate for a span (a) of 5000mm at allowable deflection, (w_a ) of 3.0mm. A length to breadth aspect ratio of 1.0 through 2.0 was used at an interval of 0.1 with a specified thickness (i) of 5mm, 10mm and 15mm. Figure 20 depicts a graph of the critical lateral imposed load versus length to breadth aspect ratio of SCFS plate for a span (a) of 5000mm at allowable deflection, (w_a ) of 5.0mm. A length to breadth aspect ratio of 1.0 through 2.0 was used at an interval of 0.1 with a specified thickness (i) of 5mm, 10mm and 15mm. Figure 21 is a curve that showed the comparison made with previous work [20] for non-dimensional center deflection of SCFS rectangular thick plate at 1.5 length to width ratios.
Discussion
It is seen from the Figure 3 to 20 that as the specified thickness (t) of plate increases, the value of critical lateral imposed load (q_iw and q_ip) increases. This implies that increase in the thickness of the plate ensures safety in the plate structure.
More so, from the tables that as the specified deflection (w_a) increases, the value of critical lateral imposed load (q_iw), while the critical imposed load (q_ip) remains constant. This implies that increase in the allowable deflection value required for the analysis of the plate reduces the chances of failure of structural member. Meanwhile, this does not affect critical imposed load (q_ip ).
From the results of CSCS plate presented in Figure 3 to 11, it shows that the values of critical lateral imposed load q_iw and q_ip decrease as the length-width ratio increases, this continues until failure occurs. This means that an increase in plate length increases the chance of failure in a plate structure.
Figure 3 to 11 presents the result of CSCS plate with span of 1000mm, 3000mm and 5000mm at allowable deflection of 1mm, 3mm and 5mm at 5mm, 10mm and 15mm specified thickness. From the result, the value of 〖 q〗_iw and q_ip is between -0.3846 N/mm to 154.288 N/mm and -0.0120 N/mm to 193.825 N/mm been the highest and lowest value at respectively. From that table it is observed that the value of q_ip if greater than that of q_iw, this is because the failure of plate in q_ip means total failure but that of q_iw is like a warning requesting maintenance.
Looking closely at Figure 3 to 5 (CSCS plate with span of 1000mm at allowable deflection (w_a) value between 1mm to 5mm). It finds that failure on q_iw only occur at between length to width ratio of 1.6, 1.8, 1.9 and 2 with a value of -0. 0183N/mm, -0. 0556N/mm, -0. 0847N/mm, -0.1078 and -0. 1264N/mm in thickness of 5mm with value.
Looking closely at Tables 6 to 11 (CSCS plate with span between 1000mm and 5000mm at allowable deflection (w_a) value between 1mm to 5mm). It finds that failure on q_iw only occurs at all length to width ratio (1 to 2) between value of -1.1215N/mm and -0.0036N/mm at all thickness. The negative value of critical lateral imposed load q_iw (and positive value of q_ip) only reveals that the plate fails in〖 q〗_iw for the entire plate w_a (1mm to 5mm) and span of 1000mm to 5000mm. This means that the plate structure is not safe and required maintenance.
Meanwhile, from Figure 9 to 11, it is observed that total failure occurs at length to breadth ratio of 2 with specified thickness of 5mm at value of -0.3846N/mm and -0. 012N/mm for 〖 q〗_iw and q_ip respectively. This means that the failure cannot be maintained.
From the results of SCFS plate presented in Figure 12 to 20, it shows that the values of critical lateral imposed load q_iw decrease as the length-width ratio increases, this continues until failure occurs. This means that an increase in plate length increases the chance of failure in a plate structure. Meanwhile the values of critical lateral imposed load q_ip increase as the length-width ratio increases, this continues until safety is ensured.
Figure 12 to 20 presents the result of SCFS plate with span of 1000mm, 3000mm and 5000mm at allowable deflection of 1mm, 3mm and 5mm at 5mm, 10mm and 15mm specified thickness. From the result, the value of 〖 q〗_iw and q_ip is between -1.1331N/mm to 80.0504N/mm and 0.1328N/mm to 183.365N/mm been the highest and lowest value at respectively. From that tables it is observed that the value of q_ip if greater than that of q_iw, this is because the failure of plate in q_ip means total failure but that of q_iw is like a warning requesting maintenance.
Looking closely at Figure 15 to 20 (SCFS plate with span between 1000mm and 5000mm at allowable deflection (w_a) value between 1mm to 5mm). It is seen that failure on q_iw only occurs at all length to width ratio (1 to 2) between value of -1.1331N/mm and -0.1525N/mm at all thickness. The negative value of critical lateral imposed load q_iw (and positive value of q_ip) only reveals that the plate fails in〖 q〗_iw for the entire plate w_a (1mm to 5mm) and span of 1000mm to 5000mm. This means that the plate structure is not safe and required maintenance.
The positive value of critical lateral imposed load q_iw and q_ip for other types of plate reveals that the plate neither fail in〖 q〗_iw nor in q_ip for plate all span at allowable deflection, w_a of 1000mm to 5000mm for the two boundary conditions into consideration. This means that the plate structure is safe.
However, the value of stiffness coefficient is higher with the structure with free support than that with simple support and clamped. Consequently, the value of q_iw and q_ip are higher in the CSCS plate than SCFS plate, this shows that the capacity of the plate to resist bending is higher in the SCFS plate than that of CSCS plate.
The result from comparison made in Table 2, 3 and Figure 3, shows that the average percentage difference between the present study and that of [12] and [13] is 9.2% and 16.6% the difference is higher than that of [20] because the latter is a higher shear deformation theory whose value is closer to the exact as it did not require a shear correction factor for the analysis. Meanwhile, the result of the three equally validates these polynomial displacement functions for rectangular plate’s analysis. Though the disparity between the values in bending is obvious. It does not invalidate the results, since the values of the present solution are upper bound results, which will not put the structure being designed in danger. Hence, the approximating function according to polynomial function can be used reliably for analysis of a plate with all edges clamped and simply supported at opposite edge. They present good interpretations of the two results. From Table 3 and Figure 3, it can be seen that the results obtained in this work agree very well with those from the previous work [12, 13 and 20]. The disparity between the three values or total average percentage difference of 10.6% is very negligible. Hence, the approximating function according to the polynomial function can be used with confidence for analysis of deflection on a plate with such configurations.
Conclusion
A displacement based, refined shear deformation theory includes the effects of transverse shear deformations. The constitutive relations are satisfied in respect of in-plane stress and transverse shear stress. The theory obviates the need of a shear correction factor. The governing differential equations and associated boundary conditions obtained are variationally consistent and can be used with confidence in the analysis of isotropic rectangular.
Furthermore, it can be concluded that the values of critical lateral load obtained by this theory achieve accepted vertical shear stress to the thickness of plate variation and satisfied the transverse flexibility of condition at the top and bottom faces of the plate while predicting the flexural characteristics for an isotropic rectangular CSCS and SCFS plate. The deflection and stresses obtained by present theory are in good agreement with the other order theories. This validates the efficacy and credibility of the present polynomial shear deformation theory.
Hence, the effect of deflection and crack in a mild steel rectangular plate can be managed in the analysis and design of structures. This approach overcomes the challenges of the conventional practice in the structural analysis/design which involves checking of deflection and shear; the process which is proved unreliable.
Recommendation of Future Scope of Studies
This lies in the establishment of higher order orthogonal polynomial shear deformation/displacement function for free vibration and buckling analysis of rectangular or circular thick plate. Then determining the critical buckling load parameters for the plate using virtual work principles.
Table 1: Values of Stiffness Coefficient, k for Various Support (boundary conditions)
| Type | Plate | k1 | k2 | k3 | k4 | k5 | k6 |
| 1 | cscs | 0.007 | 0.009 | 0.039 | 0.008 | 0.009 | 0.007 |
| 2 | scfs | 1.509 | 0.182 | 0.028 | 0.072 | 0.016 | 0.062 |
Table 2: Percentage difference between the values of centroidal deflection from present and past studies
| Present | [11] | [12] | [20] | |
| 5 | 0.0024 | 17.447 | 28.511 | 13.3448 |
| 10 | 0.0021 | 0.9479 | 4.7393 | 3.7168 |
| 20 | 0.0020 | – | – | 1.0830 |
| Average % Difference | 9.20 | 16.63 | 6.05 | |
| Total % Difference | 10.62 | |||
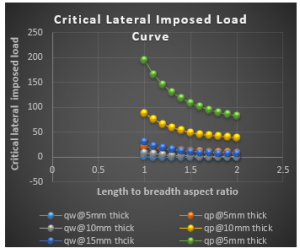
Figure 3: Graph of critical lateral imposed load versus length to breadth ratio of CSCS plate for span, a = 1000mm at w_a= 1.0mm
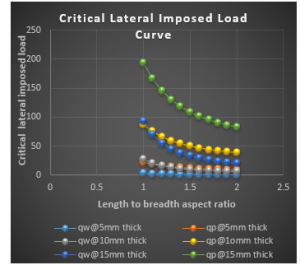
Figure 4: Graph of critical lateral imposed load versus length to breadth ratio of CSCS plate for span, a = 1000mm at w_a= 3.0mm
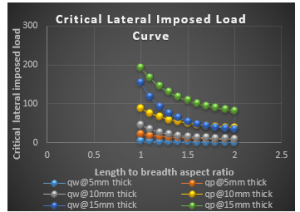
Figure 5 Graph of critical lateral imposed load versus length to breadth ratio of CSCS plate for span, a = 1000mm at w_a= 5.0mm

Figure 6: Graph of critical lateral imposed load versus length to breadth ratio of CSCS plate for span, a = 3000mm at w_a= 1.0mm
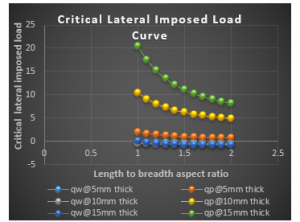
Figure 7: Graph of critical lateral imposed load versus length to breadth ratio of CSCS plate for span, a = 3000mm at w_a= 3.0mm
Table 3: Comparison of values of non-dimensional center deflection multiplied by D/qa^4 of CSCS square and 1.5 aspect ratio rectangular thick plate obtained herein with those from [12], [13] and [20] respectively.
| Present
( |
[12] | [13] | Present | [20] | |
| 5 | 0.0024 | 0.0028 | 0.0030 | 0.0061 | 0.0069 |
| 10 | 0.0021 | 0.0021 | 0.0022 | 0.0057 | 0.0059 |
| 20 | 0.0020 | – | – | 0.0055 | 0.0056 |
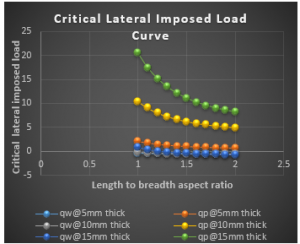
Figure 8: Graph of critical lateral imposed load versus length to breadth ratio of CSCS plate for span, a = 3000mm at w_a= 5.0mm
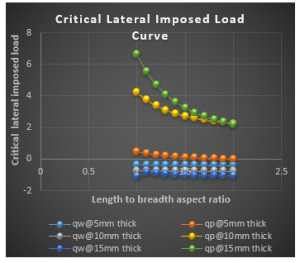
Figure 9: Graph of critical lateral imposed load versus length to breadth ratio of CSCS plate for span, a = 5000mm at w_a= 1.0mm
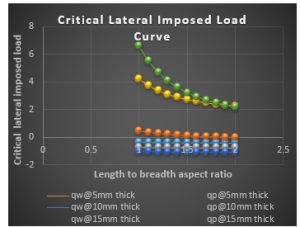
Figure 10: Graph of critical lateral imposed load versus length to breadth ratio of CSCS plate for span, a = 5000mm at w_a= 3.0mm
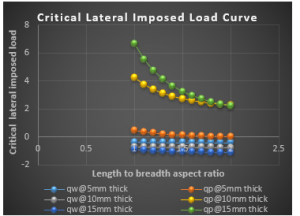
Figure 11: Graph of critical lateral imposed load versus length to breadth ratio of CSCS plate for span, a = 5000mm at w_a= 5.0mm
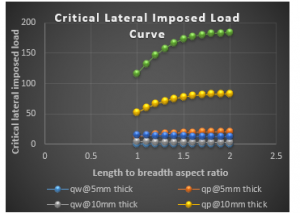
Figure 12: Graph of critical lateral imposed load versus length to breadth ratio of SCFS plate for span, a = 1000mm at w_a= 1.0mm
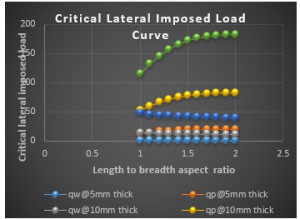
Figure 13: Graph of critical lateral imposed load versus length to breadth ratio of SCFS plate for span, a = 1000mm at w_a= 3.0mm
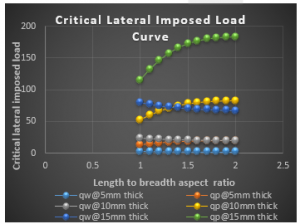
Figure 14: Graph of critical lateral imposed load versus length to breadth ratio of SCFS plate for span, a = 1000mm at w_a= 5.0mm
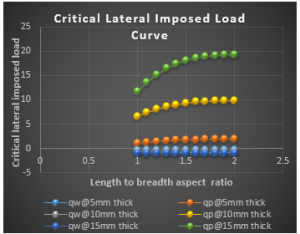
Figure 15: Graph of critical lateral imposed load versus length to breadth ratio of SCFS plate for span, a = 3000mm at w_a= 1.0mm
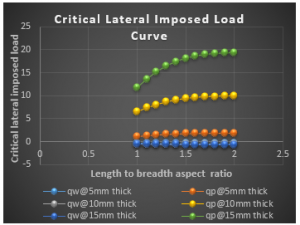
Figure 16: Graph of critical lateral imposed load versus length to breadth ratio of SCFS plate for span, a = 3000mm at w_a= 3.0mm

Figure 17: Graph of critical lateral imposed load versus length to breadth ratio of SCFS plate for span, a = 3000mm at w_a= 5.0mm
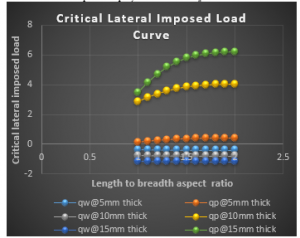
Figure 18: Graph of critical lateral imposed load versus length to breadth ratio of SCFS plate for span, a = 5000mm at w_a= 1.0mm
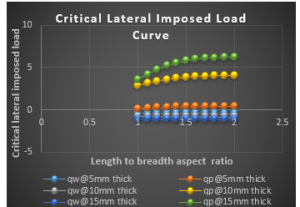
Figure 19: Graph of critical lateral imposed load versus length to breadth ratio of SCFS plate for span, a = 5000mm at w_a= 3.0mm
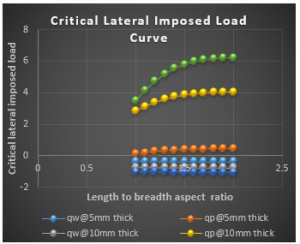
Figure 20: Graph of critical lateral imposed load versus length to breadth ratio of SCFS plate for span, a = 5000mm at w_a=5.0mm
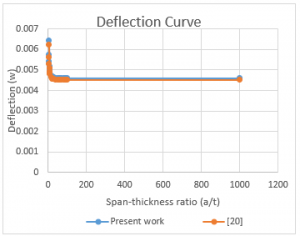
Figure 21: Comparison of values deflection of SCFS rectangular thick plate with 1.5 span-thickness ratio obtained herein with those from [20]
Conflict of Interest Statement
On behalf of all authors, I Okeke Thompson Edozie the corresponding author hereby state that there is no conflict of interest.
- Bert Louis Smith, “Critical load for a rectangular plate simply supported on three edges, built in on the fourth edge, and compressed on two opposite-simply supported edges by a load in the plane of the plate,” A master’s degree thesis submitted to the School of Mines and Metallurgy of the University of Missouri, Rolla, Missouri, 1960.
- K. P. Soldatos, “On certain refined theories for plate bending,” ASME Journal of Applied Mechanics, Vol. 55: 994–995, 1988.
- Li Rui, Xiaoqin Ni, Gengdong Cheng, “Symplectic superposition method for benchmark flexure solutions for rectangular thick plates,” J. Eng. Mech., 10:1-17, 2014.
- I.I. Sayyad, S.B. Chikalthankar, and V.M. Nandedkar, “Bending and free vibration analysis of isotropic plate using refined plate theory, “ Bonfring International Journal of Industrial Engineering and Management Science, Vol. 3(2): 40-46, 2013.
- A.S. Mantari, C. Oktem, Guedes Soares, “A new trigonometric shear deformation theory for isotropic, laminated composite and sandwich plates,” Int. J. Solids and Struc, Vol. 49: 43-53, 2012.
- E. I. Adah, D. O. Onwuka, O. M. Ibearugbulem, “Development of polynomial based program for pure bending analysis of SSSS rectangular thin isotropic plate,” International Journal of Science, Engineering and Technology Research (IJSETR), Vol. 5(7): 2290-2295, 2016.
- F. O. Okafor, O. T. Udeh, “Direct method of analysis of an isotropic rectangular plate using characteristic orthogonal polynomials,” Nigerian Journal of Technology (NIJOTECH), Vol. 34(2): 232 – 239, 2016.
- C. H. Aginam, C. A. Chidolue, C. A. Ezeagu, “Application of direct variational method in the analysis of isotropic thin rectangular plates,” ARPN Journal of Engineering and Applied Sciences, Vol. 7(9):1128-1138, 2012.
- E. Reissner, “A note on bending of plates including the effects of transverse shearing and normal strains,” ZAMP: Zeitschrift fur Angewandte Mathematik und Physik, Vol. 32: 764–767, 1981.
- D. W. Cooke, M. Levinson, “Thick rectangular plates- II, the generalized Levy solution,” International journal of Mechanical Sciences, Vol. 25: 207-215, 1983.
- C. M. Wang, J. N. Reddy, K. H. Lee, “Shear deformable beams and plates. Relationship between classical plate theories,” Elsevier science ltd, Uk, 2000.
- A. S. Sayyad, Y. M. Ghugal, “Bending and free vibration analysis of thick isotropic plates by using exponential shear deformation theory,” Applied and Computational Mechanics, Vol. 6(1): 65–69, 2012.
- Amale Mahi, El Abbs Adda Bedia, Abdalouahed Tausi, “A new hyperbolic shear deformation theory for bending and free vibration analysis of an isotropic, functionally graded, sandwich, laminated composite plate,” Applied mathematical modelling, Vol. 25: 2489-2508, 2015.
- Y. M. Ghugal, A. S. Sayyad, “Free vibration of thick isotropic plates using trigonometric shear deformation theory,” J. Solid Mech. Vol. 3(2): 172-182, 2011.
- I. I. Sayyad, S. B. Chikalthankar, V. M. Nandedkar, “Trigonometric shear deformation theory for thick plate analysis,” International Conference on Recent Trends in engineering & Technology – 2013 (ICRTET’2013) Organized By: SNJB’s Late Sau. K. B. Jain College of Engineering, Chandwad.
- O. M. Ibearugbulem, F. C. Onyeka, “Moment and stress analysis solutions of clamped rectangular thick plate,” European Journal of Engineering Research and Science, Vol. 5(4): 531-534, 2020.
- F. C. Onyeka, F.C, “Direct analysis of critical lateral load in a thick rectangular plate using refined plate theory,” International Journal of Civil Engineering and Technology Vol. 10(5): 492-505, 2019.
- F. C. Onyeka, O. M. Ibearugbulem, “Load analysis and bending solutions of rectangular thick plate. International journal on emerging technologies,” 11(3): 1103–1110, 2020.
- F. C. Onyeka and F. O. Okafor, H. N. Onah,, “Application of exact solution approach in the analysis of thick rectangular plate,” International Journal of Applied Engineering Research, Vol. 14(8): 2043-2057, 2019.
- Gwarah, Ledum Suanu, “Application of shear deformation theory in the analysis of thick rectangular plates using polynomial displacement functions. A published PhD. thesis presented to the school of postgraduate studies in civil engineering, federal university of technology, Owerri, Nigeria, 2019.
Citations by Dimensions
Citations by PlumX
Google Scholar
Scopus
Crossref Citations
- Onyeka Festus Chukwudi, Okeke Thompson Edozie, Nwa-David Chidobere, "Buckling Analysis of a Three-Dimensional Rectangular Plates Material Based on Exact Trigonometric Plate Theory." Journal of Engineering Research and Sciences, vol. 1, no. 3, pp. 106, 2022.
- Piotr Szablewski, "Analysis of the Stability of a Flat Textiles with a Two-Parameter Deflection Curve." Materials, vol. 17, no. 2, pp. 503, 2024.
- Festus Chukwudi Onyeka, Chidobere David Nwa-David, Thompson Edozie Okeke, "Study on Stability Analysis of Rectangular Plates Section Using a Three-Dimensional Plate Theory with Polynomial Function." Journal of Engineering Research and Sciences, vol. 1, no. 4, pp. 28, 2022.
- Festus Chukwudi Onyeka, "Stability analysis of three-dimensional thick rectangular plate using direct variational energy method." Journal of Advances in Science and Engineering, vol. 6, no. 2, pp. 1, 2022.
No. of Downloads Per Month
No. of Downloads Per Country