Smartphone Influence Factor of University Student’s Academic Achievement
 , Meyliana 1, Kristianus Oktriono 2, Mika Milenia Catherine 1, Chutiporn Anutariya 3, Erick Fernando 1
Adv. Sci. Technol. Eng. Syst. J. 5(5), 692–697 (2020);
 DOI: 10.25046/aj050585
The smartphone is a phenomenal device or tool that recently transform the habit of people. In this part, the smartphone serves not only as a communication device but also more complex functionality. The early research reported that smartphones are used by university students to support their social and academic activities. However, the research report that explores how much influence factor of smartphone for educational university student activities is scarce, especially for academic achievement index. Therefore, this explanatory research examines the exploration of the smartphone influence factor with university student background (such as gender, achievement index), academic, and social activities. This study applied SPSS tools with the Correlation Bivariate technique to investigate the influence factor and successfully obtained 17 essentials correlation or relationship between factors.
1. Introduction
Smartphone has been popular because of the integration of technology in a portable device and the adoption of advance features. In this line, the users are engaged with the capability and personal management. The features of smartphones keep developing day by day, from the communication device to communicate using voice, picture/image, and video, for gaming single or multi player [1], or social activities. Arguably, it centralized the element of connectivity and global access. However, the previous study reported that smartphones are used by university students not only for social network activities but also for academic activities[2], [3]. As stated, the usage of smartphones for educational activities will assist a university student to fulfil the academic assignment[4]-[6]. In the other hand, previous research state that smartphone is not suitable for student [7].
Thus, this study explores how strong the influence of smartphones for social and academic activities. The study used explanatory or causal method research that explores the significance between two factors. The factors consist of student backgrounds such as achievement index, gender, smartphone screen width, and activities that use a smartphone. In this research, the Correlation Bivariate technique is used to describe how significant the influence of smartphones used by a university student for academic and social network activities. At the end of this study, it obtains 17 essential factors that explain the gender, age, and screen width. In this sense, achievement index is an influencing factor to university student academic and social network activities. The result of this study brings another insight into smartphone development in the feature and positive habit of a university student that uses the smartphone to gain a better achievement index.
Hypotheses for this study are:
- The university student backgrounds (for example age, gender) influence achievement index.
- The university student’s smartphone feature (for example screen width) influences achievement index.
H0 where there is no influence between factors. H1 where there is influence between factors.
2. Literature Review
2.1. Smartphone
The smartphone is a device that has many features such as a communication device and can be used for any application installation purposes such as for FinTech payment, online transportation [7], e-book reading [8], and sending text/video/image message [2].
2.2. University Student Social network activities
The social network activities are an activity conducted by university student using a smartphone to communicate with other persons or group to access a social network, such as Instagram, Pinterest, Facebook, access to the website, playing a game, watching movie or film such as on YouTube [2].
2.3. University Student Academic activities
This term means that university students use a smartphone to support academic activities such as searching for content or information on learning, discussion with others in correlation with learning content [2].
2.4. The Explanatory or Causal Research
The explanatory or causal research is a method of analysis that mostly used in marketing to look for activity influence factor[9]. The study used causal or explanatory method aiming to look for the influence between factors of university student background, smartphone features, and university student daily activity that is performed by using smartphone [2].
3. Result and Discussion
This study uses explanatory/causal method research. In this part, the method is used for marketing research to look for routine activities. In a closer look, a university student is a primary respondent as the most active user that facilitates smartphone to support their academic and social network activities.
Table 1: Respondent
| No | Description | Total |
| 1 | Gender (1Gn)
See figure 1 for detail |
419 (100%) |
| 2 | Age (2Ag)
Below 17 years’ old Between 18 – 25 years old Between 26 – 30 years old Above 30 years old |
419 (100%)
3 (0.7%) 409 (97.6%) 4 (1.0%) 3 (0.7%) |
| 3 | Screen Width (3Sc)
See figure 2 for detail |
419 (100%) |
| 4 | Achievement Index (4Ai)
Less than 2.0 2.00 – 2.50 2.51 – 2.99 Greater than 3.0 |
419 (100%)
19 (4.5%) 26 (6.2%) 85 (20.5%) 288 (68.7%) |
Table 1 described the characteristics of the 419 respondents — the age of respondents is mostly between 18 to 25 years old or the age of university students from several universities in Indonesia. Based on APJII (Indonesia internet provider) report, it showed that university student is the most active user that use internet or social media with around 127 million users [10]; therefore, the respondents are representative for the population.
Figure 1 exhibits the respondent by gender, where 258 (61.6%) respondents are female and 161 males (38.4%). Figure 2 exhibits the smartphone used by the university student, with details of 8 university students used screen width below 3 inches (1.9%), 119 (28.4%) between 3 to 4 inches, 276 (65.9%) between 5 to 6 inches, and 16 (3.8%) used a smartphone with greater than the 7-inch screen width.
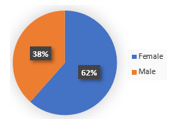
Figure 1: Respondent by Gender
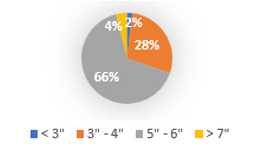
Figure 2: Smartphone Screen Width
Table 2: Validity Test
| No | Description | Corrected Item-Total Correlation | Status |
| 1 | Smartphones used to access social media (FC1) | 0.282 | Valid |
| 2 | I have the knowledge needed to use a Smartphone (FC2) | 0.410 | Valid |
| 3 | Smartphones help provide solutions to face difficulties in the academic field (FC3) | 0.527 | Valid |
| 4 | Smartphones help in finding information about learning when needed (FC4) | 0.530 | Valid |
| 5 | Smartphone used to facilitate all access to information (FC5) | 0.582 | Valid |
Table 2 described the validity result process of questioners. The validation is processed by comparing the value of Corrected item-total Correlation (CI-TC), and r table value. In this study, the r table value for 400 samples is 0.0978. The questioner is valid if CI-TC higher than 0.0978. It means that all questions are valid.
Table 3: Reliability Test
| No | Description | Cronbach’s Alpha | Status |
| 1 | FC1 | 0.721 | Reliable |
| 2 | FC2 | 0.682 | Reliable |
| 3 | FC3 | 0.629 | Reliable |
| 4 | FC4 | 0.611 | Reliable |
| 5 | FC5 | 0.610 | Reliable |
Table 3 described the consistency of the questioner. The result shows that Cronbach’s Alpha is significant (more than 0.6) and reliable [11]. The following process of this study uses SPSS tools and the Bivariate technique to examine the correlation between academic background, respondent, background, and usage of smartphone activities factors. Table 4 describes 36 relations result based on the calculation of the Correlation Bivariate technique.
The hypotheses result described in Table IV can be interpreted as follows:
- There is a correlation or relationship between the factor of hypothesis 0 (where there is no relation between factors) rejected, and hypothesis 1 (where there is a relationship between factors) accepted.
- There is no correlation or no relationship between factors where hypothesis 0 is accepted, and the hypothesis 1 is
Table 4: Hypothesis Result
| No | Description | Pearson Correlation | H0 | H1 |
| 1 | 1Gn – 2Ag | NC | Accepted | Rejected |
| 2 | 1Gn – 3Sc | NC | Accepted | Rejected |
| 3 | 1Gn – 4Ai | r -0.440**
0.000 |
Rejected | Accepted |
| 4 | 1Gn – FC1 | NC | Accepted | Rejected |
| 5 | 1Gn – FC2 | NC | Accepted | Rejected |
| 6 | 1Gn – FC3 | NC | Accepted | Rejected |
| 7 | 1Gn – FC4 | NC | Accepted | Rejected |
| 8 | 1Gn – FC5 | r -0.147**
sig 0.003 |
Accepted | Rejected |
| 9 | 2Ag – 3Sc | NC | Accepted | Rejected |
| 10 | 2Ag – 4Ai | NC | Accepted | Rejected |
| 11 | 2Ag – FC1 | r -0.231**
sig 0.000 |
Rejected | Accepted |
| 12 | 2Ag – FC2 | NC | Accepted | Rejected |
| 13 | 2Ag – FC3 | NC | Accepted | Rejected |
| 14 | 2Ag – FC4 | NC | Accepted | Rejected |
| 15 | 2Ag – FC5 | NC | Accepted | Rejected |
| 16 | 3Sc – 4AI | NC | Accepted | Rejected |
| 17 | 3Sc – FC1 | r 0.135**
sig 0.006 |
Rejected | Accepted |
| 18 | 3Sc – FC2 | NC | Accepted | Rejected |
| 19 | 3Sc – FC3 | NC | Accepted | Rejected |
| 20 | 3Sc – FC4 | NC | Accepted | Rejected |
| 21 | 3Sc – FC5 | NC | Accepted | Rejected |
| 22 | 4Ai – FC1 | NC | Accepted | Rejected |
| 23 | 4Ai – FC2 | NC | Accepted | Rejected |
| 24 | 4Ai – FC3 | r 0.137**
sig 0.005 |
Rejected | Accepted |
| 25 | 4Ai – FC4 | r 0.106*
sig 0.030 |
Rejected | Accepted |
| 26 | 4Ai – FC5 | r 0.195**
sig 0.000 |
Rejected | Accepted |
| 27 | FC1 – FC2 | r 0.296**
sig 0.000 |
Rejected | Accepted |
| 28 | FC1 – FC3 | r 0.197**
sig 0.000 |
Rejected | Accepted |
| 29 | FC1 – FC4 | r 0.122*
sig 0.012 |
Rejected | Accepted |
| 30 | FC1 – FC5 | r 0.210**
sig 0.000 |
Rejected | Accepted |
| 31 | FC2 – FC3 | r 0.311**
sig 0.000 |
Rejected | Accepted |
| 32 | FC2 – FC4 | r 0.224**
sig 0.000 |
Rejected | Accepted |
| 33 | FC2 – FC5 | r 0.349**
sig 0.000 |
Rejected | Accepted |
| 34 | FC3 – FC4 | r 0.519**
sig 0.000 |
Rejected | Accepted |
| 35 | FC3 – FC5 | r 0.421**
sig 0.000 |
Rejected | Accepted |
| 36 | FC4 – FC5 | r 0.591**
sig 0.000 |
Rejected | Accepted |
The detail explanation of Table 4 is as follows:
3.1. Explanation H1 & H0 from Table IV with Pearson sig value indicator
The hypothesis result is described with Pearson sig value indicator. If the Pearson sig indicator is lower than 0.05, it signifies hypothesis 0 or no correlation. In other words, it means that H0 is rejected, and hypothesis 1 is accepted. Conversely, if it is greater than 0.05, hypothesis 0 is accepted and hypothesis 1 is rejected.
3.2. Explanation of Bivariate Correlation between factors
This section explains all the factors that have a relationship with other factors.
There is a relationship between 1Gn with 4Ai where the Pearson r value is -0.440, sig 0.000, and alpha 99%. It indicates that the female (because of minus sign) is more likely having high index achievement compare to the male university student.
There is a relationship between 1Gn with FC5 where the Pearson r value is -0.147, sig 0.003, and alpha 99%. It signifies that the female (because of minus sign) is more likely using the smartphone to facilitate all access to information. However, males tend to the less-used smartphone to facilitate all access to information.
There is a relationship between 2Ag with FC1 where the Pearson r value is -0.231, sig 0.000, and alpha 99%. It represents that the younger age (because of the minus sign) is more likely using smartphones to access social media. However, the older generation tends to less-used smartphones to access social media.
There is a relationship between 3Sc with FC1 where the Pearson r value is 0.135, sig 0.006, and alpha 99%. It denotes that the bigger screen size, the user is more likely to use smartphones to access social media. However, the smaller screen size, the user tends to less use the smartphones to access social media.
There is a relationship between 4Ai with FC3 where the Pearson r value is 0.137, sig 0.005, and alpha 99%. It shows that the higher achievement index, the user is more likely using smartphones to provide solutions in encountering difficulties in the academic field. However, the user with lower achievement index, one tends to fewer use smartphones in providing solutions to meet the challenges in the educational area.
There is a relationship between 4Ai with FC4 where the Pearson r value is 0.106, sig 0.030, and alpha 95%. It states that the university student that has a higher achievement index is more likely using smartphone in finding information about learning when needed.
There is a relationship between 4Ai with FC5 where the Pearson r value is 0.195, sig 0.000, and alpha 99%. It describes that the university student that has a higher achievement index is more likely using the smartphone to facilitate all access to information. However, the university students with lower achievement index, they tend to less use the smartphone to facilitate all access to information.
There is a relationship between FC1 with FC2 where the Pearson r value is 0.296, sig 0.000, and alpha 99%. It expresses that the university student that has more frequent in using a smartphone to access social media, they are more likely to have more knowledge (familiar) needed to use a smartphone.
There is a relationship between FC1 with FC3 where the Pearson r value is 0.197, sig 0.000, and alpha 99%. It points out that the university student who has more frequent use of a smartphone to access social media, one is more likely to use the smartphone to find solutions to face difficulties in the academic field. However, university students that have less frequent use of the smartphone to access social media, they tend to less use the smartphone to find solutions in the academic field.
There is a relationship between FC1 with FC4 where the Pearson r value is 0.122, sig 0.012, and alpha 99%. It implies that the university student that has more frequent use of a smartphone to access social media, one is more likely to use the smartphone to finding information about learning when needed. However, university students that have less frequent use of the smartphone to access social media, they tend to less use the smartphone to find information about education when required.
There is a relationship between FC1 with FC5 where the Pearson r value is 0.210, sig 0.000, and alpha 99%. It depicts that the university student that has more frequent use of a smartphone to access social media, one is more likely to use the smartphone to facilitate all access to information. However, the university student that less frequently use the smartphone to access social media, one tends to less use smartphone to facilitate all access to information.
There is a relationship between FC2 with FC3 where the Pearson r value is 0.311, sig 0.000, and alpha 99%. It clarifies that the university student that has more knowledge needed to use a smartphone, one is more likely using the smartphone to find solutions in the academic field. However, university student that has less experience required to use a smartphone, one tends to less use a smartphone to find solutions and to meet the challenges in the educational area.
There is a relationship between FC2 with FC4 where the Pearson r value is 0.224, sig 0.000, and alpha 99%. It indicates that the university student that has more knowledge needed to use a smartphone is more likely to use a smartphone to help in finding information about learning when required. However, university student that has less experience required to use a smartphone tends to less use smartphone to assist in finding information about education when required.
There is a relationship between FC2 with FC5 where the Pearson r value is 0.347, sig 0.000, and alpha 99%. It reveals that the university student that has more knowledge needed to use a smartphone, one is more likely using a smartphone to facilitate all access to information. However, university student that has less experience required to use a smartphone, one tends to less use smartphone to facilitate all access to information.
There is a relationship between FC3 with FC4 where the Pearson r value is 0.519, sig 0.000, and alpha 99%. It symbolizes that the university student that has to use the smartphone to find solutions in the academic field, one is more likely using a smartphone to find information about learning when needed. However, a university student who has a less-used smartphone to find solutions in the academic field, one tends to less use a smartphone in finding information about learning when needed.
There is a relationship between FC3 with FC5 where the Pearson r value is 0.421, sig 0.000, and alpha 99%. In this part, the university student who uses smartphone more frequent to encounter difficulties in the academic field, one is more likely using the smartphone to facilitate all access to information. However, a university student who less frequent uses smartphone to find solutions in the academic field, one tends to less use smartphone to facilitate all access to information.
There is a relationship between FC4 with FC5 where the Pearson r value is 0.591, sig 0.000, and alpha 99%. In this context, the university student who uses smartphone more frequent to find information about learning when needed, one is more likely using the smartphone to facilitate all access to information. However, a university student who uses the smartphone less frequently to find information about education when needed, one tends to fewer use smartphones to facilitate all access to information.
3.3. Strength correlation tension between factors
The strength correlation tension can be measured by examining the Pearson r value converted into absolute Pearson r or | r |. In this part, the percentage of strength value originates from the percentage square of absolute Pearson r value. Technically, strength correlation tensions are divided into 3 group values. The first represents the absolute r or |r| between 0.1 and 0.3 with the indication of the strong correlation tension is small. Following that, the strong correlation tension is medium in the range of between 0.3 and 0.5. Finally, the strong correlation tension is substantial with the value is higher than 0.5 [12]. Table 5 represents the strength correlation tension in detail.
Table 5: Strength Correlation Tension
| No | Description | | r | | Strength | | r |2 | % |
| 1 | 1Gn – 4A1 | 0.440 | Medium | 0.194 | 19.4% |
| 2 | 1Gn – FC5 | 0.147 | Small | 0.022 | 2.2% |
| 3 | 2Ag – FC1 | 0.231 | Small | 0.053 | 5.3% |
| 4 | 3Sc – FC1 | 0.135 | Small | 0.018 | 1.8% |
| 5 | 4Ai – FC3 | 0.137 | Small | 0.019 | 1.9% |
| 6 | 4Ai – FC4 | 0.106 | Small | 0.011 | 1.1% |
| 7 | 4Ai – FC5 | 0.195 | Small | 0.038 | 3.8% |
| 8 | FC1 – FC2 | 0.674 | Strong | 0.454 | 45.4% |
| 9 | FC1 – FC3 | 0.679 | Strong | 0.461 | 46.1% |
| 10 | FC1 – FC4 | 0.661 | Strong | 0.437 | 43.7% |
| 11 | FC1 – FC5 | 0.616 | Strong | 0.379 | 37.9% |
| 12 | FC2 – FC3 | 0.674 | Strong | 0.454 | 45.4% |
| 13 | FC2 – FC4 | 0.224 | Small | 0.050 | 5.0% |
| 14 | FC2 – FC5 | 0.349 | Medium | 0.122 | 12.2% |
| 15 | FC3 – FC4 | 0.519 | Strong | 0.269 | 26.9% |
| 16 | FC3 – FC5 | 0.421 | Strong | 0.177 | 17.7% |
| 17 | FC4 – FC5 | 0.591 | Strong | 0.349 | 34.9% |
Table 5 presents the detail of relation, strength relation, and % of the influence. Figure 3 exhibits the percentage of the tension of influence.
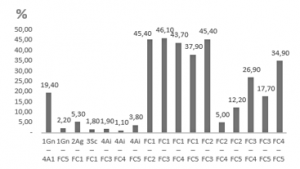
Figure 3: Percentage of Tension Correlation
The explanation of Table 5 and Figure 1. is as follows:
For 1Gn – 4Ai, it indicates that 19.4% (medium influence) gender factor influences on achievement index.
For 1Gn – FC5, it states that 2.2% (small influence) gender factor influences on the use of a smartphone to facilitate all access to information.
For 2Ag – FC1, it describes that a 5.3% (small influence) age factor influences on the use of a smartphone to access social media.
For 3Sc – FC1, it denotes that a 1.8% (small influence) screen width factor influences on the use of a smartphone to access social media.
For 4Ai – FC3, it states that a 1.9% (small influence) achievement index influences on using a smartphone to provide solutions in the academic field.
For 4Ai – FC4, it means that a 1.1% (small influence) achievement index influences on the use of smartphones to find information about learning when needed.
For 4Ai – FC5, it denotes that a 3.8% (small influence) achievement index influences on the use of a smartphone to facilitate all access to information.
For FC1 – FC2, it implies that a 45,4% frequent use of a smartphone to access social media influences strongly on a university student who has more knowledge needed to use a smartphone.
For FC1 – FC3, it expresses that a 46.1% frequent use of smartphones to access social media influences strongly on using a smartphone to provide solutions in the academic field.
For FC1 – FC4, it means that a 43.7% frequent use of the smartphone to access social media influences strongly on using a smartphone to find information about learning when needed.
For FC1 – FC5, it presents that a 37.9% frequent use of the smartphone to access social media influences strongly on using a smartphone to facilitate all access to information.
For FC2 – FC3, it signifies that 45.4% of university students who have the knowledge needed to use smartphone influences strongly on using a smartphone to find solutions in the academic field.
For FC2 – FC4, it describes that 5% (small influence) university students who have the knowledge needed to use smartphone influences on using a smartphone to find information about learning when required.
For FC2 – FC5, it states that 12.2% (medium influence) university students who have the knowledge needed to use a smartphone influence the using of the smartphone to facilitate all access to information.
For FC3 – FC4, it underlines that 26.9% (strong influence) smartphone provides solutions in the academic field. It influences the using of a smartphone to assist students in finding information about learning when needed.
For FC3 – FC5, it emphasizes that 17.7% (strong influence) smartphone assists students to find a solution in the academic field and influence on using a smartphone to facilitate all access to information.
For FC4 – FC5, it asserts that 34.9% (strong influence) smartphone assists the students in finding information about learning when needed. In this case, it influences on using a smartphone to facilitate all access to information.
3.4. Debatable result of Discussion
The early research reported that there is no influence of smartphones with academic achievement[5]. However, this study revealed that university student’s smartphone has a relationship or influence on academic achievement index and higher academic achievement index. In this line, it tends to maximize the use of smartphones for academic activities.
4. Conclusion
This research obtains an essential result that accentuates the university student background such as gender, age, achievement index, screen width smartphone. In another part, debatable results were found from the early study [5] with this study. In this sense, this study indicates that there is a relation or influence of smartphones with university student achievement index. This contributes to the university in creating attractive content for learning. Moreover, the result is expected to engage the student in digital learning and increase their performance. The research also states that habit activities of using the smartphone improve the learning achievement index.
Conflict of Interest
The authors declare no conflict of interest.
- A. Surjandy, Y. U. Chandra, “The Smartphone for Disseminating of Fake News by the University Students Game Player”, in 2017 International Conference on Information Management and Technology (ICIMTech), Yogyakarta, Indonesia, 14–18, 2017. https://doi.org/10.1109/ICIMTech.2017.8273503
- Surjandy, Julisar, “Is social media used as social activities or academic activities? (Study for college student’s subject in information technology)”, in Proceedings of 2016 International Conference on Information Management and Technology, ICIMTech 2016, Bandung, Indonesia, 130–134, 2017. https://doi.org/10.1109/ICIMTech.2016.7930316
- A. Lepp, J. Li, J. E. Barkley, S. Salehi-esfahani, “Computers in Human Behavior Exploring the relationships between college students ’ cell phone use , personality and leisure”, Computers in Human Behavior, 43, 210–219, 2015. http://doi.org/10.1016/j.chb.2014.11.006
- J. Gikas, M. M. Grant, “Mobile computing devices in higher education: Student perspectives on learning with cellphones, smartphones & social media”, The Internet and Higher Education, 19, 18–26, 2013. https://doi.org/10.1016/j.iheduc.2013.06.002
- M. Samaha, N. S. Hawi, “Relationships among smartphone addiction, stress, academic performance, and satisfaction with life”, Computers in Human Behavior, 57, 321–325, 2016. https://doi.org/10.1016/j.chb.2015.12.045
- S. So, “Mobile instant messaging support for teaching and learning in higher education”, The Internet and Higher Education, 31, 32–42, 2016. https://doi.org/10.1016/j.iheduc.2016.06.001
- S. Hadad, H. Meishar-Tal, I. Blau, “The parents’ tale: Why parents resist the educational use of smartphones at schools?”, Computers & Education, 157, 103984, 2020. https://doi.org/10.1016/j.compedu.2020.103984
- Surjandy, Julisar, “Do College Students use E-Book with Smartphone? ( Study for College Student’s Subject in Information Technology )”, in Proceedings of the International MultiConference of Engineers and Computer Scientists 2017, II, 15–18, 2017.
- H. Oppewal, ‘Causal Research’, in Wiley International Encyclopedia of Marketing, Chichester, UK: John Wiley & Sons, Ltd, 2010. https://doi.org/10.1002/9781444316568.wiem02001
- APJII, ‘BULETINAPJIIEDISI23April2018.pdf’, APJII, 1–7, 2018.
- UCLA, ‘What does Cronbach’s alpha mean?’, stats.idre.ucla.edu, 2019. [Online].https://stats.idre.ucla.edu/spss/faq/what-does-cronbachs-alpha-mean/
- K. Yeager, ‘LibGuides: SPSS Tutorials: Pearson Correlation’, kent.edu, 2019. [Online]. https://libguides.library.kent.edu/SPSS/PearsonCorr