Development of an IoT Platform for Stress-Free Monitoring of Cattle Productivity in Precision Animal Husbandry
 , Aidar Alimbayev 1, Sanat Baiguanysh 1, Nabi Nabiev 1, Askar Sharipov 1, Azamat Kokcholokov 1, Diego Caratelli 2
Adv. Sci. Technol. Eng. Syst. J. 6(1), 501–508 (2021);
 DOI: 10.25046/aj060155
Smart animal husbandries require the adoption of dedicated tools to assess the contribution of each animal to the production process. The IoT platform presented in this article is a real-team monitoring system for voluntary weighing of cattle. To this end, the ISO 18000-6 standard is used for animal identification through an ultra-high-frequency radio link between a reader antenna and suitable ear tags. A customized data processing algorithm has been developed and embedded in the considered system. To demonstrate the effectiveness of the solution, extensive measurements have been carried out in a real-life environment. The proposed IoT platform is useful to farmers as a control tool for selection and breeding work.
1.Introduction
Milk production plays an essential role in the global economy. Four major world exporters of dairy products (USA, EU, New Zealand, Australia) produced more than 239.2 million tons in 2019. According to the United Nations’ food and agriculture organization, milk production, and the price Index for dairy products are growing annually [1]. To increase the volume of raw milk production, it is not unimportant to encourage the use of new technologies. Telemetry and monitoring systems for agricultural production are considered one of the most innovative technologies in precision animal husbandry and are automatic systems for collecting and transmitting information and data analysis and remote decision-making.
Currently, livestock farms use mainly technologies for measuring various parameters inside the farm (ventilation, power supply, heating, etc.), but unfortunately, a small proportion of them are focused directly on the animal. Modern technological tools (temperature sensors, pH sensors, identification sensors, wireless communications, Internet, and cloud storage) make it possible to monitor each animal separately.
A key indicator of the development of young cattle is their weight. In order to obtain maximum accuracy of the mass of cattle, weighing should be carried out repeatedly, using conventional industrial scales or more modern electronic devices. Weighing should be carried out regardless of the animals’ location, whether it is a farm or a remote pasture. In most cases, the weighing process is carried out in manual or semi-automatic mode and takes some time. Furthermore, the weighing procedure is stressful for the entire herd. It is not uncommon to use less accurate methods of measuring the weight of animals without using scales, and the assessment is based on the size of body parts. This method is not very effective and requires highly qualified personnel.
2. Review of alternative developments
2.1. RFID-based systems
The introduction of radio-frequency identification tags has had a massive impact on the technological development of animal husbandry. The use of RFID systems has contributed to the development of the concept of precision animal husbandry. Intensive research on automatic cattle weighing systems using RFID has led to new developments.
The Australian company TRU-TEST develops systems for measuring cattle’s weight when an individual passes through a dedicated gate. The TRU-TEST data collection system assumes direct control and the operator’s close presence when measuring the weight of a cow [2]. Autonomy is limited by the need for a smartphone to collect data and transmit it to the server. Human resources and the lack of an Autonomous data transmission channel limit this approach.
2.2. Systems based on LF RFID and voluntary weighing
Automatic systems that use LF RFID and stress-free weighing of animals include those supplied by GrowSafe and Intergado.
GrowSafe is a Canadian company that develops systems for automatic data collection from cattle [3], [4]. The systems are equipped with RFID antennas for reading ear tags. The watering and weighing station is integrated with electronic scales. One of the main constraints is the cost of installation. Besides, because of the inadequate cellular network coverage of rural areas and pastures, data transmission over 3G/4G networks is problematic.
Intergado is a Brazilian company that develops dedicated solutions for monitoring cattle based on RFID technology. In such solutions, the scales are integrated on load cells that regularly weigh food and water. When an animal visits the feeder, the system records its RFID tag, arrival time, departure, and duration of consumption [5], [6].
GrowSafe and Intergado systems were originally designed for indoor use, but they can also be installed in pastures. They are very effective from an application standpoint but use technologies and equipment that require large financial investments. Costs associated with the transportation of the equipment from North / South America and its installation in the final site are also, typically, significant.
3. Proposed weighing platform
This article presents a system consisting of hardware and software elements for precision animal husbandry aimed at obtaining information about the weight of the animal, the number of approaches to watering, the time and duration of drinking, with the possibility of performing insect spraying. In this context, the animal’s age is assumed to be between 8 and 14 months, and weight is estimated based on the pressure made by the individual animal with the front hooves on the integrated platform. Following best practice in applied info-communication technology, a block diagram of the experimental setup used for remote monitoring of the live weight of animals has been developed and reported in Figure 1.
In order to organize the identification of animals, a reader with UHF RFID tags is used. Strain gauges are used for weighing. The platform’s connection with the central information unit is established using multiple communication channels: via LoRaWAN, via GSM (backup), and via WiFi (for wireless configuration of the controller module). The solar power plant provides an autonomous power supply in the field.
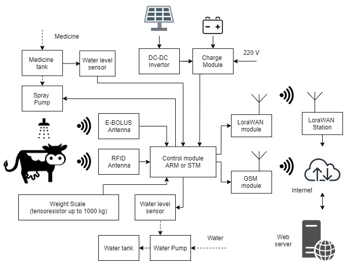 Figure 1: Block diagram of cattle telemetry system
3.1. Design of the weighing platform
The design of the developed platform has been performed in such a way as to achieve measurable benefits against alternative solutions already available on the market. Furthermore, in order to achieve high measurement accuracy, extensive data concerning the weight and growth of young local cattle has been collected and judiciously used.
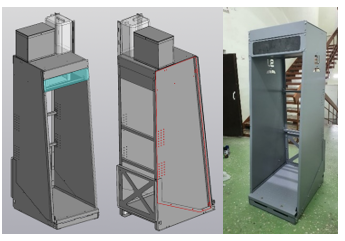 Figure 2: 3D model and implementation of the experimental sample
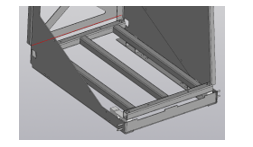 Figure 3: 3D model of the experimental sample pallet with pressure sensors
The main structure is designed in such a way as to resemble a “phone booth” with two side walls and a back wall with an opening for the head of the animal. The side walls have an oblique edge on the entrance side and a straight edge on the side of the drinker, for easy integration to it. For better accessibility to the electronic components in the lower part of the platform, a novel approach to the installation of the scales has been developed. Contrary to Growsafe solution, where the entire structure is mounted on strain gauges, in our system, the scales are only pressured by the pallet on which the animal stands (see Figure 2).
The design of the fasteners for the strain gauges has been optimized so that, during assembly, easy access is given to all the bolted connections (see Figure 3).
While designing the platform, the properties of the metal structures have been optimized so that the mechanical deformation under a load of 2000 N results in a maximum offset not exceeding 0.36 mm. This is important to make sure that the pressure sensors can withstand the full load from the weight of young cattle (see Figure 4).
 Figure 4: Statistical analysis of the pallet for deformation
3.2. Radio-frequency identification of animals
Animal identification is regulated by ISO 18000-6 standard. According to that, the radio interface is established in the frequency range between 860 MHz and 930 MHz using long-range ultra-high-frequency (UHF) radio-frequency-identification (RFID) devices [7].
Extensive research has been devoted to antennas for RFID tags. A more in-depth analysis of passive RFID systems can be found in several publications [8], [9]. In [10], [11], the calculation methods for various antennas are presented. In [12], the principles of operation of RFID systems in the presence of backscattering are illustrated. To achieve the maximum reading range, it is necessary to properly match the complex impedances of the tag antenna and the integrated circuitry. Most often, for optimal read performance, the antenna impedance is matched to the chip impedance at the minimum chip power level.
Various modulation and encoding schemes are used to transmit data between the reader and the tag. A UHF RFID system based on reflected signal modulation in the UHF band can be produced at a reasonable price, though the system’s overall efficiency can severely limit the readability. At the same time, the characteristics of the antenna can radically affect the performance of RFID systems.
In the presented study, the working frequency of 868 MHz is selected for the developed RFID system.
A Chafon CF-MU930T reader with integrated UHF RFID antenna featuring circular polarization and 9dBi gain is adopted for reading ultra-high-frequency identification tags (see Figure 5) [13].
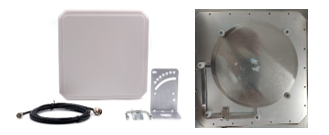 Figure 5: UHF RFID antenna used in the proposed development
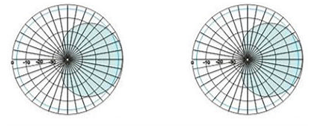 Figure 6: UHF RFID reader antenna radiation patterns
The ISO/IEC 18000-6C EPC global Class 1 Gen 2 ear tag contains an Impinj Monza® 4 chip and operates at 868 MHz (figure 6). The complex conjugate of the chip load at the specified frequency is expressed as an impedance of 13 + j151 Ω.
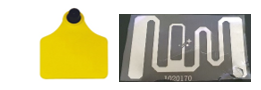 Figure 7: Ear tag and embedded UHF antenna used for identification
At the initial stage of development, it is necessary to identify the optimal installation site of the antenna as well as the reader’s required power. A necessary condition is to ensure that the reader antenna illuminates the ear tag antenna with a minimum gain level to achieve good communication quality.
A limiting factor for applying the maximum reader power of 30 dBm is related to the possibility of performing an erroneous reading of nearby animals. An additional difficulty in selecting the proper power level is associated with the tag’s location on the animal’s ear at the time of reading. The antenna can be perpendicular or have an acute angle relative to the ground surface. If the reader antenna is positioned above the animal’s head, the tag may be covered by the ear, thus possibly resulting in low communication quality.
Before conducting the actual experiment [14], numerical simulations of the communication channel have been performed using COMSOL Multiphysics.
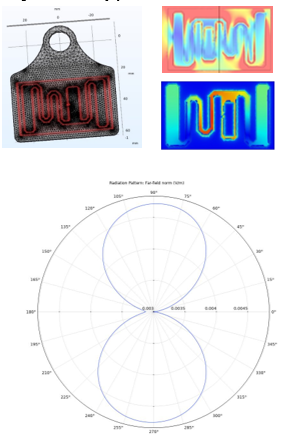 Figure 8: Current distribution and radiation pattern of the RFID tag antenna
The adopted model consists of the UHF RFID reader and tag antennas, surrounded by an air region terminated with perfectly matched layers (PML). The operating frequency of both antennas is 915 MHz. In particular, the RFID tag is made out of a 0.2-mm thick polypropylene board with a thin embedded aluminum pattern that is modeled as an ideal electrical conductor (PEC). The tag antenna is an electrically small dipole (see Figure 7) whose radiation pattern is reported in Figure 8. On the other hand, the reader integrates a directional metal stamped patch antenna (see Figure 5) characterized by an input power level of 5W. Using the developed numerical model, one can quickly evaluate the power level radiated by the reader antenna and received by the tag.
Figure 9 shows the placement of the reader antenna inside the weight platform. The distance between the antenna and the tag ranges from 30 cm to 80 cm. In real-life conditions, in the presence of an animal with total height of 190 cm inside the platform, the distance between the two antennas is typically 55 cm.
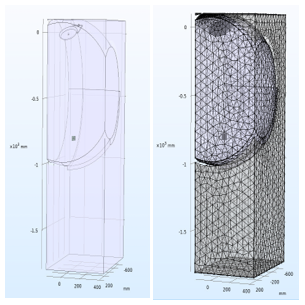 Figure 9: Model of the UHF RFID system inside the weighing platform
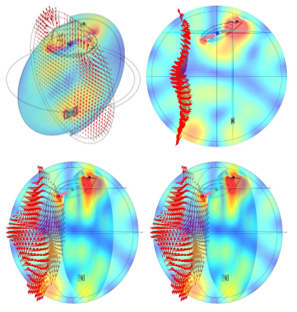 Figure 10: Electric field distribution excited within the UHF RFID system
Extensive analysis has been carried out as a function of the reader antenna’s location relative to the platform surface and relevant sidewalls. The results relevant to the Electric Field (EMF) distribution in different system configurations are reported in Figure 10.
After the computer-aided modeling stage, experimental verifications have been conducted. Based on the data collected through numerical simulations, the reader antenna has been mounted with an optimal angle of 380 degrees relative to the platform tray and of 260 degrees relative to the side-wall of the structure, in such a way as to be in the line of sight with the animal’s ear on which the tag is installed. To this end, a dedicated mechanical support for the reader antenna has been designed and integrated (see Figure 11).
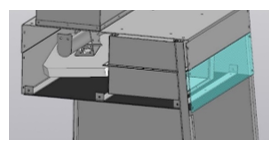 Figure 11: 3D model of the upper section of the platform inclusive of reader antenna and central electronic unit
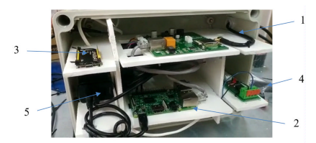 Figure 12: Layout of the electronic unit (1-UHF RFID Reader, 2-Raspberry Pi, 3-LoRa Module, 4-Spray control unit, 5-Power Adapter)
3.3. Electronic unit integrated in the weighing platform
The central electronic unit of the system is based on the modular integration of off-the-shelf components, as it can be noticed in Figure 12.
In particular, four TAL214A(350) strain gauges are connected, via the GoldShine SS-4/S equalizer, to an Arduino UNO controller. In order to process the data received from the strain gauges, a dedicated code has been implemented using the Arduino Wiring programming language. The weight information is sent to the main system controller – a Raspberry Pi – via an I2C port relying on the RS-232 standard. The UHF RFID reader is connected to the computer and receives the identification number from the ear tag. After processing the received data, the Raspberry Pi sends the information to the cloud server. The WiFi module built into the Raspberry Pi single-board computer is used to establish the communication channel. The LoRa32u4 II module supports the remote connection, whereas a GSM/GPRS link is used as a backup channel for sending the final data.
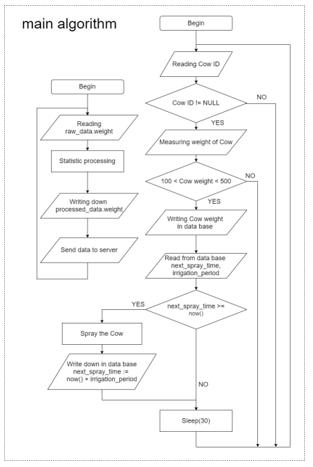 Figure 13: Block diagram of the main algorithm of the platform
 Figure 14: Structure of the database used in the Raspberry Pi
The electronic sub-system has been designed in such a way to withstand harsh environmental conditions in terms of humidity, temperature excursions, as well as mechanical stress, and vibration. It complies with the IP65 sealing class as per the international standard IEC 60529. The enclosure containing the electronic components and the antenna is mounted on the upper part of the platform and protected with vinyl to restrict access, whereas a glass window is used for inspection (see Figure 12).
3.4. Platform management software
The core of the code used for platform management is written in Python 3.7. The implemented algorithm executes two parallel threads. The first thread is relevant to identification, weight measurement, spraying, and data recording in the database. The second thread is used to process the data and store it in the Raspberry Pi unit before sending the relevant information to the server (see Figure 13).
The database is implemented in Raspberry Pi using the scheme described in Figure 14. As it can be noticed, the unique cow ID is reported in the database structures “raw data”, “processed data”, and “cow”. This scheme allows using the internal memory of the Raspberry Pi more efficiently. The data collected through the platform is transmitted from the main database to the server via the Internet. The server is characterized by IP address 194.4.56.86: 8501 where 8501 is the port selected for receiving JSON packets. Each packet contains the following information: “cow ID”, “cow weight”, “time stamp”, “weight indication”. Thus, the information on the server reports the weight of the individual cow at every access to the watering site.
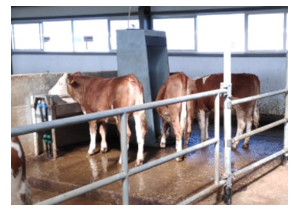 Figure 15: Testing the platform on a dairy farm
4. Experimental tests
The developed platform for live weight monitoring and identification has been tested at a dairy farm with 86 head of cattle having age of 10-12 months, kept in one pen. Two platforms were integrated with the existing drinkers while establishing the necessary wireless communication networks (see Figure 15).
Since the width of the drinker significantly exceeds the width of the scales (1.5 meters versus 0.6 meters), additional fences were realized and installed (see Figure 16). Please note that the animals have access to water only through the weighing platform. In this way, all the livestock in the pen was monitored during the experiment.
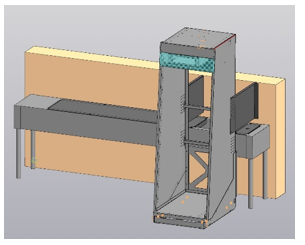 Figure 16: 3D model of the platform at the closed drinking bowl
5. Data processing on server
Once the platform is activated, a wireless communication channel is automatically established (via WiFi, LoRa, GSM/GPRS) and the collected data is sent to the server through an Internet connection at http://194.4.56.86/.
To acquire relevant information from the weighting installation, a REST API web service has been specifically developed. The data is structured in JSON format, as illustrated in the following example:
AnimalNumber: “KZC154000000”,
Date: “2019-12-16T13:15:00”,
Weight: 332.5,
ScalesModel: “Mambetov 2”
In the database, the information relevant to the weighting process is stored in the evt_Weighing table, whereas the BaseEvent table contains the general data concerning the individual event which is associated with the reg_Cow table (where the data related to the animals is reported).
 Figure 17: Weighing database structure on the server
In the central herd management system, the information is made available in tabular form as well as visually through diagrams as shown in Figure 18.
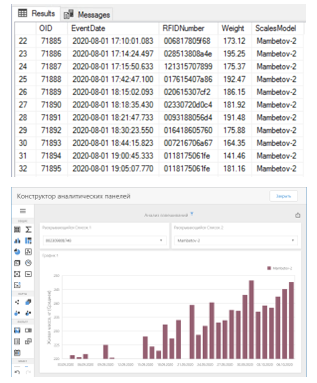 Figure 18: Data received from the platform and displayed on the server
6. Results
The pilot tests were initiated on August 8, 2019. Two platforms were used during these tests.
The data received from each animal has been combined into a single database. From 4 to 17 data packets are generated by each animal on a daily basis. Therefore, the total number of weight measurements per day could be in the range of 1000. Data processing will be discussed in a future work.
As an example, Table 1 shows the real-time weighing data relevant to an animal with ear tag ID 013716606d10, obtained on 2020-09-01 at 16:16:28, local time. The data is processed and stored in the memory of the single-board Raspberry Pi computer.
Table 1: Weight data relevant to the animal with ID 013716606d10
| No | weight | No | weight | No | weight |
| 1 | 193.70 | 36 | 205.81 | 71 | 204.53 |
| 2 | 203.56 | 37 | 205.81 | 72 | 204.43 |
| 3 | 208.06 | 38 | 205.81 | 73 | 204.82 |
| 4 | 202.77 | 39 | 205.81 | 74 | 204.29 |
| 5 | 204.20 | 40 | 205.81 | 75 | 204.25 |
| 6 | 203.58 | 41 | 205.81 | 76 | 205.33 |
| 7 | 205.35 | 42 | 205.81 | 77 | 204.49 |
| 8 | 203.54 | 43 | 205.81 | 78 | 204.09 |
| 9 | 202.40 | 44 | 207.37 | 79 | 202.98 |
| 10 | 205.18 | 45 | 206.35 | 80 | 203.14 |
| 11 | 204.44 | 46 | 208.26 | 81 | 204.06 |
| 12 | 203.59 | 47 | 204.93 | 82 | 204.02 |
| 13 | 204.12 | 48 | 204.12 | 83 | 203.46 |
| 14 | 203.61 | 49 | 204.50 | 84 | 203.97 |
| 15 | 204.89 | 50 | 203.83 | 85 | 203.25 |
| 16 | 204.70 | 51 | 202.09 | 86 | 204.08 |
| 17 | 204.59 | 52 | 202.98 | 87 | 203.16 |
| 18 | 204.56 | 53 | 204.28 | 88 | 202.97 |
| 19 | 204.34 | 54 | 204.54 | 89 | 203.02 |
| 20 | 204.09 | 55 | 203.75 | 90 | 202.14 |
| 21 | 203.42 | 56 | 204.18 | 91 | 201.40 |
| 22 | 204.28 | 57 | 203.96 | 92 | 201.38 |
| 23 | 204.29 | 58 | 203.85 | 93 | 190.72 |
| 24 | 203.18 | 59 | 203.75 | 94 | 204.86 |
| 25 | 205.81 | 60 | 204.23 | 95 | 210.68 |
| 26 | 205.81 | 61 | 203.15 | 96 | 208.17 |
| 27 | 205.81 | 62 | 204.08 | 97 | 196.08 |
| 28 | 205.81 | 63 | 203.63 | 98 | 199.45 |
| 29 | 205.81 | 64 | 204.01 | 99 | 198.73 |
| 30 | 205.81 | 65 | 203.61 | 100 | 196.61 |
| 31 | 205.81 | 66 | 203.54 | 101 | 198.40 |
| 32 | 205.81 | 67 | 203.71 | 102 | 186.53 |
| 33 | 205.81 | 68 | 204.80 | 103 | 131.85 |
| 34 | 205.81 | 69 | 204.68 | 104 | 15.25 |
| 35 | 205.81 | 70 | 204.88 | 105 | ______ |
The average weight of 201.16 kg is reported on the server (see Figure 16).
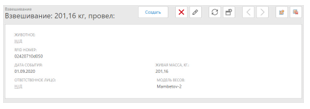 Figure 19: Data on server relevant to ID 013716606d10 on 2020-09-01 at 16:16
It is worth noting that the median weight is 204.19 kg. The difference of 3 kg with respect to the average weight is caused by the presence of the value 15.25 kg in the weight data set. That is due to the fact that the weight reading occurred at the time when the animal was leaving the platform. To avoid such issue, changes have been made to the algorithm used for evaluation of the weight, so that the information relevant to the actual weight of the animals before starting the automatic weighting procedures is properly taken into account. This allows assessing not only the dynamics in weight changes, but also accurately displaying the weight of the animal. To this end, the data collected from the individual RFID tag on a daily basis is, also, properly averaged.
7. Conclusion
When comparing the developed platform with existing solutions available on the market, one can note that the proposed system is characterized by reduced costs and ease of installation to existing drinkers, both indoor and outdoor. The design has been optimized in such a way as to enable high reading quality at low power values. The use of LoRa protocol allows overcoming the lack of cellular communication networks in the field while enabling favorable energy savings.
The functionality of the presented platform is virtually unlimited in relation to the data collection. Thanks to the use of a single-board computer, it is possible to expand capabilities in terms of data storage and analytics within the platform, which may be relevant in conditions of poor communication. Components in the platform can be easily replaced without requiring changes to the design and control software. Furthermore, the system can be expanded with new types of sensors and actuators, improving its functionality in this way.
Thanks to the low energy consumption, the platform can be used in various animal grazing conditions. Another important feature is represented by the direct integration with the “Herd Management” software developed in the framework of this project.
In future works, statistical analysis and machine learning algorithms which are useful to determine the exact weight of the monitored animals will be illustrated.
Conflict of Interest
The authors declare no conflict of interest.
Acknowledgment
The present work was performed within the framework of program-targeted funding of the Ministry of Agriculture of the Republic of Kazakhstan, BR06349515 “Transfer and adaptation of innovative technologies for optimizing the production processes in dairy farms of Northern Kazakhstan”.
- Annual Report | Dairy Australia, Jan. 2021.
- Remote WOW Systems | Tru-Test Livestock Management, Jan. 2021.
- Our Platform: Agricultural Analytics – GrowSafe Systems®, Jan. 2021.
- A.S. Camiel Huisma, Animal management system, US6868804B1, 2003.
- BR102017006913A2 – automatic, voluntary weighing system comprising animal and apparatus monitoring and management system – Google Patents, Jan. 2021.
- Intergado Beef – Intergado, Jan. 2021.
- ISO – ISO/IEC 18000-6:2004 – Information technology — Radio frequency identification for item management — Part 6: Parameters for air interface communications at 860 MHz to 960 MHz, Jan. 2021.
- K.V.S. Rao, P. V. Nikitin, S.F. Lam, Antenna design for UHF RFID tags: A review and a practical application, IEEE Transactions on Antennas and Propagation, 53(12), 3870–3876, 2005, doi:10.1109/TAP.2005.859919.
- C.C. Yen, A.E. Gutierrez, D. Veeramani, D. Van Der Weide, “Radar cross-section analysis of backscattering RFID tags,” IEEE Antennas and Wireless Propagation Letters, 6, 279–281, 2007, doi:10.1109/LAWP.2007.898552.
- K. Hongil, L. Bomson, “Meander line RFID tag at UHF band evaluated with radar cross sections,” in Asia-Pacific Microwave Conference Proceedings, APMC, 2005, doi:10.1109/APMC.2005.1606882.
- K. Penttilä, L. Sydänheimo, M. Kivikoski, “Performance development of a high-speed automatic object identification using passive RFID technology,” in Proceedings – IEEE International Conference on Robotics and Automation, Institute of Electrical and Electronics Engineers Inc.: 4864–4868, 2004, doi:10.1109/robot.2004.1302488.
- Y. Gao, Z. Zhang, H. Lu, H. Wang, “Analysis and calculation of read distance in passive backscatter RFID systems,” in LISS 2012 – Proceedings of 2nd International Conference on Logistics, Informatics and Service Science, 905–912, 2013, doi:10.1007/978-3-642-32054-5_126.
- UHF high performance 9dbi circular antenna -RFID antenna-UHF panel antenna–Shenzhen Chafon Technology Co.,Ltd, Jan. 2021.
- A.B. Mirmanov, N.K. Nabiev, A.S. Alimbaev, K.M. Dostanova Experimental studies of the reading range of ear tags UHF RFID system [in Russia: Экспериментальные исследования дальности считывания ушных бирок UHF RFID системы]. Modern Science, 10-1, 434-438, 2020