Comparation of Analytical Models and Review of Numerical Simulation Method for Blast Wave Overpressure Estimation after the Explosion

Adv. Sci. Technol. Eng. Syst. J. 6(1), 748–756 (2021);
 DOI: 10.25046/aj060182
A comparative analysis of formulas for blast wave overpressure is presented in the paper, and models were compared with available experimental data. The Kinney and Shin models show the best agreement with experimental data (Kingery-Bulmash) for free airburst, while for surface burst, Swisdak, Vanuci, and Jeon models predict test data most accurately. One of the novelties in the paper is introduction of new exponential and power functions for blast overpressure estimation, giving good agreement with experimental data. Also, several numerical simulations of free airburst explosions were performed to introduce methodology, and compare the data obtained with experimental data. A detailed description of the procedure for these simulations was provided – a contribution to numerical modeling of blast wave phenomena.
1. Introduction
There has been an increase in the research of explosive blast effects since numerous accidents (ie Beirut, 2020) happened, and terrorist attacks were carried out on civilians, with a large number of casualties during last decades. These include i.e. the bombing of US embassies (Ankara, 1958, Beirut, 1984), World Trade Center attack (New York, 2001), Mumbai attacks (2008), Mariott Hotel attack (Islamabad, 2008), Baghdad bombings (2016), Atatürk Airport attack in Turkey (2016), Nairobi hotel attack (Kenya, 2019), Jolo Cathedral bombings (Philippines, 2019), many attacks in Pakistan (Quetta, 2020) and also in larger area of Afganistan (lately Kabul, Kuz-Kunar, 2020) and many more.
An explosion presents violent release of energy. The detonation presents a rapid chemical reaction proceeding through the explosive charge at supersonic speed. The detonation wave converts explosive into a hot, dense, high-pressure gas, which is the source of powerful blast waves around explosion site (Figure 1).
Pressures at the Chapman-Jouguet point can go up to 400 kbar. Acceleration of the air particles (when the detonation is complete) beyond the face of the explosive is in order of 1011 g. Close to the face of the charge, at near-field scaled distance (where Z=R/m1/3): Z = 0,054 m/kg1/3, the maximal temperature is around 200 000 K. The temperature rises almost instantaneously with the shock front arrival but the maximal temperature occurs at the expanding detonation products front [1].
In this paper, a comparation of analytical methods for blast wave overpressure is presented and compared to experimental data in Section 3. Also, numerical simulations of free airburst explosions were done in Ansys Autodyn for 1 kg, 10 kg, 10 T of TNT, and obtained data were compared with available empirical data, in Section 4. Section 5 presents conclusions.
 Figure 1: Blast wave formation after the explosion [courtesy of Defence Research and Development Canada]
2. Explosion types and blast wave parameters
There are two main groups of blast loads, regarding explosive confinement: unconfined (free air blast explosions), an air burst close to the ground, and surface burst) and confined (fully vented, partially confined, and fully confined). In free air spherical explosions, shock wave moves from the center of the explosion and hits the target with no amplification. Hemispherical explosions are surface explosions where the detonation is close to the ground, and where the incident shockwave is strengthened due to reflections from the ground. As the blast wave propagate, Mach front (Figure 2) can be formed by superposition of the incident and reflected waves [2]. Confined explosion relates to detonation inside structures.
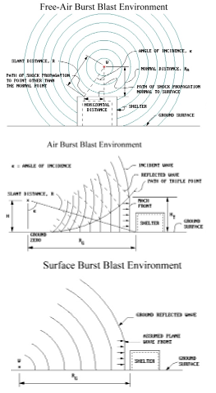 Figure 2: Free-air burst, air burst near ground and surface burst [2]
The pressure wave function in the air is schematicaly shown in Figure 3. There is a rapid rise from ambient pressure to a peak incident overpressure Pso which decays to the ambient value in time to (positive phase duration). The front arrives at a location in time tA. Negative phase (duration to-) is characterized by underpressure Pso-. The incident impulse of the blast wave is the integrated area under the pressure-time curve (marked as is for the positive and is- for the negative phase) [2].
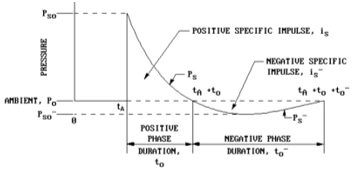 Figure 3: Free-field Pressure-Time variation [2]
In technical manuals [2], the overpressure exponential curve is often replaced by a linear curve. The negative phase is often ignored in structural calculations.
When the blast wave hits the surface, the reflected pressure value can be more than 20 times larger than the incident pressure value [3].
3. Prediction of blast wavefront parameters
A large number of studies were conducted in order to understand better blast effects after the explosion and the response of structures to blast loads. Empirical, semi-empirical, and numerical methods are mostly used for the prediction of blast effects.
Empirical methods are correlations with test data. The accuracy of empirical formula is usually lower for near-field explosions.
Semi-empirical methods are partly based on physical models. These methods rely also on experimental data and their accuracy is usually better than purely empirical methods. They are used in certain blast codes (programs)
Numerical (computational fluid dynamics, CFD) methods are usually the most accurate ones and are based on equations describing basic laws of continuum mechanics (conservation of mass, momentum, and energy). The physical behavior of materials is generaly described by constitutive equations [4].
Many programs such as BLASTX, CTH, SHAMRC, FEFLO, FOIL, DYNA3D, ALE3D, LS-DYNA, Air3D, CONWEP, AUTODYN, ABAQUS, 3D BLAST, SPEED have been developed to numericaly simulate the blast effects (Figure 4) and their load on structures.
Some of these programs (ie AUTODYN) can also be used to model the near-field explosion effects, in order to make new formulas for near-field air-blast estimations, and to update old formulas (ie. for reflection coefficients).
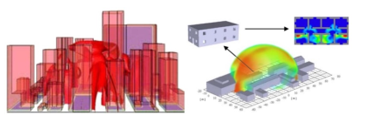 Figure 4: Simulations of shock wave in urban environment (AUTODYN and SPEED programs]
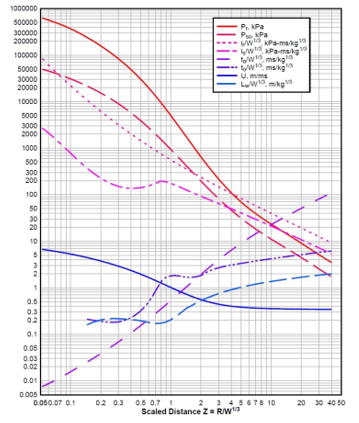 Figure 5: Positive phase parameters for spherical wave (TNT charges) from free-air bursts [4]
 Figure 6: Positive phase parameters of hemispherical wave (TNT) from surface burst [4]
Reference [5] includes formulas for air bursts and surface bursts, for estimation of the values for incident and reflected pressures (and for other parameters as well). The positive phase pressures, impulses, durations, and other parameters of shock environment for free air and surface burst (for TNT) are given in Figs. 5 and 6 versus scaled distance Z (from Z=0,05 m/kg1/3 to Z=40 m/kg1/3).
According to Hopkinson-Cranz law, a dimensional scaled distance Z = R/W1/3, where R is distance from the detonation point, and W is the mass of explosive charge (equivalent to TNT mass). The values of TNT equivalent mass factors can be found in papers and technical manuals.
Using diagrams, to obtain absolute value of particular parameter, their scaled value is multiplied by a W1/3 to take the size of the explosive charge into calculation. Pressure and velocity are not scaled [5].
Calculations for surface burst are more straightforward than for airburst near the ground because of complex wave reflections in the latter case.
High-order polynomial equations functions made using regression analysis of test data [5] are used in the CONWEP.
In CONWEP (utilizes Kingery-Bulmash polynomials), following formula is used for defining P-t curve:
 Here A is decay coefficient, which can be calculated by curve fitting of experimental P(t) curve in positive phase [4]. Besides Eq (1), formulas of Flynn and Etheridge can be used for prediction of positive blast pressure profile.
Automated formulas for surface blast parameters can also be found in programs BECV4 and A.T. – Blast.
Table 1 below shows peak reflected overpressures Pr for surface burst (ie. in Figure 6) with different W-R (mass-distance) combinations. These values can be obtained using polynomial equations, or programs.
Table 1: Peak reflected overpressures Pr for surface burst
| R (m) | Peak reflected overpressures (MPa) | |||
| 100 kg | 500 kg | 1000 kg | 2000 kg | |
| 1 | 165,8 | 354,5 | 464,5 | 602,9 |
| 2,5 | 34,2 | 89,4 | 130,8 | 188,4 |
| 5 | 6,65 | 24,8 | 39,5 | 60,2 |
| 10 | 0,85 | 4,25 | 8,15 | 14,7 |
| 15 | 0,27 | 1,25 | 2,53 | 5,01 |
| 20 | 0,14 | 0,54 | 1,06 | 2,13 |
| 25 | 0,09 | 0,29 | 0,55 | 1,08 |
Experiments have shown that human blast tolerance depends on magnitude of blast wave pressure and the shock duration. Tests showed that the lungs is the critical organ in injuries related to blast waves. The air bubbles release from damaged lung alveoli into the body vascular system accounts for most fatalities. The severe lung-haemorrhage occurs at pressure levels above 5,5 bar, while the lethality due to lung damage is for pressures 6,9 to 8,3 bar, Near 100 per cent deaths are confirmed for pressure levels 13,8 – 17,2 bar. Besides these primary effects of blast on humans, there are secondary (fragments from surrounding structures and buildings collapse), tertiary (blast wave and winds that can sweep people) and quaternary effects (other explosion-related injuries) [6].
Blast effects may damage structures by two main type of loading: diffraction and drag loading. Diffraction loading relates to loading the structure from all sides, where the blast overpressure is applied to sides of the object nearly simultaneously (i.e. on a building oriented towards explosion blast wave would arrive on the front sides and roof at nearly the same time). Ductile targets (i.e. made of metal) can be crushed. Brittle targets (i.e. made of concrete) will most likely shatter. The loading can be estimated from the peak overpressure [7].
Drag loading, related to dynamic pressure, is the force which acts on surfaces perpendicular to the pressure wave. The drag load is less than the diffraction loading, and it is applied for a longer time period. The drag load reverses direction, which can tear objects apart. Flexible targets are not damaged significantly by diffraction loading but can be prone to drag loading injuries. Objects not fixed can be thrown several meters away. Humans are quite vulnerable to this type of loading. Lightly protected equipment can also be damaged by drag loading [7].
Prediction formulas for blast loads on structures can be found in technical manuals.
Table 2 shows expected damage on structures loaded with the blast wave.
Table 2: Expected damage on objects loaded with blast wave [ 8]
| Overpressure (kPa) | Expected damage |
| 1,0 – 1,5 | Window glass cracks |
| 3,4 – 7,6 | Minor damage in some buildings |
| 7,6 – 12,4 | Metal panels deformed |
| 12,4 – 20 | Concrete walls damaged |
| over 34,5 | Wooden buildings demolished |
| 27,6 – 48,3 | Major damage to steel objects |
| 41,4 – 62,1 | Heavy damage to reinforced buildings |
| 69 – 82,7 | Probable demolition of most buildings |
Blast overpressure is the most important parameter in blast effects modelling and many analytical relations can be found in the literature, most of them based on test data at different scaled distances and charge sizes.
The formulas for a free spherical airburst explosion can also be used for surface explosions by increasing the charge mass using the multiplication with a coefficient (reflection factor) 2η, where η takes into account energy used for deformation of the base material, with values ranging from 0,55 for water to 1 for steel.
The formulas for spherical airbursts and hemispherical surface burst blast wave pressure PS, presented by several authors, are given in Tables 3 and 4.
Constants for polynomial formula by Kingery & Bulmash are omitted in Tables 3 and 4 because of space, but they can be found in their original paper [5]. Constants for formula by Jeon are also omitted from Table 4, and can be found in [9].
Table 3: Formulas for spherical airbursts blast wave pressure [10,11]
 Table 4: Formulas for hemispherical surface burst blast wave pressure [10,11,12]
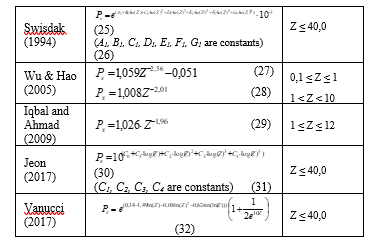
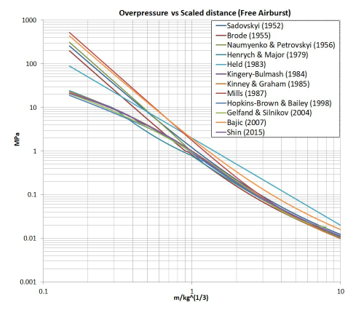 Figure 7: Positive blast wave incident overpressure values (vs. scaled distance) for airburst, obtained using formulas from different models, compared to experimental [5] curve (Kingery-Bulmash polynomials)
In this paper we made comparison of blast overpressures (0,15 < Z < 10) for airburst and surface (hemispherical) burst, using different models (presented in Table 3), and results are shown in Figs. 7 and 8. The experimental data [5] are included for reference as the widely approach for blast parameters prediction. Figure 7 shows most curves deviate from the test data for small scaled distances (ie for Z < 0,4). This may be since some of these equations (Brode, Mills) were developed for nuclear blast.
The Kinney (Eq. 13) and Shin (Eqs. 20 and 21) curves show the best agreement with Kingery-Bulmash data over the whole scaled distance. Figure 8 shows positive blast wave overpressure values for surface burst, obtained using formulas from different models (Table 4), compared to Kingery-Bulmash curve approximating test data.
Swisdak (Eqs. 25 and 26), Vanuci (Eq. 32), and Jeon (Eqs. 30 and 31) predict test data accurately, while other models struggle (i. e. Newmark model, used primarily for nuclear explosions, for scaled distances Z < 0,4).
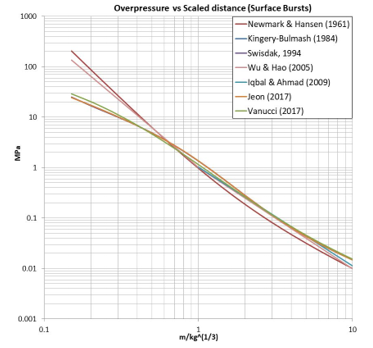 Figure 8: Positive blast wave incident overpressure values (vs scaled distance) for surface burst, obtained using formulas from different models, compared to experimental [5] curve (Kingery-Bulmash polynomials)
In this research, we conducted regression analysis (MatLab CF Tool) of test data [5] by using exponential and power functions, and for scaled distances range of 0,15 < Z < 40. We propose exponential functions for surface burst wave pressure:
![]()
![]() Here, values of constants are: a1 = 0,3078, b1 = -2,054, c1 = -0,2916, d1 = 0,06031, e1 = 0,03571, a2 = 0,906, b2 = -3,514, c2 = 0,757 and d2 = -0,08512. Maximum relative difference between our formula (33) and test data [5] incident overpressure values is 3,3 % (Figure 9), and between formula (34) and test data values is 1,9 %. We propose, as a possible substitute equations, following power functions for hemispherical surface burst wave incident pressure, for different scaled distances:
Here, values of constants are: a1 = 0,3078, b1 = -2,054, c1 = -0,2916, d1 = 0,06031, e1 = 0,03571, a2 = 0,906, b2 = -3,514, c2 = 0,757 and d2 = -0,08512. Maximum relative difference between our formula (33) and test data [5] incident overpressure values is 3,3 % (Figure 9), and between formula (34) and test data values is 1,9 %. We propose, as a possible substitute equations, following power functions for hemispherical surface burst wave incident pressure, for different scaled distances:
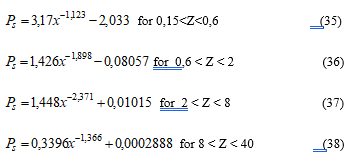 Maximum relative difference between formulas (35-38) and experimental data [5] for incident overpressure values is 3,4 % (Figure 9). Figure 9 presents comparison between our proposed functions and test data [5]. As can be seen, our formulas (33-38) adequately predict incident overpressure values for hemispherical surface burst, for all values of scaled distance (Z < 40).
 Figure 9: Positive blast wave incident overpressure values (vs. scaled distance) for surface burst, obtained using our models (formulas 33-38) compared to test [5] data (Kingery-Bulmash polynomials)
4. Numerical simulations
Numerical simulations of explosions were done in Ansys AUTODYN (version 2019), engineering software package that use finite difference, finite volume, and finite element techniques to solve a wide variety of non-linear problems in solid, fluid, and gas dynamics. This type of program is sometimes referred to as a hydrocode. The phenomena to be studied with such a program can be characterized as time-dependent with geometric nonlinearities (large strains and deformations) and material non-linearities (plasticity, failure, strain-hardening and softening, multiphase equations of state).
When simulating explosions, material properties can be selected from AUTODYN library (Table 5). Air uses Ideal gas equation of state, where the pressure P is related to the energy e (with adiabatic exponent g) as:
![]() This form of an equation is useful for its simplicity and computation ease, where only the value of g needs to be supplied.
This form of an equation is useful for its simplicity and computation ease, where only the value of g needs to be supplied.
For high explosives (i. e. TNT), there are different forms of equations of state (Ideal gas, Constant Beta, Wilkins, Becker-Kistiakowski-Wilson), but the one used in AUTODYN is Jones – Wilkins – Lee (JWL), in the following form:
 The values of the constants A, R1, B, R2 and w from Eq. (40) for some explosives have been estimated from experiments (cylinder test – expansion of a hollow metal cylinder filled with explosive), and are available in AUTODYN material library.
AUTODYN (1D, 2D, 3D) has been verified for use in blast effects estimation in many research papers.
In this research, we give an example of numerical simulation procedure of blast wave formation in the air after the detonation of 1 kg, 10 kg, and 10 T of TNT. Default values for the TNT and air equations of state were used, as well as other parameters specified in AUTODYN library (Table 5).
Table 5: Material properties of TNT and air in simulations (AUTODYN)
| MATERIAL NAME: TNT | MATERIAL NAME: AIR |
| EQUATION OF STATE: JWL (det. products)
Gamma: 1,35 Reference density (g/cm3): 1,63 Parameter A (kPa): 3,7377×10⁸ Parameter B (kPa): 3,7471×10⁶ Parameter R1: 4,15 Parameter R2: 0,9 Parameter w: 0,35 C-J Detonation velocity (m/s): 6,93×10³ C-J Energy/unit volume (kJ/m3): 6,0×10⁶ C-J Pressure (kPa): 2,1×10⁷ |
EQUATION OF STATE: Ideal Gas
Gamma: 1,4 Reference density (g/cm3): 1,225 Pressure shift (kPa): 0 Reference Temperature (K): 288,2 Specific Heat (J/kgK): 717,59 Thermal Conductivity (J/mKs): 0
|
Zones filled with the air were given initial energy of 2,068×105 mJ/mm3 [13] to provide an ambient pressure of 101,3 kPa. A detonation point is located at the center of explosive (0,0,0) to start the explosion at time zero.
Gauge points (for pressure reading, Figure 10) were located at 0,5 m, 1 m, 2 m, 5 m from the detonation point of 1 kg TNT, 1m, 3 m, 6 m, 10 m for 10 kg TNT, and 3 m, 6 m and 9 m for 10 T simulation case. Figure 10: Location od detonation point and gauge points along the mesh
In AUTODYN, the programs’ Euler solver was used in a wedge-shaped grid (1D model) at the apex of which the explosive charge (TNT) was located. For a mass of 1 kg, the explosive radius was 52,7 mm, for 10 kg TNT this radius was 113,56 mm, for 10 T it was 1135,6 mm. Outflow transmitting boundary condition was used to eliminate the wave reflection [13]. In reference [13], cell size values of 3 mm were recommended as a compromise between simulation duration and accuracy, but the results are dependent on the mesh so we used a cell size of 1 mm for comparison with the test data. Reference [1] suggests cell size equal to 0,002 times the distance to the monitoring location on the reflecting surface provided results within 10% of the converged value for 0,0553 ≤ Z < 40 m/kg1/3. The reference [13] suggests quadratic viscosity values of 0,1 which we adopted in our simulations.
As a part of the mesh size sensibility study, we first numerically simulated the blast wave formation after the explosion, with three different mesh sizes (1 mm, 10 mm, and 20 mm, quadrilateral cell size) for 10 kg TNT charge, as an example. Results can be seen in Table 6, and in Fig 11. Table 6 shows that for coarser grid (20 mm) results deviate substantially from experimental data comparing to finer mesh (1 mm).
Table 6: Mesh size sensibility study results for 10 kg of TNT
|
R (m) |
P (MPa) |
Rel. diff. (%) |
||
| PAUTODYN | PEXP [5] | |||
| 1 mm cell | 1 | 4,2715 | 4,4444 | 4,05 |
| 3 | 0,4292 | 0,4420 | 2,98 | |
| 6 | 0,0919 | 0,0951 | 3,48 | |
| 10 | 0,0357 | 0,0355 | 0,56 | |
| 10 mm cell | 1 | 3,9991 | 4,4444 | 11,12 |
| 3 | 0,4019 | 0,4420 | 9,99 | |
| 6 | 0,0890 | 0,0951 | 6,86 | |
| 10 | 0,0353 | 0,0355 | 0,88 | |
| 20 mm cell | 1 | 3,7079 | 4,4444 | 19,86 |
| 3 | 0,3823 | 0,4420 | 15,63 | |
| 6 | 0,0864 | 0,0951 | 10,04 | |
| 10 | 0,0345 | 0,0355 | 3,22 | |
Figure 11 shows mesh size influence on shock wave form at a distance of 1m, after detonation of 10 kg TNT. The coarser the grid, the slower the rate of rise of pressure front and the flatter the curve shape. Peak overpressure values are different for different cell sizes (smaller cell sizes giving larger pressure values).
 Figure 11: Mesh size influence on shock wave form at a distance of 1m, for 10 kg TNT explosive charge
Figure 12 shows the motion of a pressure wave along the mesh during simulation, for the case of 1 kg TNT.
During the simulation, AUTODYN shows rarefaction wave going toward detonation point (explosive charge). It reduces the pressures and density behind the front of the expanding detonation products.
This rarefaction wave, moving inward, is then reflected outward from the centre of the explosive forming, so called, secondary shock wave. Formation of a secondary shock wave, after the detonation of 10 kg explosive charge (TNT) can be seen in Figure 13.
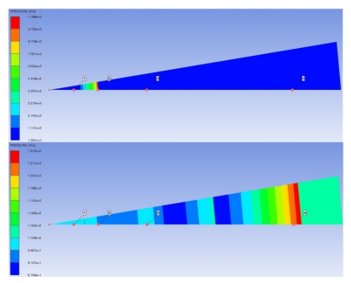 Figure 12: Motion of a pressure wave along the mesh during simulation for 1 kg of TNT
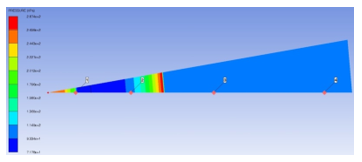 Figure 13: Formation of secondary shock wave (visible close to detonation point on the left) after the explosion of 10 kg TNT charge
AUTODYN can also provide 3D view of mesh by rotation of initial mesh with 360°), as shown in Figure 14.
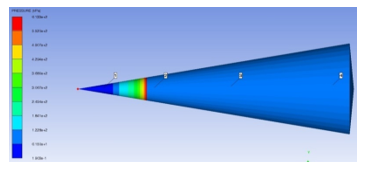 Figure 14: Rotation of initial mesh by 360°
Figure 15 illustrates the wave form P(t), obtained in simulations, at different distances from an explosion, for 1 kg and 10 kg TNT charges.
The second peak on the first (black) curve is likely caused by the blast wave reflection at the material interface (TNT/Air) because of different acoustic impedances of these materials (it should be noted that this second peak is of little practical significance [13]).
We can see from Figure 15 that blast wave pressures drop significantly with distances in air.
Generally, when the blast wave moves through the atmosphere, pressures are rapidly decreased and have a brief existence span, (measured in milliseconds; as shown clearly in Figure 15).
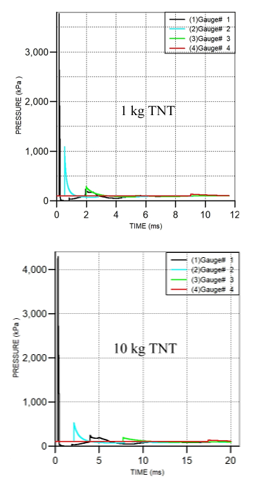 Figure 15: P(t) curves obtained in AUTODYN for 1 kg and 10 kg of TNT at different distances
The results from numerical simulations for 1 kg, 10 kg, and 10 T of TNT explosive charge were compared with experimental data [5], and relative differences presented in Table 7.
Relative differences observed between simulation results and test data were smaller than 5,9 % for all cases for 1 kg TNT, smaller than 4 % for 10 kg TNT, and less than 2,1 % for 10 T charge.
AUTODYN User’s Manual reports of errors around 4% for peak incident overpresure between numerical simulations and test data.
Table 7: Comparison of blast wave overpressure values obtained in numerical simulation (1 mm cell sized mesh) with experimental data [5], for 1 kg, 10 kg, and 10 T of TNT at different distances
|
R (m) |
P (MPa) |
Rel. diff. (%) |
||
| PAUTODYN | PEXP [5] | |||
| 1 kg TNT | 0,5 | 3,6661 | 3,8848 | 5,96 |
| 1 | 0,9897 | 0,9349 | 5,86 | |
| 2 | 0,1843 | 0,1947 | 5,64 | |
| 5 | 0,0318 | 0,0313 | 1,59 | |
| 10 kg TNT | 1 | 4,2715 | 4,4444 | 4,05 |
| 3 | 0,4292 | 0,4420 | 2,98 | |
| 6 | 0,0919 | 0,0951 | 3,48 | |
| 10 | 0,0357 | 0,0355 | 0,56 | |
| 10 T TNT | 3 | 22,2757 | 22,6409 | 1,64 |
| 6 | 9,8847 | 10,0005 | 1,17 | |
| 10 | 4,3524 | 4,4445 | 2,12 | |
As can be seen from the results, AUTODYN can successfully model blast wave formation in the air after the detonation of high explosive. Results from these simulations can be remapped into 3D urban scenario simulation of explosion, which can be follow-up research.
5. Conclusions
In this paper we made a comparation of available formulas for blast wave overpressure. These formulas were compared with available empirical data [5]. The Kinney and Shin models showed the best agreement with experimental data for free airburst, while for surface burst, Swisdak, Vanuci, and Jeon models predicted test data most accurately.
Also, we performed a numerical simulation of airburst detonation after the explosion of TNT charge in Ansys AUTODYN, for the cases of 1 kg, 10 kg, and 10 T of TNT explosive charge, with a fine mesh (1mm), where obtained data were compared with experimental data (Kingery & Bulmash). Relative differences observed between simulation results and test data were smaller than 5,9 % for all cases for 1 kg TNT, smaller than 4 % for 10 kg TNT, and less than 2,1 % for 10 T charge. In this part, we also gave a detailed description of the procedure for these simulations as a valuable tool for blast wave phenomena investigation.
The novelty in the paper is that we introduced new exponential and power functions for surface blast overpressure estimation, with small relative differences compared to experimental data [5]. These formulas, with acceptable accuracy, are somewhat simpler than many of the formulas used for blast overpressure estimation, and can be implemented faster.
The following work in this field can be pointed towards complex geometry urban scenario blast effect modeling, where surface burst effects dominate, with complex reflections of shock wave present.
Conflict of Interest
The authors declare no conflict of interest.
- J. Shin, A.S. Whittaker, A. J. Aref, D. Cormie, “Air-Blast Effects on Civil Structures “, New York, 2014, doi:10.13140/RG.2.1.3454.1686.
- Structures To Resist The Effects Of Accidental Explosions, UFC 3-340-02, Department of Defense, 2008.
- Engineering Design handbook: Explosions in Air, 1st ed., Army Materiel Command, Alexandria, Virginia, 1974.
- V. Karlos, G. Solomos, M. Larcher, “Analysis of blast parameters in the near-field for spherical free-air explosions”, Ispra, Italy, 2016, doi:10.2788/778898.
- C. Kingery and G. Bulmash, Air blast parameters from TNT spherical air burst and hemispherical surface burst, Ballistic Research Laboratories, 1984.
- “Guidelines for Evaluating the Characteristics of Vapor Cloud Explosions”, Flash Fires, and BLEVEs, 2nd ed., Center for Chemical Process Safety, American Institute of Chemical Engineers, New York, USA, 1994, doi:10.1002/9780470938157.
- J. Hall, Principles of Naval Weapons Systems, 1st ed., Kendall/Hunt, 2000.
- Explosive blast, GSA Security Reference Manual – Part 3: Blast Design and Assessment Guidelines, Federal Emergency Management Agency, 2001.
- J. DooJin, K. KiTae, H. SangEul, “Modified Equation of Shock Wave Parameters,” Computation, 5(3), 1–14, 2017, doi:10.3390/computation503004.
- G.F. Kinney, K.J. Graham, Explosive Shocks in Air, Springer, Berlin, Heidelberg, 1985, doi:10.1007/978-3-642-86682-1.
- P. Smith, J. Hetherington, Blast and Ballistic Loading of Structures, 1st ed., CRC Press, London, England, 1994, doi:10.1201/9781482269277.
- P. Vannucci, F. Masi, I. Stefanou, A study on the simulation of blast actions on a monument structure, HAL Archives-Ouvertes, France, 2017.
- T. C. Chapman, M.S. Rose, P.D. Smith, “Blast wave simulation using AUTODYN2D: A parametric study”, International Journal of Impact Engineering, 16(5), 777–787, 1995, doi:10.1016/0734-743X(95)00012-Y.