IoT and Business Intelligence Based Model Design for Liquefied Petroleum Gas (LPG) Distribution Monitoring
 , Ronald Eduardo Tandazo Vanegas, Byron Ivan Punina Cordova
Adv. Sci. Technol. Eng. Syst. J. 9(4), 79–92 (2024);
 DOI: 10.25046/aj090409
Gas leakage caused by various causes poses significant risks to public safety. To address this problem, an intelligent model is proposed for the accurate monitoring of Liquefied Petroleum Gas (LPG) distribution based on the integration of Internet of Things (IoT) and Business Intelli- gence (BI) technologies. Through the use of sensors and actuators, it seeks to mitigate risks and prevent accidents by enabling automated control of devices and infrastructures. The PRISMA methodology was used to perform a systematic review and obtain general characteristics of the components. Then, the proposed model was evaluated according to Y. 4908 which addresses IoT network interoperability, usability and security, the evaluation with 30 IT professionals who examined the BI model. The results obtained by the professionals were encouraging and favorable. The proposal, which enables remote LPG monitoring, establishes service through a website, mobile app or SMS when it detects fluctuations in humidity, temperature and gas indi- cators, shuts off the flow of LPG and notifies immediately. The research led to the development of a model that combines an IoT component with a four-tier BI, demonstrating its effectiveness and acceptance in the professional arena. At the overall medium level, 49% strongly agree, 38% agree, 12% neither agree and 1% disagree. It is concluded that the model has an overall average level of approval of 87%.
1. Introduction
The growing demand for liquefied petroleum gas (LPG) and natural gas leads to an increase in production, so equipment and compo- nents become essential to maintain operability. It is necessary to improve company safety conditions by optimizing control and de- tection techniques for all machinery to ensure its correct operation for the safety of companies and people. Energy demand for heat- ing, manufacturing, household appliances, and vehicle fuel comes mostly from liquefied petroleum gas; gas replaces gasoline or coal because of its environmental advantages [1]. On the other hand, gas dissipation occurs due to various factors, including gas leakage along the distribution line, compromised regulating mechanisms, faulty service joints, and variations in inlet gas pressure, among other contributing elements: gas leaks or leaks cause human haz- ards, economic losses and an increase in greenhouse gases. LPG distribution has no detection or control of gas leaks; it only gener- ates manual reports or complaints from users, which creates large amounts of carbon emissions into the atmosphere [2].
It is known that GAS detection is essential across diverse do- mains, including medicine, industry, environmental studies, and surveillance of confined environments; in the automotive sector, it uses gas sensors in engines to minimize contamination and maxi- mize power, in the treatment and monitoring of gases in hospitals, in mines gas monitoring ensures air quality and avoids harm to people due to lack of oxygen. LPG leaks cause fires, poisoning, and explosions upon combustion; costs are also related to the after- math of gas leaks, such as the destruction of infrastructure, medical expenses, and loss of income [3]. LPG is highly flammable and used in households, vehicles, businesses, and other areas; there are varieties of LPG with propane and butane content; it has an explosive characteristic that poses an imminent risk of fire at any location or during transportation. Negligence and ignorance cause accidents; some implementations use gas sensors and are outdoor solutions for environmental monitoring, chemical processes, fire detection, and air quality. LPG leak accidents cause loss of human and material lives; accidents are indeed few but very dangerous; there are houses or citadels with LPG connections, although they are very few, and there are no post-gas leak detection tasks. It is common knowledge that gas leaks are a serious problem, regardless of the sector related to gas, such as companies, homes, factories, kitchens, and restaurants [4].
As the use of LPG increases, so does the number of accidents caused by LPG explosions; accidents caused by gas leaks increase property damage and fatalities. Some problems are poor quality piping, poorly made pipe joints, substandard gas cylinders, worn regulators, obsolete valves, and improper handling of gas cylin- ders. Other problems are that the leak detection system has certain drawbacks, such as a long response time, a lack of prevention mech- anisms, and the installation of faulty or untested leak detection devices. [5]. In 2022, LPG consumption in Ecuador was 14.4 mil- lion barrels, of which 12.7 million were imported and 1.7 million were produced locally [6]. At the national level, LPG consumption is distributed as follows: domestic is 91%, industrial 7%, agricul- tural 1%, and automotive 1% [7]. It is well known that even the slightest LPG leakage can cause serious damage to people, homes, buildings, or businesses; the safety of people is a major concern. To prevent gas leaks, it is essential to continuously monitor the LPG supply; Internet of Things (IoT) technology can perform sophisti- cated control and monitoring of the supply [8]. IoT for natural gas distribution has shortcomings such as centralized resource manage- ment, lack of data flow between stations, insecurity of transaction information or ledgers, and lack of contract consensus [9]. Poor quality rubber tubing or regulators that do not shut off when unused are two major problems that cause gas leaks [5]. The proposed system has a solenoid valve and an exhaust fan to remove the leaked gas. As mentioned in [1], the system focuses on gas preservation, safety precaution, and accident prevention.
It focuses on a model that can be used in the LPG distribution industry by contributing to continuous monitoring and controlling gas leaks remotely. The model exhibits fast detection and resolu- tion, which ensures safety, reduced leakage, and reduced emissions [2]. The system’s flexibility in accessing devices wirelessly from anywhere in the world means that one of its benefits is lower com- putational cost and energy consumption [10]. Emphasis is placed on the IEEE 802.15.4 standard for wireless communication between routers and sensors, among which the use of a middleware that manages data for the smart devices involved is mentioned [3]. Pro- poses an IoT-based security system that cuts the power supply in smart homes when it detects an LPG leak [4]. The system sends an alarm SMS to the relevant authority if it detects a gas leak; in addition to sending an alarm to the homeowner, the user can ask the web server about the presence of gas [8]. The tool detects leaks with classification in three LPG concentration categories and sends messages via Telegram or buzzers installed in the device [11]. It uses a Wi-Fi network to monitor the gas weight regularly, and a microcontroller to make gas reserves using IoT [12]. Using machine learning to predict data about potential risks on the specific location of pollutants such as CH4, CO, and CO2 in the air and notifies the user [13]. Mobile app for updating the daily rate of gas consumption in households; it also records the real-time weight of the cylinder and books a new one through the proposed mobile app. Turns off the gas regulator when it detects a leak and activates the buzzer [14]. The breakthrough is presented by the voice command used by the customer to turn the gas regulator on and off. The initiative, an intelligent cart, further helps prevent gas weight fraud conducted by agencies [15]. It combines a buzzer alarm, IoT, and Wi-Fi to make a network that receives and transmits data to detect gas leakage in residential and gas distribution locations [16]. It alerts the user via a mobile app about gas leakage and shuts off the cylinder knob when it exceeds a set limit. The app is complemented by a web interface to monitor and place orders with the supplier [17].
The use of devices such as sensors and actuators decreases risks and prevents accidents; IoT accesses automatic control of machines and infrastructure; objects are fed with data generated by sensors and result in intelligent decision-making; IoT is part of air condi- tioning, heating, and ventilation environments that integrate with gas sensors, windows, alarms, gas valves to minimize domestic and industrial accidents [3]. The technologies are used for gas manage- ment in gas metering, gas leakage monitoring, pressure monitoring of gas pipeline networks, and detection of abnormal events [9]. In addition, IoT plays a fundamental and essential role in instrument design, providing all the necessary details and specifications to pro- tect companies or individuals against accidents that flammable gas leaks can cause; also, IoT devices, through the use of sensors, can detect, store and process data from the environment, and the use of sensors has advantages such as reliability, ease of use, flexibility, accuracy, and cost-effectiveness [4].
The objective is to design a general and intelligent tracking- monitoring model based on IoT and BI technology for LPG distribu- tion. The specific objectives are a) to design a general architecture for the control and monitoring of LPG distribution, storage, and use based on IoT and BI technologies; b) to evaluate the IoT network and BI model to determine interoperability, ease of use, and security through Y.4908 Standard and c) to conduct and analyze the survey of IT specialists. This paper proposes a model for an intelligent system in the detection, control, and monitoring of LPG using the Internet of Things (IoT) and Business Intelligence (BI). IoT technology is used to capture gas quantities or gas leaks and send notifications faster; monitoring is remote, which helps in a system to detect LPG leaks in places such as restaurants, homes, or industries and take early prevention measures in case of leakage during transportation or use. BI determines indices (e.g., humidity, temperature, gas level) to monitor and model a data warehouse related to LPG management.
2. Materials
LPG has been produced since 1914. It is a mixture of hydrocarbon gases used in homes and industries. The gas is toxic, colorless, and odorless. It is a fuel for heating, cooking, and vehicles [3]. LPG is available in much of the world to meet domestic requirements and industry needs. It is a mixture of propane and butane, which are very flammable. LPG is heavier than air, and if a person inhales it, then it causes asphyxiation [8]. LPG has ethanol added as a characteristic odor to prevent harmful events and identify leaks at any time or space; it replaces other types of fuel systems in commercial, domes- tic, and industrial areas; it is an explosive gas containing between 1.8% and 9.5% of the volume of gas and air [4].
It is a network system for connecting things via the Internet based on protocols used in data-sensing equipment; it is an ”in- telligent emerging technology” that maintains the interconnection between devices with computing capabilities that are interconnected to the Internet. It is a communication paradigm comprising sensing devices, modules, and microcontrollers that pass digitized data [2]. IoT consists of interconnected networks and people sharing data in- side or outside the environment found in the home, industry, sports, agriculture, transportation, medicine, and environment [10], and allows establishing communication among all to achieve common goals for the people’s interest.
Business intelligence allows optimization and improvement of the quality of business decision-making based on data. BI is com- pared to information compendiums, reporting tools, executive in- formation applications, and corporate consulting because it uses ”business intelligence”; the company’s information is processed and visualized better with the help of BI tools. Within BI, a Data Warehouse (DW) is used, which is the logical design of the data repository and is independent of the database; this DW allows the integration of multiple computer application environments and as- sists the processing of information to generate a single base that consolidates data for analysis purposes [18].
In [2], the author propose to use IoT to detect gas leaks, monitor leakage data, and control those leaks from remote customers with an on-off via mobile applications and the Internet; they use a gas sensor, valve, microcontroller, a database, online update, and relay. In case of gas leakage, the components are activated, alarms are turned on, the leakage status is sent to the gas supplier’s smartphone, and the supplier can shut off the gas valve remotely. In other cases, the gas supplies are shut off automatically if the leakage exceeds the threshold. The paper by [10] proposes a device to detect the leakage of butane or LPG; if the sensor value increases, then an alarm, sound, and lights are activated; also, the sensor reading is dis- played; the gas smoke is revealed by a pattern which is convenient for detection.
The prototype of [3] is a multi-gas smart sensor to prevent acci- dents in innovative environments on carbon monoxide or LPG; the sensor is connected to an IoT environment, and it uses the commu- nication standard to interconnect the data with other smart devices and achieve to make the right decisions.
In [4], the author designed and implemented a prototype gas sensor. If there is a leakage, the sensor sends a signal to the micro- controller. The microcontroller receives and processes the call, and then the relay module shuts off the current supply to avoid sparks or short circuits generated by turning off switches and preventing explosion accidents. The prototype detects changes in LPG concen- tration at a short distance and displays the amount of particles per million (PPM) as an indicator.
In the research, they developed an electronic system to monitor LPG, natural gas, butane, humidity, temperature, and heat indicators through a web server; if there is a gas leak or if a parameter exceeds its threshold value, then an alarm is triggered, and a text message is sent to the authority. The system has sensors, a controller, a web server, and a display showing the sensor value [8].
In [1], they implemented an automated method to detect gas leaks through sensors connected to an alert and command system; the peripheral is effective, simple, low cost, portable, ultralight, and reliable; this helps in the sanitary sector because when there is a gas leak pollution, and waste is minimized, and increases the economy. It uses IoT technology that gets faster responses on LPG sys- tems; this IoT passes alerts on gas leaks to avoid accidents; it uses a microcontroller device, a gas detector, the model activates preven- tive measures by buzzer, has a GSM module, a solenoid valve, a LED light for indication, an air extractor, gas sensor, and a humidity- temperature sensor [5]. The IoT-based system of [11] is developed in four phases: data collection, hardware design, program coding, and system testing; this generates a tool to detect LPG leaks. When detecting anomalies, alert messages are sent by telegrams or buzzers; the system categorizes the concentration of LPG into two categories. The [19] system has a first segment that monitors and a second segment that regulates the smoke and gas output through a con- troller; if the smoke sensor detects a leak, then a signal is emitted to the controller to turn on the exhaust fan then, it also stops the gas flow through the solenoid valve. The display shows the sensor value and a switch turns on the exhaust fan and the valve.
The article by [9] uses Artificial Intelligence (AI), Blockchain, and IoT technologies for a gas architecture in an intelligent city; AI algorithm uses the prediction model for gas production after detecting the change in gas delivery capacity; Blockchain is used to establish a secure transaction scheme, and maintain the buy-sell contract; simulations show the prediction on gas production in real- time and selection of dynamic sales transactional plan. The research of [20] explores BI in the domain of industries in gas refining by identifying and classifying deployment factors in Iran.
The importance and relevance of LPG as an energy source used industrially and domestically stands out by pointing out its use’s characteristics, risks, and safety measures. The potential for efficient management of LPG is observed with the integration of technolo- gies such as IoT and BI, as it is used in the early detection of gas leaks and preventive measures to avoid fatal accidents. The IoT contributes to the interconnection of devices and the generation of data that engages with the power of BI analysis to facilitate decision-making.
Numerous studies reviewed aim to channel alerts concerning elevated CO, CO2, or other relevant indicators to users, regardless of their geographical location. It highlights a global perspective of considerable interest in LPG management at the international level. Indeed, such a perspective illustrates how these technologies are deployed in various scenarios, from homes to industries and smart cities.
This wide range of applications underscores the versatility and heterogeneity of the technological approaches, including artificial intelligence and Blockchain. In this area of research, such techno- logical advances play a critical role in amplifying safety, optimizing efficiency levels, and raising quality standards in LPG administra- tion in various application areas.
3. Methodology
The methodology in this article explains the details of achieving and developing the specific objectives. Analyze scientific articles to learn about other IoT and BI models through a systematic literature review. The systematic review attached to the PRISMA statement of [21] is used, which has three phases, see Figure 1:
- Identification of studies: it is based on a search in one or sev- eral library databases; IEEE, ACM Digital Library, and Web of Science are considered; peer-reviewed articles are used. Mendeley software is used to eliminate duplicate articles. The filtering keywords are IoT, Business Intelligence, and LPG.;
- Eligibility criteria: It is necessary to define the types of stud- ies that could be considered for this study. The inclusion criteria for eligibility are as follows: The article is It is Written in English. The Content is on IoT or Business Intelligence in LPG management. The exclusion criteria are as follows: The article is younger than 2018. It is in a lan- guage other than English. It is an Abstract article. It is a Paid article.
The following research questions (PI) are defined:
- PI1: In which scenarios is IoT used (e.g., industry, household, housing estates, distribution, supplier)?
- PI2: What devices are used in LPG monitoring (e.g., sensors, microcontrollers, buzzers)?
- PI3: What other components are used (e.g., server, web application, mobile application)?
- PI4: Are other technologies used for LPG monitoring (e.g., Blockchain, AI, Big Data)?
- PI5: What is monitored (e.g., gas leakage, transport, pipelines)?
- PI6: What is the result of the research (e.g., design, implementation)?
- PI7: What gases are monitored (e.g., LPG, natural gas, butane, carbon monoxide, nitrogen dioxide, sulfur diox- ide)?
- PI8: What data are detected (e.g., humidity, temperature, heat indicator)?
- PI9: What protocols are used (e.g. IEEE, 6LoWPAN, MQTT)?
- PI10: What indicators are displayed (e.g., humidity, temperature, gas level)?
- PI11: What software tools are used in Business Intelli- gence?
- PI12: What general data do the data warehouses have?
3. Data collection and synthesis: Data covering the identified ar- ticles are extracted, the research questions are answered, and data analysis is performed in quantitative form and described for explanation. The study uses a quantitative approach.

Based on IoT and BI technologies, a comprehensive architec- ture is designed for LPG distribution, storage, use, control, and monitoring. The architecture covers LPG plant storage, pipeline or transport distribution, and use in homes or businesses. The ar- chitecture design is based on analytical research that studies the feasibility of a measure through empirical evidence. The qualitative approach describes all the architecture details, such as participants, components, software, hardware, networks, and indicators. The architecture graph is presented. The Y. 4908 and a survey of IT specialists are used to evaluate the IoT network and BI model for interoperability, usability, and security. The Y.4908 standard evalu- ates the IoT network’s interoperability, usability, and security; see Table 1.
Table 1: Evaluation factors.
 The survey technique is used with a specific group of at least 30 professionals in Information Technology, Information Systems, or Computer Science. Some of the questions are: a) The BI model presents the origins of the data, b) The Data Warehouse model is presented, c) The ETL is presented, d) The names of the indicators are presented, e) The names of the reports are presented. f) The software named is appropriate. and g) The DW contains dimensions and facts.
4. Results
4.1. Analysis of scientific articles using a systematic review of the literature.
The articles selected through the PRISMA methodology are con- sidered. Figure 2 presents the flowchart on the themes identified, reviewed, and set. After the initial search in IEEE, ACM Digital Li- brary, and Web of Science library databases with the keywords ”IoT” or ”Business Intelligence,” 148 articles were identified. After elim- inating duplicates, illegible, and removed for other reasons, these were reduced to 113 pieces. A further 11 articles were excluded due to their title and abstract needing to fall into the eligibility criteria; this led to 102 articles being sought for retrieval. The articles were then reviewed for IoT and Business Intelligence descriptions or models. Exclusion criteria are applied sequentially according to age, article type, or payment; otherwise, the evaluation is continued. Other exclusion items are articles that mention the term IoT or BI but do not apply it; articles that mention IoT or BI in general and not as results; articles that do not demonstrate the influence of IoT or BI; and articles that are only concepts in total are 35. In the end, 40 papers were selected for analysis, as shown in Figure 2; all these articles are in the Reference section, and the complete list is in Table 2.
Table 2: Classified and selected papers.
| Year | Papers | No |
| 2019 | [3, 12, 14, 20, 22, 23, 24, 25, 26] | 9 |
| 2020 | [8, 27, 28, 29, 30] | 5 |
| 2021 | [2, 4, 9, 10, 11, 17, 19, 31, 32, 33, 34, 35] | 12 |
| 2022 | [36, 37, 38, 39, 40] | 5 |
| 2023 | [1, 5, 15, 16, 41, 42, 43, 44, 45] | 9 |
| Source: Carried out by authors. |

The selection process for the peer-reviewed articles published in English between 2019 and 2020 was meticulous. The increased academic interest in this area can be attributed to the burgeoning number of urban platforms worldwide. As part of the eligibility criteria, each article described at least one urban crowdsourcing platform, with some even going beyond and mentioning multiple platforms. This comprehensive approach ensures that the selected articles hold significant value for our research.
Among the 40 meticulously selected articles, only 23 present models or architectures on IoT or Business Intelligence applied in LPG control; others present technology or alternatives for gas tank control. Each of the 40 articles is thoroughly reviewed to ensure it contains a property that falls into the following groups: IoT sce- narios, Monitoring devices, Other components, Other technologies, Control, Research results, Gases they monitor, Data they detect, Protocols used, Indicators they show, Business Intelligence soft- ware, Data from Data Warehouse. This rigorous review process guarantees the validity and reliability of our research findings.
Each item is reviewed, and the properties of each item are as fol- lows: item, year of production, item title, country of origin, and num- ber of references. In addition, the IoT Scenarios segment has prop- erties in the industry, home, distribution, and supplier sectors. The monitoring devices segment has the following properties: Sensors, microcontrollers, buzzers, valves, relays, Fans, displays, and LEDs. The segment has other components with properties: Server, web application, mobile application, database, GSM, and GPS. The seg- ment includes other technologies with properties such as blockchain, artificial intelligence, and business intelligence. The Control seg- ment has properties: Gas Leakage, Transportation, Pipelines, and Weight. The Research Result segment has Design, Implementa- tion, and Prototype properties. The segment Gases Monitoring has properties: LPG, Natural Gas, Butane, Carbon Monoxide, Nitrogen Dioxide, Alcohol, Oxygen, Propane, Hydrogen, and Methane. The segment data they detect has properties such as humidity, tempera- ture, smoke, fire, and gas—the segment Protocols used with proper- ties: IEEE, 6LoWPAN, MQTT, TCP. The segment Indicators show the properties: Humidity, Temperature, Gas level, Smoke, Heat, and Cylinder status. Business Intelligence Software has properties such as BLYNK, Excel, and PowerBI. The Data Warehouse Data segment has weight, voltage, and level properties. Table 1 shows the 40 items analyzed and used to answer the research questions (PI).
4.2. Answer to the research questions.
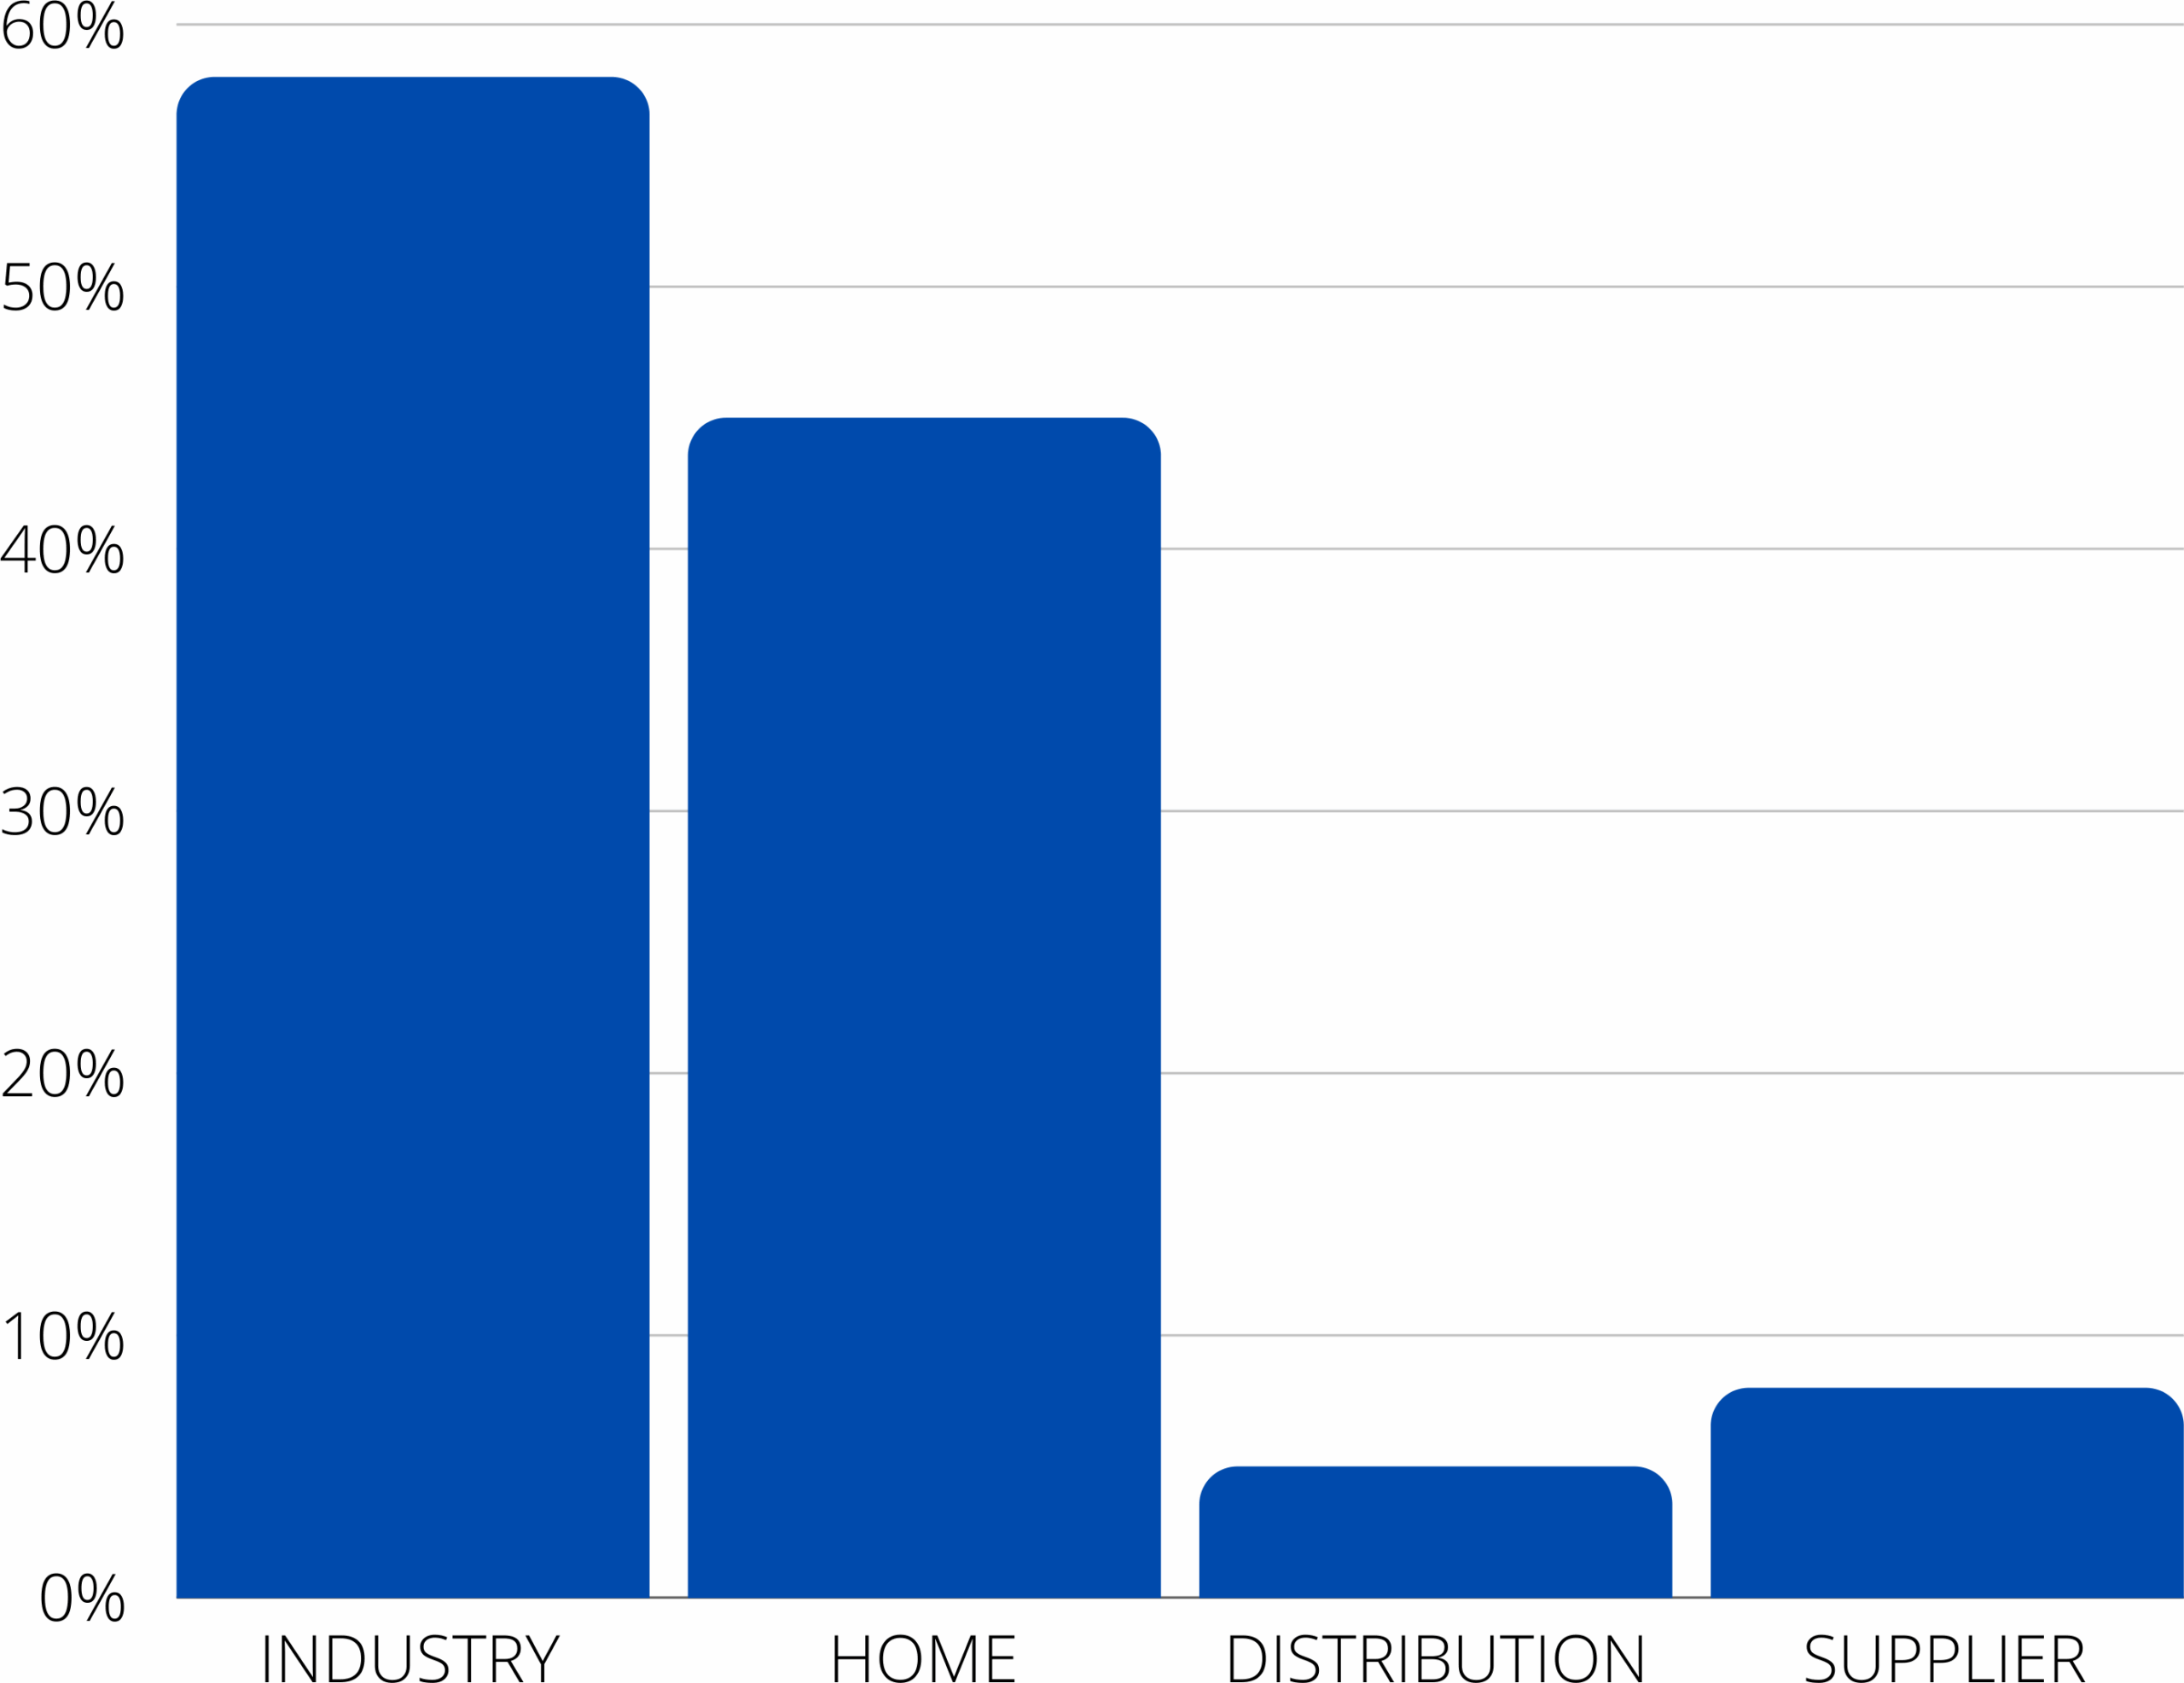
PI01: In which scenarios is IoT used?
According to the analysis of the 40 papers, 58% of the proposals are for industry, 45% are for homes, 5% are for management in gas distribution, and 8% are suggestions for gas suppliers. Conversely, 12% specify industry and household, i.e., five things. See Figure 3 Scenarios.
PI02: What devices are used in LPG monitoring?
According to the analysis of the 40 papers, 88% use sensors, 83% use microcontroller cards, 48% use buzzers to alert, 55% use valves to close the tank, 55% of the documents use a relay to activate the valves; 23% of the items use a fan to dissipate the gas; 55% use a display to show the status or quantity; 40% use a LED light to alert of gas leakage. On the other hand, 83% use sensors and microcon- trollers, i.e., 33 items. Another 33% use LED with relay and valve as prevention and warning, i.e., 13 papers. In addition, 48% that use buzzers to alert are among the 83% that use microcontrollers and sensors, i.e., 19 items. The buzzer, fan, and LED are linked to the microcontroller. See Figure 4 Devices.

PI03: What other components are used?
According to the analysis of the 40 papers, 48% use or have an application server, 30% have a web application, 58% use a mobile application, 33% use a database, 40% use GSM to send text mes- sages, 8% use GPS for gas leak positioning. The tendency to use mobile applications remains high, as does using GSM to send sim- ple text messages because they are very efficient for communication. GPS communication is rarely used because of the monthly costs providers charge for this service. On the other hand, databases are used by web applications or mobile applications; GSM modules may or may not be integrated into the microcontroller card. Web applications are linked to a server. See Figure 5 Other components.
PI04: Are other technologies used for LPG monitoring?
According to the analysis of the 40 papers, 3% use Blockchain to maintain information security in encrypted form and maintain trace- ability/tracking in gas distribution; 8% use Artificial Intelligence for possible predictions in gas leakage; 13% use Business Intelligence to generate reporting or control indicators. On the other hand, the same article that proposes to use Blockchain also uses Artificial Intelligence. There is no overlap in using Business Intelligence with other technologies. See Figure 6 Other technologies.


PI05: What is controlled?
According to the analysis of the 40 papers, 73% propose controlling gas leakage, 3% offer governing gas transportation, 15% propose controlling gas pipelines, and 15% suggest controlling LPG tank weight. However, only some of the articles submit gas leakage control. The papers that work on Business Intelligence only obtain data from files generated by sensors, and others are only theoretical articles. On the other hand, 13% of control pipelines are within the 73% gas leakage control, i.e., five pieces. In addition, only one paper proposes a rule during the gas transport process. See Figure 7 Control.

PI06: Research results?
According to the analysis of the 40 papers, 83% present as a re- sult of the network design or device design; 23% performed the implementation and use of their plans; 58% achieved a prototype to demonstrate their theories on device design in gas leakage control or LPG cylinder weight. On the other hand, two papers should have presented the method and implementation. The rest of the articles that were designed were also implemented. All the documents with prototypes did give their design, and all the prototypes presented photos of their work. See Figure 8 Results.

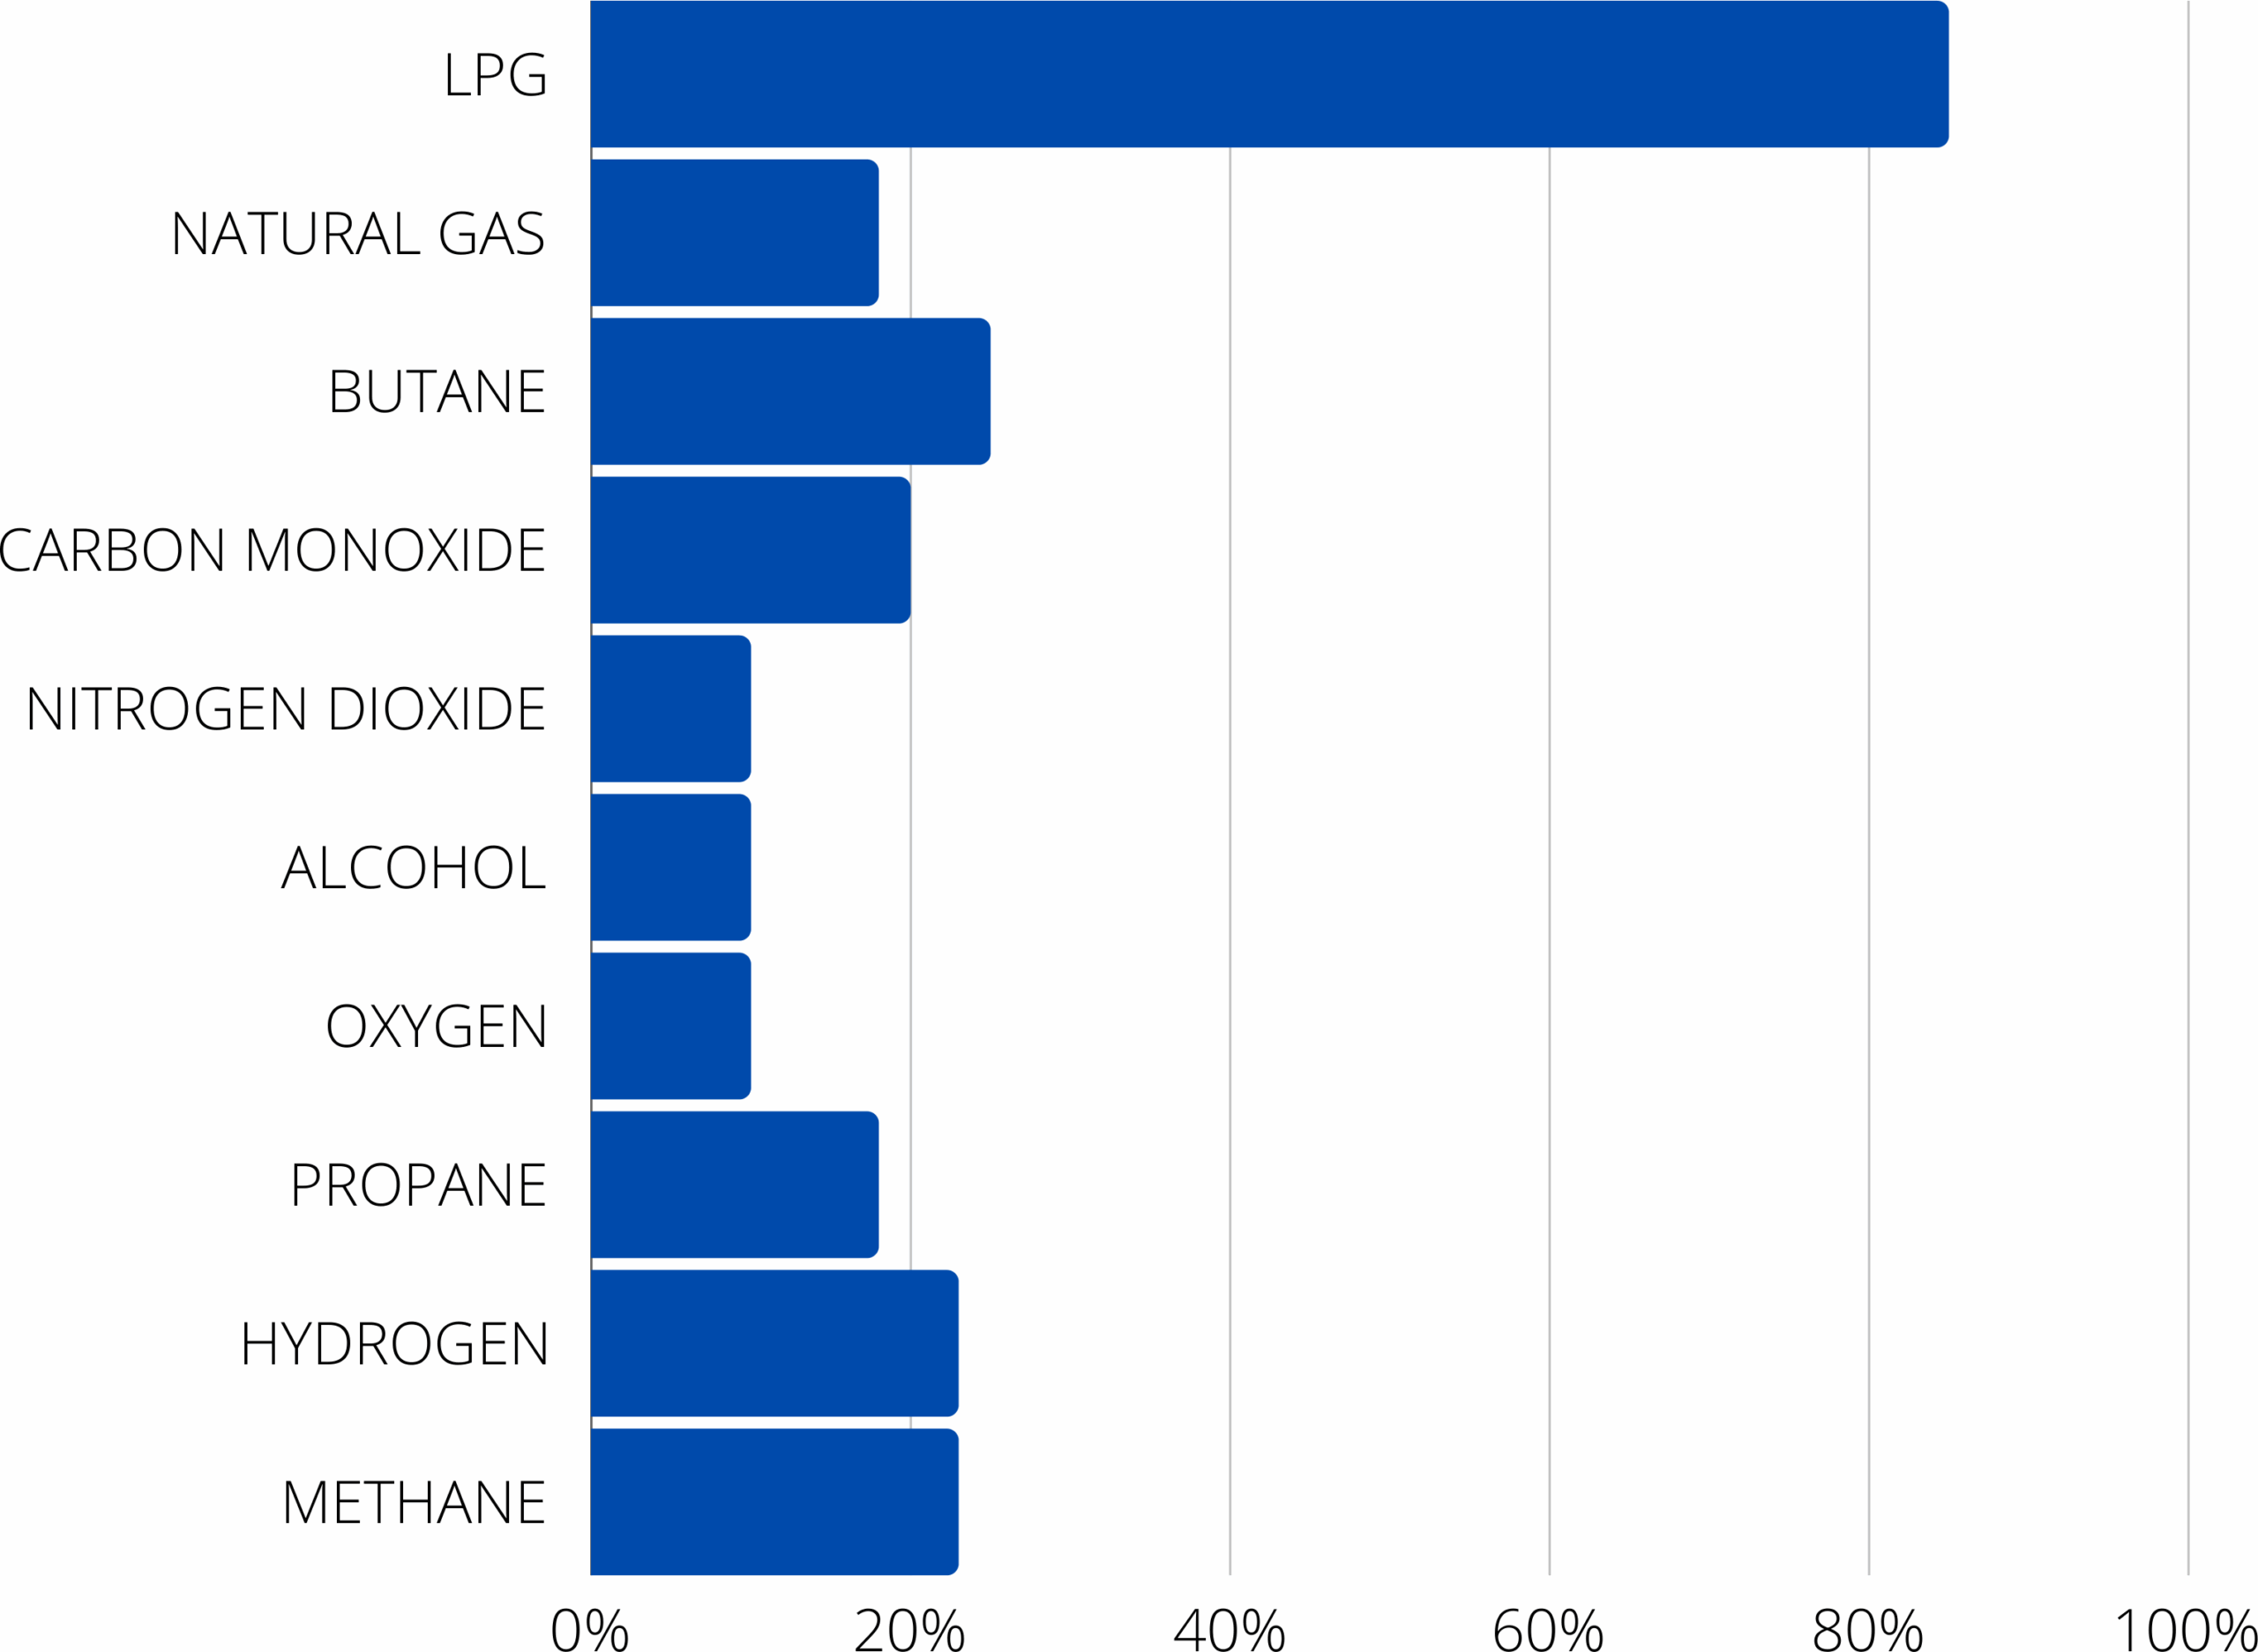
PI07: What gases are monitored?
According to the analysis of the 40 papers, 85% monitor LPG from home or industry, 18% monitor Natural Gas, 25% monitor Butane, 20% monitor Carbon Monoxide, 10% monitor Nitrogen Dioxide, 10% monitor Alcohol, 10% monitor Oxygen; 18% monitor Propane; 23% monitor Hydrogen; 23% monitor Methane. On the other hand, 8% of natural gas monitoring is within LPG monitoring, i.e., three items. The other four items only monitor Natural Gas. All the articles monitoring Butane are within LPG monitoring, i.e., ten articles. The 18% that watch Carbon Monoxide is within the LPG monitoring, i.e., seven items. Items monitoring Nitrogen Dioxide, Alcohol, and Oxygen are within LPG monitoring, i.e., four items each. The things that observe Propane, Hydrogen, and Methane are within LPG monitoring. This happens because there are sensors that can detect few or many gases; the sensors used in the items are MQ2, MQ3, MQ4, MQ5, and MQ6. If the number is higher, then more gases can be detected. See Figure 9.
PI08: What data is detected?
According to the analysis of the 40 papers, 15% present designs that detect humidity, and 15% detect temperature; 10% of the designs detect smoke; 8% of the methods detect fire; 88% of the designs detect gas, either by gas leakage in cylinder or pipe leakage. On the other hand, the techniques that detect humidity and temperature are among the 88% that detect gas. The designs that detect smoke or fire are within 88% that detect gas. See Figure 10. Data detected.

PI09: What protocols are used?
According to the analysis of the 40 papers, 43% name or use the IEEE protocol in their implementations or prototypes; 5% name or use the 6LowPan protocol in their designs; 8% name or use the MQTT protocol in their designs; 25% name or use the TCP protocol. On the other hand, 10% of the articles used any of these protocols in implementation, i.e., four papers. 38% of the documents used protocols in prototypes, i.e., 15 pieces. The 25% of the TCP articles are within the 43% using IEEE. See Figure 11 Protocols.

PI10: What indicators are shown?
According to the analysis of the 40 papers, 13% show the humidity, 10% indicate the temperature, 73% offer the gas level, 8% show the smoke level, 3% show the heat level, and 25% show the bottle status. On the other hand, humidity, temperature, and gas levels are shown on the display in 10% of the items, i.e., in 4 pieces. In 8% of the items, i.e., three things, gas, and smoke levels are displayed on the screen. Only one report shows humidity, temperature, gas level, smoke, and heat as indicators. Only one article shows humidity, temperature, gas level, and smoke as indicators. Only one item presents humidity, temperature, and gas level as indicators. See Figure 12 Indicators.

PI11: What software tools are used in Business Intelligence?
According to the analysis of the 40 papers, 15% of the 40 articles use Blynk, 5% use Microsoft Excel, and 5% use Microsoft Power BI. On the other hand, only one piece uses Excel and Power BI; the other articles use these tools independently. See Figure 13 BI software. Blynk is used to connect IoT devices, assist in the visu- alization of sensor data, execute remote control with mobile web applications, perform firmware updates, and offer a secure cloud, user and access management, and alerts, among others. In addi- tion, this platform promotes smart home hardware manufacturers [46]. Microsoft Power BI generates simple data sets with many data sources or origins, is also simple for aggregation to the Power-BI data connectivity hub, and generates a centralized, single, effective, and accessible source of information for data from multiple devices [47].

PI12: What general data does the Data Warehouse have?
According to the analysis of the 40 papers, 8% show the weight in the DW, 8% show the voltage in the DW, and 10% indicate the gas level in the DW. On the other hand, 8% of the articles present the weight and voltage together, i.e., in 3 pieces. The 10% of the items showing the gas level do not have any DW data in common with the other 8%. See Figure 14 for the DW data.

4.3. Design of a general architecture for LPG manage- ment based on IoT and BI.
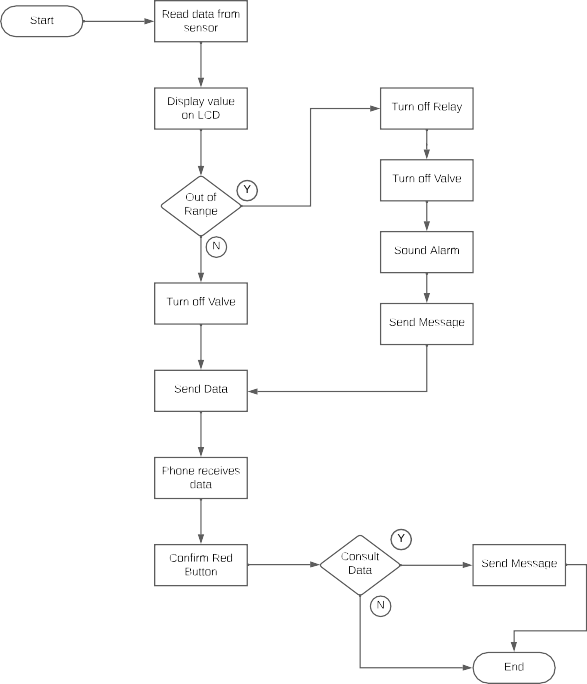
In the event of a gas leak, the Gas Sensor detects the strength of the leak and sends the data to the microcontroller. This microcontroller takes that data takes it and sends it to a Firebase database in real- time via the Wi-Fi router and the Internet. The Firebase database sends the data to the smartphone via the Internet. In addition, GSM communication can be added to send text messages and an audible alarm on-site. The leak volume is displayed on the LCD screen and the smartphone. There is a predefined threshold of 500 PPM; if the leak volume is less than 500 PPM, the relay and solenoid valve are turned on, letting the gas pass through the pipeline. If the leak volume is more significant than 500 PPM or if pressing the RED toggle button on the smartphone, then a control signal is sent from the smartphone to the microcontroller via the Firebase database; this action turns off the relay and solenoid valve to not let gas pass through the pipeline.
Components:
- MQ-5 gas Detects LPG and natural gas with excellent accuracy. Obtains the presence of gas with a concentration from 2000 PPM (Parts Per Million) up to 10000 PPM and operates with 5 volts of power.
- MQ-6 gas sensor. It detects the presence of LPG. It is an analog sensor based on It obtains the presence of gas with a concentration from 200 PPM to 10000 PPM.
- Temperature and humidity sensor. The DHT11 digital sen- sor is a low-cost sensor that measures air temperature and humidity. It can measure temperature from 0 to 500 °C with an accuracy of ±2 °C and humidity from 20 to 80% with an accuracy of 5%. It consumes power from 3 to 5 volts and draws a current of up to 2.5 milliamps while reading data.
- The 16cm x 2cm liquid crystal display is connected to the NodeMCU via I2C communication protocol. The LCDs the data obtained by the sensors, such as humidity, tempera- ture, and gas status, in real-time on-site.
- NodeMCU DEVKIT 0. NodeMCU is open-source firmware for the IoT platform. This hardware is a microcontroller unit with a wifi chip. It is an excellent low-cost option for sending data to a web server, LCD, GSM, and relay. This control unit takes the data obtained by the sensors. After analyzing the sensor data, this microcontroller executes the appropriate actions.
- Audible The buzzer is added to notice nearby people. If the sensor detects the presence of gas in the air, then the NodeMCU activates the audible alarm.
- GSM modem (SIM800L). This hardware connects to the NodeMCU to send and receive text messages (SMS). The modem incorporates a SIM card as necessitates a subscription with a designated mobile operator, specifically one denoted by the identifier. Upon detection by the sensor of either gas presence or value exceeding predetermined If the sensor detects the presence of gas or out-of-range value, then the microcontroller sends an automatic notification to a cell phone number about the gas leak. In addition, it is possible to query the status of the gas leak by SMS remotely.
- It is a device that operates the solenoid valve.
- Solenoid valve: This device controls gas leakage; it turns on or off through the relay module according to the signal from the microcontroller.
- Wifi It is a wifi router device for Internet connection.
- Smartphone: This is a control unit. It can access mobile ap- plications on the solenoid valve and remotely turn it on or off.
- Google Firebase is a platform for storing and processing leakage data. This database sends the data from the micro- controller to the mobile applications in real time.
- Arduino IDE and C++ The microcontrollers are programmed in Arduino IDE and C++ programming lan- guage.
The utilization of MQ-5 and MQ-6 gas sensors presents a judi- cious approach to detecting combustible gases, including LPG, and their concentration within the ambient environment. Concurrently, temperature and humidity assessment is paramount in elucidating the heat index. Integration of these sensors with the Node MCU microcontroller facilitates an exploration of potential accident sce- narios. The sensors transmit pertinent data to the microcontroller upon gas leakage detection and quantification of its volume in PPM units. Subsequently, the microcontroller undertakes a meticulous verification process, scrutinizing the received data against prede- fined thresholds. Should the measured leakage value surpass the threshold of 500 PPM, an automated shutdown mechanism for the solenoid valve is activated. See Figure 15.
The web application presents the important index values (gas percentage, heat index, humidity, smoke presence, and temperature). In the web application, you can understand the gas leakage situation or the normal state, and it is unnecessary to understand the sensor values. If there is a gas leak, an alarm is generated on-site, and an SMS text message is sent to minimize the possibility of an accident. The GSM module allows a message to be sent for the presence of gas or other out-of-range sensor values, and it is possible to query the current sensor values. The smartphone receives the data from the server via the mobile application. In addition, the on/off interface is displayed. If the leak volume exceeds 500 PPM, you must press the shutdown button (RED) on the smartphone to control the gas leak. The command data is transmitted to the microcontroller via the Internet database. The solenoid valve can be opened via the GREEN button on the smartphone. See Figure 16.

The Business Intelligence part [48] takes the source data from the database in the cloud; in this database are the measurements of all the sensors in the LPG distribution network, i.e., humidity, temperature, and particles per million in each fraction of time. Other data that exist are transport, time, and quantity. It is recommended to use Microsoft Power BI Desktop (PowerBI, 2023) because it is very intuitive.
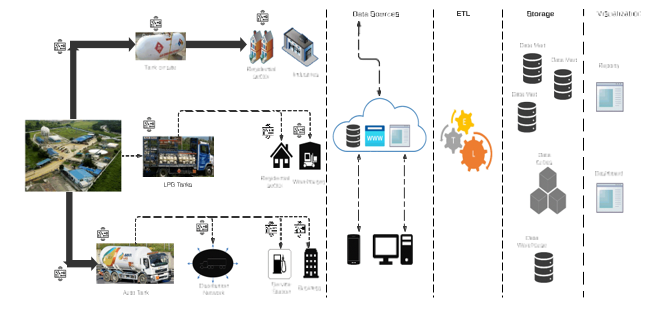
The BI model has four levels; Figure 17 represents the model based on IoT and BI.
- Data Source: This is the Firebase in the The database contains the Sensors table with column identification, series, sensor name, location, start date, and status. The Measure- ments table has columns such as sensor, humidity level, tem- perature level, PPM level, date, and time.
- ETL: There is the ETL process (Extraction-Transformation- Load); here, the Power BI tool performs the validation, clean- ing, transformation, and aggregation of the data and then performs the load to the Data Mart. In this case, the source data belongs to a single database; the data is homogeneous in the extraction; the extraction is performed every hour or according to the Power BI configuration; in the data cleans- ing, unnecessary data is discarded. Data is considered valid because it is in a database; data such as sensor series and start date are discarded in data The cleaned data is loaded into the Data Warehouse, and the data belonging to the Facts table is loaded into the Power BI tool.
- Storage: There is the datamart, the data warehouse, and the cube; remember that the source database comprises two- dimensional tables or straightforward data. The Power BI tool obtains this multidimensional data on the sensors. A multifaceted analysis allows thinking, reducing confusion, avoiding lousy perspectives, and seeing from another angle and other facets.
- Visualization: This BI results in view contains dashboard sorts; the previous steps could be performed in the Power- BIPower BI.
The Data Warehouse gets the data from the IoT network; from this IoT, it receives the humidity, temperature, and PPM data, which are stored in the database in the cloud. In the database are other data such as city names, province names, sensors names, microcon- trollers lists, gas supplies lists, threshold parameters by gas type, daily sensor activities, customer list supply lists, and customer ser- vices lists. The lists become the dimensions of the DW; the facts are the technical and daily indicators. The technical indicators help to track the LPG dispatch. The daily hands keep the history of the sensors to perform averaging and presentation of carvings on the dashboard. Data model in star type for facts and dimensions is shown in Figure 18.

The reports that the dashboard can present are a list of alarms by city, a list of thresholds, a list of technical indicators, a list of active microcontrollers, and a list of sensors. Microsoft Power-BI is recommended for implementation, and the information can be exported to a spreadsheet.
4.4. Evaluate the IoT network and BI model using the Y.4908 Standard and the IT specialist survey.
Standard Y.4908 (ITU-T, 2020) is used to evaluate the IoT network’s interoperability, usability, and security; this task was performed by three professionals who participated in the same survey. All three agreed on the answers in the table of evaluation factors about the IoT network. They answered Yes on: List of Network interoperability devices, List of Network interoperability systems, List of Data inter- operability devices, List of Data interoperability systems, and List of Services interoperability devices. They answered No on the Ser- vice Interoperability Systems List. Dividing 100% for six answers gives 16.66% for each answer. The three professionals answered five questions in the affirmative, i.e., a percentage of 83.33% was obtained. This means the IoT network has an outstanding approval because it exceeds 80%. See Table 3.
The survey was administered to 30 Information Technology, Sys- tems, or Computer Science professionals. Ten questions with Likert scale responses were asked for the study, which is ”1. Strongly agree”, ”2. Agree”, ”3. Neither agree nor disagree”, ”4. Disagree” and ”5. Strongly disagree”, used in [49].
If the percentages of ”1. Strongly agree” and ”2. Agree” are added together, it is assumed that both groups of people agree on the answer. Survey analysis: In question 1, 87% of the professionals agree that the model presents the data origins of IoT sensors, and 13% disagree. In question 2, 80% of the professionals agree that the article presents the DW model, and 20% disagree. In question 3, 70% of the professionals agree that the model does give the ETL, and 30% disagree. In question 4, 93% of the professionals agree that the research does present the indicators, and 7% have no opinion. In question 5, 94% of the professionals agree that the study shows only the reports’ names and 7% do not know. In question 6, 87% of the professionals agree that using Microsoft Power-BI is appropriate, and 13% do not agree. In question 7, 87% of the professionals agree on the dimensions and facts presented in the model, and 13% do not agree. In question 8, 94% of the professionals agree that the indicators presented or named are appropriate, and 6% do not agree. In question 9, 80% of the professionals agree that the model pro- motes decision-making, and 20% do not agree. In question 10, 94% of the professionals agree that the model presented is transparent, and 6% do not agree. At the overall average level, 49% completely agree with the answers, 38% agree, 12% neither agree nor disagree, and 1% disagree. In other words, the model has an overall average approval rating of 87%.
Table 3: Evaluation factors.

5. Discussion
The proposed model has been designed to detect Liquefied Petroleum Gas (LPG) leaks and automatically activate a supply cut to prevent potential accidents. However, its capabilities could be strengthened by integrating IoT devices for accurate detection and more efficient management.
This proposal simplifies the process of monitoring and detecting LPG leaks through the adoption of IoT technology. The devised model notifies users about gas leak incidents through multiple communication channels: on-site audible alarms, text messages, an up-to-date web app, historical data, and a web app. Observation and management can be carried out remotely and effectively, even allowing the control of IoT devices through a web server or mo- bile device. Although a financial estimate is omitted, IoT devices’ effectiveness and low cost in the research area are highlighted.
The eventual implementation of this model could be highly ben- eficial to the authorities in monitoring gas leak levels in critical areas, which makes it possible to issue immediate alerts to the pub- lic and prevent accidents, thus contributing to public safety. The gas sensors can detect various gases, fuels, and alterations in oxygen consumption, making it easy to take early leak containment mea- sures. In the same way, it is emphasized that the implementation of the system could be effective both in locations near and distant from the base station, thus demonstrating the versatility and ease of use of the model in various environments. This contributes to the improvement in efficiency and response capacity in emergencies.
From the performance demonstrated in the research, the remark- able effectiveness of the proposed design in detecting LPG leaks is inferred. This is shown by integrating knowledge extracted from the literature, which gives the model considerable robustness. It is pertinent to highlight that this model benefits the industry and the commercial and residential sectors from gas distribution by offering an effective tool to prevent accidents and protect people’s integrity. Detailed analysis of the 40 selected articles reveals characteristic patterns in the application and design of similar systems. Notably, 58% of the articles focused on industrial applications, while 88% used sensors as an integral part of the submitted design. In addition, 58% of the studies implemented a mobile application to improve the system’s accessibility and usability. The findings suggest a trend toward the integration of mobile technologies.
A significant portion of articles (approximately 73%) proposed specific measures for controlling gas leaks, and the majority (approx- imately 83%) presented results related to designing infrastructures or devices for this purpose. This data underscores the importance of actively addressing the detection and management of gas leaks in do- mestic and industrial settings. It is also highlighted that most studies (85%) have focused on LPG monitoring in residential or industrial contexts, suggesting a practical and relevant approach to gas supply security. A significant proportion of the articles (88%) focused on gas detection in cylinders or pipes, reflecting the importance of proactively identifying and mitigating leaks.
Finally, the IEEE protocol was mentioned or used in 43% of the articles reviewed, indicating a trend toward standardization and interoperability in this field. In addition, a small percentage of the studies (15%) used Blynk software for business intelligence, indi- cating a growing interest in data visualization and analysis to guide decision-making in this area.
The present research provides significant value in detecting LPG leaks in various contexts, such as industry, businesses, and private households. It stands out for its importance in accident prevention and protecting lives.
6. Conclusions
The proposed model that combines IoT with BI offers a solution for the real-time detection of LPG leaks during the distribution of this element to industries, businesses, or homes, helping to avoid fatal ac- cidents. This approach seeks to manage gas distribution effectively and promotes the automation of facilities to safeguard the safety of individuals and the community in their environment while reducing carbon emissions and optimizing energy consumption. The con- struction of the architecture was based on the exhaustive analysis of the literature review achieved through the PRISMA Declaration. Standard Y. 4908 was used to assess interoperability, ease of use, and security. It should be noted that Information Technology pro- fessionals completed this last element. The sensors used to detect LPG and natural gas, in addition to temperature and humidity sen- sors, can respond to the variation of low temperatures, which helps achieve a better process in the detection of gas. The collection of data in the cloud, generated by the IoT network, such as transporta- tion, time, and quantity, translates into dynamic two-dimensional visualizations through BI technology that simplifies and acceler- ates the tracking process. In addition, additional variables such as location, start date, and state are considered to reduce confusion and erroneous perspectives. Distribution companies, in their quest to improve competencies and meet the needs of their customers, benefit from daily indicator lists and a track record of performing average analyses and presentations on the dashboard, facilitating the monitoring of LPG dispatch.
Despite the high score obtained in network and data interoper- ability, the model has limitations regarding service interoperability. Regarding adequately presenting data sources, configuring a data warehouse with dimensions and facts, and identifying appropriate indicators received a generally favorable evaluation from the profes- sionals who analyzed the model. This research proposed a design that makes it possible to monitor the distribution of LPG using a web server, mobile application, or remote warning of IoT sensors. The model automatically closes the LPG passage when it detects a leak. The article does not present prices of IoT devices; however, it emphasizes that the named components are low-cost in the market. The research led to the development of a model combining an IoT component with a four-level BI, proving its effectiveness and accep- tance in the professional field. At the overall medium level, 49% strongly agree, 38% agree, 12% neither agree nor 17 disagree, and 1% disagree. It is concluded that the model has an overall average level of approval of 87%.
Table 4: Results of the survey to professionals.
| No | Questions | 1 | 2 | 3 | 4 | 5 |
| 1 | A BI model presents data sources | 44 | 43 | 10 | 3 | 0 |
| 2 | The Data Warehouse model is presented | 33 | 47 | 20 | 0 | 0 |
| 3 | ETL is presented | 37 | 33 | 30 | 0 | 0 |
| 4 | The names of the indicators are presented | 53 | 40 | 7 | 0 | 0 |
| 5 | The terms of the reports are presented | 57 | 37 | 6 | 0 | 0 |
| 6 | The named software is appropriate | 34 | 33 | 13 | 0 | 0 |
| 7 | The DW contains dimensions and facts | 47 | 40 | 13 | 0 | 0 |
| 8 | The hands are suitable for this case | 57 | 37 | 3 | 3 | 0 |
| 9 | The model promotes a culture of data-driven decision-making | 57 | 30 | 7 | 3 | 3 |
| 10 | The model is clear and specific | 57 | 37 | 6 | 0 | 0 |
| Overall average | 50 | 38 | 12 | 1 | 0 |
Source: Authors.
- G. Senthil, P. Suganthi, R. Prabha, M. Madhumathi, S. Prabhu, S. Sridevi, “An Enhanced Smart Intelligent Detecting and Alerting System for Industrial Gas Leakage using IoT in Sensor Network,” in 2023 5th International Confer- ence on Smart Systems and Inventive Technology (ICSSIT), 397–401, 2023, doi:10.1109/ICSSIT55814.2023.10060907.
- H. Paul, M. K. Saifullah, M. M. Kabir, “A Smart Natural Gas Leak- age Detection and Control System for Gas Distribution Companies of Bangladesh using IoT,” in 2021 2nd International Conference on Robotics, Electrical and Signal Processing Techniques (ICREST), 109–114, 2021, doi:10.1109/ICREST51555.2021.9331226.
- J. B. A. Gomes, J. J. P. C. Rodrigues, J. Al-Muhtadi, N. Arunkumar,
R. A. L. Rabeˆlo, V. Furtado, “An IoT-Based Smart Solution for Pre- venting Domestic CO and LPG Gas Accidents,” in 2018 IEEE 10th Latin-American Conference on Communications (LATINCOM), 1–6, 2018, doi:10.1109/LATINCOM.2018.8613241. - B. B. Sharma, P. Vaidya, N. Kumar, C.-C. Chen, R. Sharma, R. P. Dwivedi, G. Gupta, “Arduino based LPG Leakage Detection and Prevention System,” in 2021 8th International Conference on Computing for Sustainable Global Development (INDIACom), 161–166, 2021.
- S. Ahmed, M. J. Rahman, M. A. Razzak, “Design and Development of an IoT-Based LPG Gas Leakage Detector for Households and Indus- tries,” in 2023 IEEE World AI IoT Congress (AIIoT), 0762–0767, 2023, doi:10.1109/AIIoT58121.2023.10174377.
- PetroEcuador, “PetroEcuador E.P.-GLP,” 2023.
- BCE, “Banco Central Ec GLP,” 2023.
- N. Mahfuz, S. Karmokar, M. I. H. Rana, “A Smart Approach of LPG Monitor- ing and Detection System Using IoT,” in 2020 11th International Conference on Computing, Communication and Networking Technologies (ICCCNT), 1–4, 2020, doi:10.1109/ICCCNT49239.2020.9225293.
- W. Xiao, C. Liu, H. Wang, M. Zhou, M. S. Hossain, M. Alrashoud, G. Muhammad, “Blockchain for Secure-GaS: Blockchain-Powered Secure Natural Gas IoT System With AI-Enabled Gas Prediction and Transaction in Smart City,” IEEE Internet of Things Journal, 8(8), 6305–6312, 2021, doi:10.1109/JIOT.2020.3028773.
- S. A. Yadav, S. Sharma, L. Das, S. Gupta, S. Vashisht, “An Effective IoT Em- powered Real-time Gas Detection System for Wireless Sensor Networks,” in 2021 International Conference on Innovative Practices in Technology and Man- agement (ICIPTM), 44–49, 2021, doi:10.1109/ICIPTM52218.2021.9388365.
- M. Kholil, I. Ismanto, R. Akhsani, “Development Of LPG Leak Detection System Using Instant Messaging Infrastructure Based On Internet Of Things,” in 2021 International Conference on Electrical and Information Technology (IEIT), 147–150, 2021, doi:10.1109/IEIT53149.2021.9587414.
- V. Suma, R. R. Shekar, K. A. Akshay, “Gas Leakage Detection Based on IOT,” in 2019 3rd International conference on Electronics, Communication and Aerospace Technology (ICECA), 1312–1315, 2019, doi:10.1109/ICECA.2019.8822055.
- P. R. Meris, E. Dimaunahan, J. C. Dela Cruz, N. A. Fadchar, M. C. Manuel, J. C. C. Bonaobra, F. J. I. Ranosa, J. L. D. Mangaoang, P. C. Reyes, “IOT Based – Automated Indoor Air Quality and LPG Leak Detection Con- trol System using Support Vector Machine,” in 2020 11th IEEE Control and System Graduate Research Colloquium (ICSGRC), 231–235, 2020, doi:10.1109/ICSGRC49013.2020.9232472.
- A. K. Srivastava, S. Thakur, A. Kumar, A. Raj, “IoT Based LPG Cylinder Monitoring System,” in 2019 IEEE International Symposium on Smart Electronic Systems (iSES) (Formerly iNiS), 268–271, 2019, doi:10.1109/iSES47678.2019.00066.
- S. Chawla, H. Chawla, “IoT-Based Digital LPG Gas Cylinder Trolley to Prevent Hazards with Voice-Controlled Features,” in 2023 6th International Confer- ence on Information Systems and Computer Networks (ISCON), 1–6, 2023, doi:10.1109/ISCON57294.2023.10112147.
- K. Chakradhar, R. Deshmukh, P. P. Singh, B. Hazela, R. Taluja, “LPG Cylinder Leakage Monitoring by IoT,” in 2023 International Confer- ence on Inventive Computation Technologies (ICICT), 1386–1389, 2023, doi:10.1109/ICICT57646.2023.10134191.
- M. H. B. M. Yaya, R. K. Patchmuthu, A. T. Wan, “LPG Gas Usage and Leak- age Detection Using IoT in Brunei,” in 2021 International Conference on Green Energy, Computing and Sustainable Technology (GECOST), 1–5, 2021, doi:10.1109/GECOST52368.2021.9538647.
- P. P. Ramadhani, S. Hadi, R. Rosadi, “Implementation of Data Ware- house in Making Business Intelligence Dashboard Development Using Post- greSQL Database and Kimball Lifecycle Method,” in 2021 International Conference on Artificial Intelligence and Big Data Analytics, 88–92, 2021, doi:10.1109/ICAIBDA53487.2021.9689697.
- K. Gavaskar, D. Malathi, G. Ravivarma, A. Arulmurugan, “Development of LPG Leakage Detection Alert and Auto Exhaust System using IoT,” in 2021 7th International Conference on Electrical Energy Systems (ICEES), 558–563, 2021, doi:10.1109/ICEES51510.2021.9383633.
- R. Eshgarf, M. Deldardil, “Identifying Effective Factors on Deploying Business Intelligence in the Gas Refinery Industries of Iran Based on DEMATEL Ap- proach: A Study of Parsian Gas Refinery Co.” Management and Administrative Sciences Review, 3, 523–531, 2014.
- A. Fornaroli, D. Gatica-Perez, “Urban Crowdsourcing Platforms across the World: A Systematic Review,” Digit. Gov.: Res. Pract., 4(3), 2023, doi:10.1145/3603256.
- S. Shrestha, V. P. K. Anne, R. Chaitanya, “IoT Based Smart Gas Management System,” in 2019 3rd International Conference on Trends in Electronics and Informatics (ICOEI), 550–555, 2019, doi:10.1109/ICOEI.2019.8862639.
- R. K. Kodali, R. Greeshma, K. P. Nimmanapalli, Y. K. Y. Borra, “IOT Based Industrial Plant Safety Gas Leakage Detection System,” in 2018 4th Interna- tional Conference on Computing Communication and Automation (ICCCA), 1–5, 2018, doi:10.1109/CCAA.2018.8777463.
- G. V. Da Silva Medeiros, M. R. d. Santos, A. S. B. Lopes, E. C. Bar- balho Neto, “Smartgas: a smart platform for cooking gas monitoring,” in 2017 IEEE First Summer School on Smart Cities (S3C), 97–102, 2017, doi:10.1109/S3C.2017.8501387.
- N. Denic´, Z. Nesˇic´, M. Radojicˇic´, J. V. Vasovic´, “Some considerations on business intelligence application in business improvement,” in 2014 22nd Telecommunications Forum Telfor (TELFOR), 1142–1145, 2014, doi:10.1109/TELFOR.2014.7034609.
- U. u. R. Zia, M. Zulfiqar, U. Azram, M. Haris, M. A. Khan, M. O. Zahoor, “Use of Macro/Micro Models and Business Intelligence tools for Energy As- sessment and Scenario based Modeling,” in 2019 4th International Conference on Emerging Trends in Engineering, Sciences and Technology (ICEEST), 1–7, 2019, doi:10.1109/ICEEST48626.2019.8981691.
- P. R. Meris, E. Dimaunahan, J. C. Dela Cruz, N. A. Fadchar, M. C. Manuel, J. C. C. Bonaobra, F. J. I. Ranosa, J. L. D. Mangaoang, P. C. Reyes, “IOT Based – Automated Indoor Air Quality and LPG Leak Detection Con- trol System using Support Vector Machine,” in 2020 11th IEEE Control and System Graduate Research Colloquium (ICSGRC), 231–235, 2020, doi:10.1109/ICSGRC49013.2020.9232472.
- S. Z. Yahaya, M. N. Mohd Zailani, Z. H. Che Soh, K. Ahmad, “IoT Based System for Monitoring and Control of Gas Leaking,” in 2020 1st International Conference on Information Technology, Advanced Mechanical and Electrical Engineering (ICITAMEE), 122–127, 2020, doi:10.1109/ICITAMEE50454.2020.9398384.
- F. Aman, T. P. Thiran, K. Huda Yusof, N. M. Sapari, “IoT Gas Leakage De- tection, Alert, and Gas Concentration Reduction System,” in 2022 IEEE 12th Symposium on Computer Applications & Industrial Electronics (ISCAIE), 55–60, 2022, doi:10.1109/ISCAIE54458.2022.9794559.
- M. R. Islam, A. Matin, M. S. Siddiquee, F. M. S. Hasnain, M. H. Rah- man, T. Hasan, “A Novel Smart Gas Stove with Gas Leakage Detec- tion and Multistage Prevention System Using IoT LoRa Technology,” in 2020 IEEE Electric Power and Energy Conference (EPEC), 1–5, 2020, doi:10.1109/EPEC48502.2020.9320109.
- M. Kumaran, J. Pradeep, R. Hounandan, B. Prahatheesh, “Smart LPG Cylinder Monitoring and Explosion Management System,” in 2021 12th International Symposium on Advanced Topics in Electrical Engineering (ATEE), 1–7, 2021, doi:10.1109/ATEE52255.2021.9425101.
- F. A. Hambali, R. Fitriana, E. Joelianto, “Integration System of IoT Gas Sensor using Simple Network Management Protocol and Open Platform Communica- tion,” in 2021 IEEE 7th Information Technology International Seminar (ITIS), 1–6, 2021, doi:10.1109/ITIS53497.2021.9791564.
- L. Jinfeng, C. Chen, C. Xiaowei, W. Wei, “Management of In- door Gas Safety based on the NB-IoT Gas Meter,” in 2021 33rd Chinese Control and Decision Conference (CCDC), 2776–2780, 2021, doi:10.1109/CCDC52312.2021.9602560.
- S. I. Nahid, M. M. Khan, “Toxic Gas Sensor and Temperature Monitor- ing in Industries using Internet of Things (IoT),” in 2021 24th International Conference on Computer and Information Technology (ICCIT), 1–6, 2021, doi:10.1109/ICCIT54785.2021.9689802.
- K. S¸ ahinbas¸, B. Yılmaz, Business Intelligence Application in the Natural Gas Industry: A Company Case, 141–154, Springer International Publishing, Cham, 2021, doi:10.1007/978-3-030-76783-9 11.
- H. Saad, S. A. Siddiqui, N. F. Naim, N. Othman, “Development of LPG Leak- age Simulation System Integrated with the Internet of Things (IoT),” in 2022 IEEE 18th International Colloquium on Signal Processing & Applications (CSPA), 161–166, 2022, doi:10.1109/CSPA55076.2022.9781880.
- R. B, G. K, M. D, N. R, G. V, S. R, “Smart Detection System for LPG Gas Leakage using IoT,” in 2022 6th International Conference on Computing Methodologies and Communication (ICCMC), 421–430, 2022, doi:10.1109/ICCMC53470.2022.9753894.
- B. Gokulavasan, K. Shrina, U. Sangeetha Sruthi, R. Sneka Darshini, D. Srivaishnavi, “Smart Gas Booking System and Leakage Detection Us- ing IOT,” in 2022 8th International Conference on Advanced Comput- ing and Communication Systems (ICACCS), volume 1, 1914–1917, 2022, doi:10.1109/ICACCS54159.2022.9785144.
- S. Reddy, R. P. K N, “LPG Gas Detection and Monitoring Using IoT,” in 2022 International Interdisciplinary Humanitarian Conference for Sustainability (IIHC), 693–697, 2022, doi:10.1109/IIHC55949.2022.10060195.
- L. Khajavizadeh, M. Andersson, “MOSFET-based gas sensors for process industry IoT applications,” in 2022 International Conference on Electrical, Computer, Communications and Mechatronics Engineering (ICECCME), 1–5, 2022, doi:10.1109/ICECCME55909.2022.9988741.
- R. B, M. D, G. K, S. N, S. R, K. T, “IoT based Automatic Electricity Cut off using LPG Gas Leakage Detection System,” in 2023 Second International Conference on Electronics and Renewable Systems (ICEARS), 1–8, 2023, doi:10.1109/ICEARS56392.2023.10085217.
- S. Lorthong, U. Janjarassuk, N. Jayranaiwachira, “LPG Leakage Risk Predic- tions from an IoT-Based Detection System Using Machine Learning,” in 2023 9th International Conference on Engineering, Applied Sciences, and Technol- ogy (ICEAST), 14–17, 2023, doi:10.1109/ICEAST58324.2023.10157528.
- T. Kalavathi Devi, N. S. Kumar, G. Chandrasekaran, P. Sakthivel, N. Priyadarshi, M. S. Bhaskar, N. Kumar, “IoT Based Remote Monitor- ing of Gas Leakage in Power Plants,” in 2023 IEEE 3rd International Conference on Technology, Engineering, Management for Societal impact using Marketing, Entrepreneurship and Talent (TEMSMET), 1–5, 2023, doi:10.1109/TEMSMET56707.2023.10150136.
- M. Reza, “Business Intelligence on Agile Natural Gas Supply Chain,” Journak of Business Data Science Research, 2023.
- D. Gautam, S. Bhatia, N. Goel, B. Mallikaijuna, G. H S, B. Bhushan Naib, “Development of IoT Enabled Framework for LPG Gas Leakage Detection and Weight Monitoring System,” in 2023 International Conference on Device In- telligence, Computing and Communication Technologies, (DICCT), 182–187, 2023, doi:10.1109/DICCT56244.2023.10110294.
- Blynk, “Blynk,” 2023. Avaliable Online: https://blynk.io/
- Microsoft, “Power BI,” 2023, Avaliable Online: https://powerbi.microsoft.com/es-es/
- K. Ralph, R. Margy, The Data Warehouse Toolkit, In John Wiley & Sons, Inc., Canada, 2018.
- S. Nishisato, Data Analysis and Likert Scale, 19–36, Springer Nature Singa- pore, Singapore, 2023, doi:10.1007/978-981-99-2295-6 2.