Power-Energy Simulation for Multi-Core Processors in Bench-marking

Adv. Sci. Technol. Eng. Syst. J. 2(1), 255–262 (2017);
 DOI: 10.25046/aj020131
At Microarchitectural level, multi-core processor, as a complex System on Chip, has sophisticated on-chip components including cores, shared caches, interconnects and system controllers such as memory and ethernet controllers. At technological level, architects should consider the device types forecast in the International Technology Roadmap for Semiconductors (ITRS). Energy simulation enables architects to study two important metrics simultaneously. Timing is a key element of the CPU performance that imposes constraints on the CPU target clock frequency. Power and the resulting heat impose more severe design constraints, such as core clustering, while semiconductor industry is providing more transistors in the die area in pace with Moore’s law. Energy simulators provide a solution for such serious challenge. Energy is modelled either by combining performance benchmarking tool with a power simulator or by an integrated framework of both performance simulator and power pro?ling system. This article presents and asses trade-o?s between di?erent architectures using four cores battery-powered mobile systems by running a custom-made and a standard benchmark tools. The experimental results assure the Energy/ Frequency convexity rule over a range of frequency settings on di?erent number of enabled cores. The reported results show that increasing the number of cores has a great e?ect on increasing the power consumption. However, a minimum energy dissipation will occur at a lower frequency which reduces the power consumption. Despite that, increasing the number of cores will also increase the e?ective cores value which will re?ect a better processor performance.
1. Introduction
Microprocessor performance has helmed its indus- croprocessor hardware implementation must be taken try for four decades. Reducing power consumption into account in order to speed up this workload exehas become a stringent design principle especially for cution time such as using many cores. battery-driven devices. Limiting the increase in CPU In this paper, we make the case for exploring the clock frequency, because of low-power constraints trade-off between low power and energy efficiency and high energy efficiency, has become a real chal- over a wide range of clock frequencies. We do the lenge for improving microprocessor performance over experiments on different battery-powered Laptops the next generation. So, other aspects in microproces- and Smartphones in [1] on a single core. We ensor architecture (Instruction Set) and compilers opti- face two problems: the choice of power measurement tools and the choice of performance benchmark tools. An accurate reliable power measurement software has to be selected in such a way to be running on Linux platform for Laptop devices like Powerstat (Power consumption calculator for Ubuntu Linux. Available: http://www.hecticgeek.com), or running on Android platform for Smartphones like Powertutor [2]. To capture the transitions between power states, two different finite state machines (FSM) based power modeling scheme [3] are implemented: The standard CoreMark benchmark (Industry-standard benchmarks for embedded systems. Available: http://www.eembc.org/coremark), executed on Linux OS, represents a disk with tail power state model that writes the running power on a disk file and stays at high power state for a period after the active I/O activity. The custom-made Fibonacci benchmark, written with Java on Android, represents a free model that returns to the base state without inactivity period.
In summary, this paper makes the following contributions:
- We make laboratory experiments for exploring the relationship between processor performance, power consumption and energy efficiency over a range of clock frequencies on different number of enabled cores.
- We represent the experimental setup in order to obtain reliable results.
- We represent a detailed implementation on different laptops and Smartphones operating systems.
- The plotted results assure that minimum energy dissipation is always achieved even with different workloads, and at a certain clock frequency but with a limited performance, lower power consumption and without optimization realization.
- We have proved the Energy/ Frequency convexity rule on multi-core (instead of one core) processors [4].
- Such observations can be fed into an intelligent DVFS scheduling, power management module of an operating system, on multi-core processors, which can achieve energy and power savings without impacting the performance.
- We have proved that increasing number of cores has a great effect on increasing the power consumption. However, a minimum energy dissipation will occur at a lower frequency which reduces the power consumption. Despite that, increasing the number of cores will also increase the effective cores value which will reflect a better processor performance.
The rest of this paper is organized as follows:
Section 2 presents the existing energy modeling approaches. Section 3 formulates the problem with some equations. In section 4 the experimental results are evaluated and analyzed. Finally, section 5 concludes the paper.
2. Related Work
Most of the existing system energy modeling approaches combine between power profiling systems and performance benchmark tools. SPEC has developed SPECpower ssj2008 (S.P.E. Corporation. specpower ssj2008 benchmark suite. Available: http://www.spec.org/power ssj2008) focusing on server computer consumption, and EEMBC has introduced EnergyBench establishing a framework for adding energy to the metrics of the EEMBC’s performance benchmarks (E.T.E.M.B. Consortium. energybench version 1.0 power/energy benchmarks. Available: http://www.eembc.org/benchmark/power sl.php). McPAT [5] is a fully-integrated power, area and timing modeling framework. It models all types of power dissipation and provides an integrated solution for multithreaded and multi-core processors. McPAT power modeling is combined with Sniper performance simulation in [6].
2.1. Power Profiling Systems
Existing power measurement methods are limited in two ways. First, some systems
[3,7,8] and Monsoon power monitor (Available: http://www.msoon.com/LabEquipment/PowerMonitor) generate their models by using external hardware lab equipments like sensors, meters, and data acquisition devices. Second, other systems like Powerstat, [2,9,10] are self-modeling. They construct their models without external circuitry. They use built-in battery sensors or the smart battery interface fuel gauge IC; or read system files available on mobile systems. Integrated sensors are provided on CPUs [11] such as Intel processors [12] and AMD processors [13], on GPU cards [14], or on motherboards equipped with a Baseboard Management Controller (BMC) monitoring chip [15].
Some of this systems are Event-based as in [3,5] or per-component power measurements in addition to the total power as in [5,7,9,16,17]. Others modeled power measurements by applications as in [2]. Industry simulators are typically cycle-accurate that run at a speed of 1 to 10 kHz. Academic simulators, such as [18,19] are not truly cycle-accurate compared to real hardware, and therefore they are faster, with simulation speeds in the tens to hundreds of KIPS (kilo simulated instructions per second) range. They do not scale well to large multi-core systems.
2.2. Performance Benchmark Tools
SPECpower ssj2008 benchmark and the Apache benchmarking tool (ab – apache benchmarking tool.
Available: http://httpd.apache.org/docs/2.2/programs
/ab.html) are used for HTTP server traffics. The SPECpower ssj2008 is the first industry standard SPEC benchmark that evaluates the power and performance characteristics of volume server class and multi-node class computers.The widespread used benchmark in industry and academia is SPEC CPU2006 [20]. EEMBC has benchmarks for generalpurpose performance analysis including CoreMark, MultiBench(multicore), and FPMark (floating-point).
3. Problem Formulation
The basic relationships among computer performance, power consumption and energy efficiency are expressed as follows:
P rocessor P erf ormance = 1/CP U Execution time (1)
Energy Ef f iciency = 1/dissipated Energy (2)
Energy = Power ∗ CPU Execution time (3)
As shown in [21], the power consumed by a processor is directly proportional with the clock frequency (f ).
In order to study the impact of clock speed on the processor performance without DVFS scheduling, the CPU Execution time (tx) is computed as:
tx = Instruction Count ∗ CPI ∗ T cycle (4)
where T cycle equals 1/f and CP I is the average
number of cycles per instruction.
i.e. tx is function of (1/f ), and improving the performance requires decreasing tx and speeding up the
CPU frequency. Or tx = Number of clock cycles/f (5)
in case of single core. And tx = Number of clock cycles/(f ∗ ce) (6)
in case of multi-core where ce is the effective cores parameter which reflects the degree of the execution parallelization achievement.
Equation (3) shows that, in order to minimize the energy, power should be reduced. This can be achieved by using low clock frequency. On the other side, reducing tx requires high clock frequency. This trade-off between lower power and better performance leads to the existence of an optimum point for minimal energy usage with a tight performance improvement at a certain specific CPU frequency (fm). The goal of the presented experiments in this paper is to search for such minimal energy when the CPU frequency is varied and find the optimum frequency fm for a varied number of cores.
4. Experimental Setup
The presented experiments measure the power and the execution time while running different workloads on specific Dynamic Voltage and Frequency Scaling (DVFS) mobile system settings over a 0.6 GHz to 1.7 GHz range of CPU frequencies.
The variation of CPU frequency settings needs the CPU frequency information of the used mobile device. These settings demand the resetting of the power management policy, the disabling of some cores; and the setting of the only enabled cores with one of its frequency values in parallel with its upper frequency limit.
The experiments are implemented on three different battery-powered mobile systems shown in Table 1: two Intel Laptops (Acer and Dell) and one ARM
Smartphone (Samsung A5), on different Operating Systems Ubuntu and Android respectively in [1] and extended to multi-core on the two Laptops only. The offered workloads were CoreMark, the standard benchmark tool for Laptops and a custom-made Fibonacci benchmark for the Smartphone and also for the Acer and Dell Laptops. The Fibonacci benchmark is implemented, in Java, iteratively for 2E8 iterations. The execution time is measured via those performance benchmark tools.
The power consumed by these performance benchmark tools is measured by different power profiling systems: Powerstat on Linux O.S. and Powertutor [2] on Android. Both systems use the built-in smart battery interface to measure power at rate 1 Hz while the battery is discharging. Powerstat measures the total power while Powertutor measures also an individual power per application. Both power profiling systems have to be running by at least one minute before running the performance benchmark tools giving the chance to the power to be stabilized.
4.1. How to measure power?
For Laptops with Linux platforms, Powerstat is used to measure the power consumed by the running CoreMark. Two factors are considered: Powerstat measures the total power of the Laptops and CoreMark is a disk with tail powerstate model. Steps to measure CoreMark consumed power (Pc):
- Reset the power management policy.
- Operate the frequency scaling governor in userspace mode.
- Enable only i CPU cores and disable the others.
- Set a certain frequency for all running cores.
- Run Powerstat.
- Wait for two minutes until the power is stabilized.
Run CoreMark or any performance benchmark and register Start and End of the Execution time.
Table 1: Simulated Mobile Systems Characteristics
| Parameter | Acer Aspire 1 | Dell Inspiron15 | Samsung Galaxy A5 |
| Processor | 4xIntel(R) Atom(TM)CPU
N2600 @1.60GHz |
4x Intel(R) Core(TM) i5-
4210U CPU @1.70GHz |
Quad-core 1.2GHz
Cortex-A53 |
| Memory | 2G RAM | 4G RAM | 2G RAM |
| Operating System | Ubuntu 14.04.3 LTS | Ubuntu 13.04 | Android OS, v4.4.4 |
| Kernel | Linux 3.13.065
generic(i686) |
Linux 3.8.0 0-19
generic(i686) |
3.10.28-4197997 dpi@SWDD5006-1 |
- Examine the Powerstat log file, register the power before and a while after the execution time of the CoreMark until the completion of CoreMark I/O and take the average power without running the CoreMark (Ps). Ps presents the average power of the system and the Powerstat.
- Compute the average total power between Start and End-time of CoreMark execution by averaging power batches (Pt).
- Compute Pc = Pt ∗Ps
- Repeat steps from 5 to 10 in order to get 10 batches and get the average Pc.
- Repeat steps from 5 to 11 with all available CPU frequencies.
- Repeat steps from 3 to 12 for i different number of cores (1 to 4)
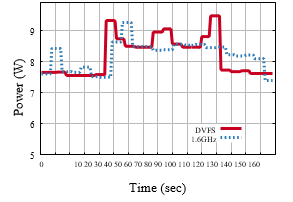
A sample output of Power measured by Powerstat with DVFS scheduling and another with 1.6 GHz fixed CPU frequency setting are shown by the Instantaneous Power Profiles in Fig. 1. The resulting power profile shows that the power with DVFS scheduling returns the base state (7.5 watts) 30 seconds earlier than the one with fixed 1.6 GHz CPU frequency setting and also drops about 0.7 watts. This DVFS scheduling saves about 30 sec * 0.7 watts or 21 joules.
For Smartphones with Android platforms, Powertutor is used for power management. Referring to the steps described above to measure the CoreMark consumed power, apply the first 7 steps with interchanging PowerStat with Powertutor and CoreMark with Fibonacci Java code. No need to compute the average consumed power Pc for benchmark since Powertutor measures power for each individual application separately and register it in its log file. Then, repeat steps from 5 to 7 with all available frequencies and cores.
5. Experimental Results and Analysis
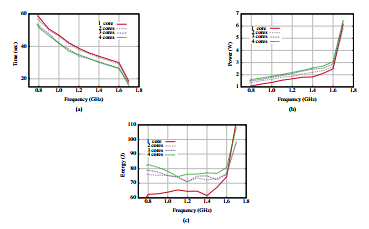
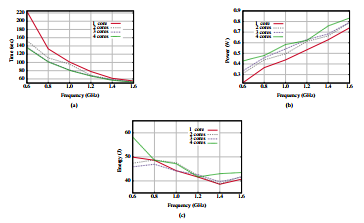
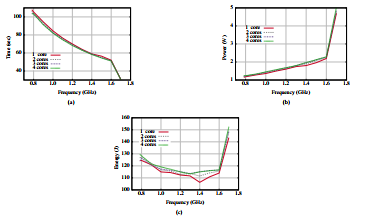
This section illustrates the relationship between the CPU execution time, the power consumption, and the dissipated energy over a 0.6 GHz to 1.7 GHz range of CPU frequencies. We formulate sixteen experiments on one, two, three and four enabled cores. The half of the experiments run over Linux OS using the CoreMark Benchmark on an Acer and Dell Laptops as shown in Figures 2 and 3. The other half run the custom-made Fibonacci Java code over Linux OS on Acer and Dell Laptops as shown in Figures 4 and 5. The CoreMark offered Workload is set to 200,000 iterations while The Fibonacci offered Workload is set to 2E8 iterations.
Figures 2(a), 3(a), 4(a) and 5(a) plot the time results in seconds of the four different number of enabled cores experiments with the variation of the CPU frequency. The sixteen time curves prove (6). They demonstrate that the CPU execution time tx decreases at higher clock rates and/or a higher effective cores value (ce). Although different workloads are offered to the Acer Laptop, they approximately spent the same tx. This time is much lower when executing the same loads on the higher specifications of Dell Laptop. The Dell Laptop is much faster than the Acer one.
The graphs in Figures 2(b), 3(b), 4(b) and 5(b) plot the power results in Watts for the four varied number of cores experiments with the variation of CPU frequency. The two power graphs of Acer Laptop approximately overlap; while the power consumed by the Dell Laptop is much higher.
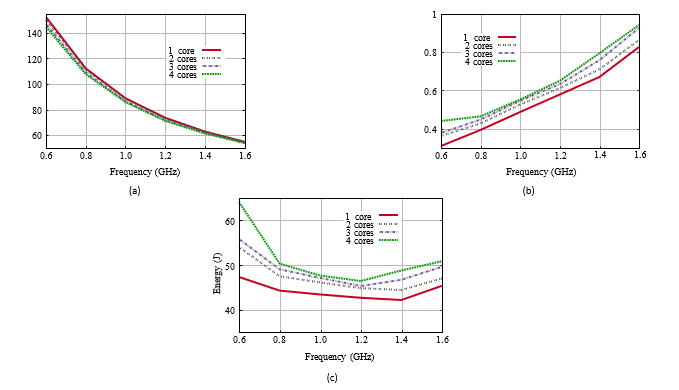
The power graphs of the sixteen experiments ensure that the processor power is proportional to CPU frequency [21]. In addition, incrementing the number of enables cores also increases the power.
All figures (2, 3, 4 and 5) illustrate that increasing frequencies decreases the execution time while increasing the consumed power by the processor. They also show that increasing the number of cores has a great effect on increasing the power consumption.
This trade-off between execution time and power, with the variation of frequencies, leads to the convex energy curves in Figures 2(c), 3(c), 4(c) and 5(c). The energy is computed by (3). The Acer Laptop has minimal energy with the CoreMark benchmark at fm =1.4 GHz when one or two cores are enabled, and at fm =1.2 GHz when three or four cores are enabled. While it has a minimal energy at fm = 1.4 GHz for the Fibonacci benchmark when one, two or three cores are enabled and fm = 1.2 GHz when four cores are enabled. The advanced Dell Laptop has a minimal energy at fm = 1.4 GHz with CoreMark benchmark when a single core is enabled, fm = 1.2 GHz when two or three cores are enabled, and fm = 1.1 GHz when the four cores are enabled. While it has a minimal energy at fm = 1.4 GHz with Fibonacci benchmark when one or two cores are enabled and fm = 1.3 GHz when three or four cores are enabled.
All of the sixteen experiments demonstrate that a minimal energy can be obtained at an optimum frequency fm. Referring to the execution time in Figures 2(a), 3(a), 4(a) and 5(a) at those fm frequencies, a tight performance improvement can be achieved: about 75% in Acer and 65% in Dell Laptops from those of the largest frequencies in case of a single core.
Referring to the power consumption in Figures 2(b), 3(b), 4(b) and 5(b) at those fm frequencies, more power is consumed: about 200% in Acer and 140% in Dell Laptops from those of the smallest frequencies. So other design factors, rather than clock speed, have to be considered for a low-power achievement. In case of multi-core processors, increasing the number of enabled cores shifts fm to lower frequency and reduces the power but increases the ce value which reflects a better performance. As an illustrating example, running the CoreMark on Acer Laptop at fm =1.4 GHz on a single core has the same power as running it at fm =1.2 GHz on quad-core. From 6, in order to keep the same performance, the ce value should be at least 1.4/1.2 which is equivalent to 1.16. Therefore, the degree of execution parallelization achievement defined by the effective cores value (ce) is the dominant factor of the processor performance.
6. Conclusion
Energy efficiency improvement can’t be achieved by exploring the hardware implementation of the microprocessor design only. Referring to (4), the CPU performance is also improved by a good design of instruction set architecture (ISA).
ISA optimization decreases the program Instruction Count and the CPI. Such optimization has a direct impact on minimizing the offered workload, consequently it reduces the power by decreasing the CPU utilization.
Improving processor performance by hardware implementation as rising the CPU frequency has a greater side effect on the power. Another factor like CPI has to be considered. High-level of parallelism, including superscaler implementation based on instruction-level parallelism or multi-processing architecture where many core (MTC) are integrated, can achieve a better CPI. Using Multi-core processor, as detected by the experiments, reduces the execution time without extra power while enhancing the energy efficiency.
The demonstrated experiments assure the trade-off between optimizing the energy efficiency and improving the processor performance. Both always affect the power consumption while changing the CPU frequencies. Furthermore, we have proved that increasing number of cores has a great effect on increasing the power consumption. However, a minimum energy dissipation will occur at a lower frequency which reduces the power consumption. Despite that, increasing the number of cores will also increase the effective cores value which will reflect a better processor performance.
Conflict of Interest
No conflict of interest.
- MA. Abou-Of, AH. Taha, AA. Sedky, “Trade-off Between Low Power and Energy Efficiency in Benchmarking.” in 7th International Conference on Information and Communication Systems. IEEE Conference Publications, 2016.
- L. Zhang, B. Tiwana, Z. Qian, Z. Wang, RP. Dick, ZM. Morley, L. Yang “Accurate Online Power Estimation and Automatic Battery Behavior Based Power Model Generation for Smartphones.” in 8th IEEE/ACM/IFIP International Conference on Hardware/Software Codesign and System Synthesis. ACM, 2010.
- A. Pathak, YC. Hu, M. Zhang, P. Bahl, YM. Wang “Finegrained Power Modeling for Smartphones Using System Call Tracing.” in 6th Conference on Computer Systems. ACM, 2011.
- K. De Vogeleer, G. Memmi, P. Jouvelot, F. Coelho “The Energy/Frequency Convexity Rule: Modeling and Experimental Validation on Mobile Devices.” in International Conference on Parallel Processing and Applied Mathematics. Springer Berlin Heidelberg, 2013.
- S. Li, JH. Ahn, RD. Strong, JB. Brockman, DM. Tullsen, NP. Jouppi “McPAT: An Integrated Power, Area, and Timing Modeling Framework for Multicore and Manycore Architectures.” in 42nd Annual IEEE/ACM International Symposium on Microarchitecture. ACM, 2009.
- W. Heirman, S. Sarkar, TE. Carlson, I. Hur, L. Eeckhout “Power-aware Multi-core Simulation for Early Design Stage Hardware/Software Co-optimization.” in 21st International Conference on Parallel Architectures and Compilation Techniques. ACM, 2012.
- S. Guti´errez-Verde, O. Bened´i-S´anchez, D. Su´arez-Gracia, JM. Mar´tin-Herrero, V. Vi˜nals-Y´ufera “Processor Energy and Temperature in Computer Architecture Courses: a Hands on Approach.” in Workshop on Computer Architecture Education. 2009.
- R. Ge, X. Feng, S. Song, HC. Chang, D. Li “Powerpack: Energy profiling and analysis of high-performance systems and applications.” IEEE Transactions on Parallel and Distributed Systems, 21(5), 658-671, 2010.
- M. Dong, L. Zhong “Self-constructive High-rate System Energy Modeling for Battery-powered Mobile Systems.” in 9th International Conference on Mobile systems, Applications, and Services. ACM, 2011.
- R. Murmuria, J. Medsger, A. Stavrou, JM. Voas “Mobile Application and Device Power Usage Measurements.” in 6th International Conference on Software Security and Reliability (SERE). IEEE, 2012.
- D. Hackenberg, T. Ilsche, J. Schuchart, R. ch¨one, WE. Nagel, M. Simon, I. Georgiou “Hdeem: High definition energy efficiency monitoring.” in Proceedings of the 2Nd International Workshop on Energy Efficient upercomputing, E2SC’14. IEEE Press, 2014.
- Intel Corporation “Intel ® 64 and IA-32 Architectures Software Developer’s Manual. Number 253669-053US”, 2015.
- Advanced Micro Devices “AMD BIOS and Kernel Developer’s Guide (BKDG) for AMD Family 15h Models 00h-0Fh Processors”, 2013.
- M. Burtscher, I. Zecena, Z. Zong “Measuring GPU power with the K20 builtin sensor.” in Proceedings of Workshop on General Purpose Processing Using GPUs, GPGPU-7. ACM, 2014.
- Intel Corporation “Intelligent Platform Management Inter-face Spec”, 2013.
- C. Isci, M. Martonosi “Runtime Power Monitoring in High-end Processors: Methodology and Empirical data.” in 36th annual IEEE/ACM International Symposium on Microarchitecture. IEEE Computer Society, 2003.
- A. Shye, B/ Scholbrock, G. Memik “Into the Wild: Studying Real User Activity Patterns to Guide Power Optimizations for Mobile Architectures.” in 42nd Annual IEEE/ACM International Symposium on Microarchitecture. ACM, 2009.
- N. Binkert, B. Beckmann, G. Black, SK. Reinhardt, A.Saidi, A. Basu, J. Hestness, DR. Hower, T. Krishna, S. Sardashti et al. “The gem5 simulator” ACM SIGARCH Computer Architecture News, 39(2), 17, 2011.
- MT. Yourst“PTLsim: A Cycle Accurate Full System x86-64 Microarchitectural Simulator.” in 2007 IEEE International Symposium on Performance Analysis of Systems & Software. IEEE, 2007.
- JL. Henning“SPEC CPU2006 benchmark descriptions” ACM SIGARCH Computer Architecture News, 34(4), 1-17, 2006.
- JM. Rabaey, AP. Chandrakasan, B. Nikolic “Digital integrated circuits” Englewood Cliffs: Prentice hall, 2002.
No related articles were found.