Proposal for a Visualization System of Purchase Relationship Using ID-POS Data

Adv. Sci. Technol. Eng. Syst. J. 2(3), 1290–1297 (2017);
 DOI: 10.25046/aj0203163
In recent years, big data analysis is gaining immense credence in the fields of academics and business. Businesses such as management and marketing have demonstrated a strong inclination and interest in data analytics. However, many businesses are unable to utilize data even if they have access to it. The main reason for that is the lack of familiarity with data analytics procedures. Hence, a system needs to be developed that can perform data analytics and demonstrate its benefits. In this study, we use point of sales data obtained from a supermarket chain to analyze and show the relationship between purchase goods at the same time. A supermarket is one of the ideal places to demonstrate data analysis because retail stores have many purchase records and are always conducting various marketing activities. We propose an easy-to-handle visualization system to show the goods that are inter-related. By using our system, a store manager can obtain information about the item sales easily and interactively.
1. Introduction
In recent years, big data analytics has been receiving increasing attention due to the progress of information and communication technologies in various fields [1,2]. Big data can be defined as data characterized by the 3Vs-Volume, Variety, Velocity, i.e., a large amount of data of rich variety and accumulated at high frequencies [3]. Big data has increased drastically due to the increase in internet penetration with the development of digital devices such as smart phones and the prevalence of social networking services. More and more businesses are trying to utilize big data for business planning and corporate strategies using in-house expertise, so that they do not have to depend on data analysis experts.
Supermarkets and department stores are trying to devise an effective sales strategy to address diverse consumer needs by critically analyzing point-of-sales (POS) data. However, effective big data analysis requires extensive knowledge of data structures and programming, which can be built over a period of time. Hence, businesses and services are still not able to effectively utilize big data analytics on-site.
Retailers such as supermarkets are often required to make quick decisions. Quick decision-making requires quick data analysis to grasp the various needs of the consumer, and consequently, the store, and utilize the insights derived for strategic planning to increases sales, minimize inventory, improve efficiency, etc. Consequently, retail stores need interactive operations and real-time analysis capabilities.
This study is organized as follows: Section 2 presents the purpose of our study. Section 3 describes the study conducted to attain the objectives and the features of the proposed system. Section 4 describes the basic concepts and technology. Section 5 outlines the proposed system, its functions, and the way it can be applied. Section 6 describes the experimental evaluation of the proposed system. Finally, Section 7 concludes the paper and discusses the future topics to follow up on this study. This paper is an extension of work originally presented in Future Technologies Conference (FTC) 2016 [4].
2. Purpose of our research
In this study, we propose a system that allows users to visualize relationships between goods while manipu-
lating interactively. The proposed system enables:
- Automation of the data analysis process fromdata extraction to visualization to reduce the burden on users.
- Development of a real-time sales strategy byconstructing a platform that can freely operate under various conditions.
The proposed system aims to devise a real-time sales strategy that is not dependent upon the intuition and experience of individuals, instead relying on insights gained from the data collected on-site. Even if the data analyst does not have programming knowledge, the proposed system can help him/her understand the relationship between the goods. From the analysis of relationships between the goods, the analyst can derive the insights. Moreover, the proposed system is available as a web application, allowing users to share the results of the analysis by using a web browser. The proposed system can be utilized for the arrangement of goods on shelves and offer suggestions for their effective promotion, such as the distribution of a free recipe with hot-selling goods.
3. Related studies
In this section, we discuss other studies related to this study and describe the characteristics of the proposed system.
As mentioned above, various data are being accumulated in recent years. Under such situation, SNA(social network analysis) which is based on ”graph theory”, has been attracting attention as a method of analyzing a large amount of data. SNA is an analytical method that clarifies the structure of a network composed of “Vertex” and “Edge”. In recent years, with the advent of social media, there are many studies targeting SNS. In these studies, the users are regarded as vertexes, join relationships defined between users are regarded as edges. For the purpose of these studies, the characteristics of the community, comparison of network structures, creation of formation model of social network are set up[5, 6, 7]. On the other hand, there is also research that systematizes technology of social network analysis[8].
Ito et al. proposed a visualization system using the conditional parts from the results of association rule mining. With this system, the user can figure out the relationship between the conditional parts in association rules by using hierarchical graphs [9].
Matsuo et al. used databases of academic theses and picked out the human relationship within a specific community from information acquired from the web. From the results, the human relationships could be understood appropriately. The information on human relationships can then be used to find people who are in the same academic field for the benefit of students and researchers. To judge the strength of the relationship, they used an index, which is based on a combination of the principles of the Dice coefficient and the Jaccard coefficient. They then performed a comparative verification of the index [10].
These studies showed that it is useful as a system using network analysis. However, such a system is not effective in reducing the burden on analysts and providing an easy-to-use platform. In this study, we propose a system that satisfies the following expectations:
- Real-time processing:
The system is able to visualize the network even if the user wants real-time data. For example, the system can help the analyst identify how the relationship between the goods will change in an hour’s time in case of a limited-time sale and which relationships are strong in a particular time zone, all of this in real time.
- Interactive processing:
The system allows the analyst to interactively extract data and set the threshold, allowing him/her to customize information based on specific needs.
- Ease of operation
In a conventional analysis, the analyst needed to run the script, which was written as an R script, to prepare appropriate data for visualization. Moreover, it was necessary to write more scripts for appropriate visualization. Since it takes time to understand these scripts, it is difficult for beginners to process them. Therefore, the proposed system automates these processes to help the analyst who is not good at programming understand the results easily.
4. Basic concept and technical elements
In this section, we explain the basic concepts used in this study including association rule mining, cooccurrence indexes, and network analysis.
4.1. Association rule mining
|X ∩ Y |In recent years, POS data has become easy to obtain. However, one of the significant problems here is the effective use of the enormous accumulated data. Association rule mining [11] is a popular and well-known method for analyzing useful relationships between variables in large databases. It extracts frequent combinations (association rules) of items from transaction data. The main aim of this method is to derive the pertinent rules from the data. The association rule uses Support (1), Confidence (2), and Lift (3) as the indexes that show the relationships between the goods. The rule which states that “When X is bought, Y is also bought” is transcribed concisely as {X}⇒{Y}. The sets of items X and Y are called antecedent (left-hand-side or LHS) and consequent (right-hand-side or RHS) of rule respectively. Moreover, in a few cases, one rule is formed by more than three goods. For example, {potato, carrot}⇒{onion} means that “When potatoes and carrots are bought, onions are also bought.”
Support(X,Y) = (1)
|M|
|X ∩ Y |
Conf idence(X,Y) =
|X|
Support(X,Y)
=(2)
Support(X)
Conf idence(X,Y)
Lif t(X,Y) = (3)
Support(Y)
where X, Y denote the set of items respectively. |X| is the number of transactions that includes X. |X ∩ Y | is the number of transactions that include X and Y. |M| indicates all transactions.
4.2. Co-occurrence index
Co-occurrence indexes [12] are used in the field of language processing. These indexes are mainly used for text data analysis. Co-occurrence means the simultaneous appearance of more than one word in one sentence. The sentences are usually taken from platforms such as Twitter or search history. For example, “test” and “pass” are often used at the same time in many cases, which indicates that “test” and “pass” have a strong co-occurrence. In this way, it is possible to guess a relationship between words by extracting the strong co-occurrence from a large number of combinations. In this study, we try to extract the relationship by using the co-occurrence index to measure the strength of the relationship between goods. Then we use indexes such as Jaccard coefficient (4), Simpson coefficient (5), Dice coefficient (6), and Cosine coefficient (7). Features of these indexes are discussed below:
|X ∩ Y |
| Jaccard(X,Y) = |X ∪ Y | | (4) |
| |X ∩ Y |
Simpson(X,Y) = min(|X|,|Y |) |
(5) |
| 2|X ∩ Y | Dice(X,Y) =
|X| + |Y | |
(6) |
| |X ∩ Y | Cosine(X,Y) = p | (7) |
|X||Y |
The values of these indexes range from 0.0 to 1.0. The correlation is presumed to be strong when the value is higher. The features of the indexes are indicated in Table 1.
Table 1: Features of each index
| Co-occurrence index | Features |
| Jaccard | Something with the large number of appearances by the independence whole the value are lower. |
| Simpson | If the number of appearances by independence is extremely small, the value becomes high even if the relationship is not strong. |
| Dice | When there is a great difference between two appearances, the lower value remains lower even if the relationship is strong. |
| Cosine | When both appearances are 0, those are ignored. |
It is necessary to use the appropriate index that expresses co-occurrences according to the information needed and based on the situation.
4.3. Basic expressions about the network analysis
In this section, we explain the concepts of centrality [13] and modularity [14], which are used in the network analysis. A network of relationships using goods of Electronic Commerce (EC) site is researched widely in recent years[15].
4.3.1. Centrality
Degree centrality:
The degree is the number of adjacencies for a node. Degree centrality is the most basic method of calculating centrality in which the nodes where the edges converge are deemed as having higher centrality. If we assume a node pk, the degree of pk, Degree(pk) :
n
X
Degree(pk) = a(pi,pk) (8)
i=1
where a(pi,pk) is 1 if and only if pi and pk are connected by a line; otherwise, it is 0.
Closeness centrality:
The closeness is measured by summing the geodesic distances from one node to other nodes. Closeness centrality is a method of calculating centrality in which centrality is higher when the closer the distance (therefore other nodes can be reached with a small step) is between the nodes. If we assume a node pk, Closeness(pk) :
n −1
X
Closeness(pk) = d(pi,pk) (9)
i=1
where d(pi,pk) is the number of edges in the geodesic linking pi and pk.
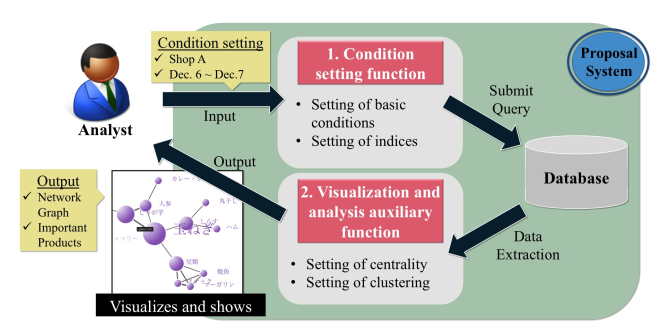 Figure 1: Image of the proposal system
Betweenness centrality:
The betweenness is based upon the frequency with which a node falls between pairs of other nodes on the shortest or geodesic paths connecting them. Betweenness centrality is a method of calculating centrality in which centrality is higher when more channels pass through a certain node. Therefore, this implies the importance of nodes acting as bridges between nodes in the network. If we assume a node pk, the betweenness of pk, Betweenness(pk) :
Xn Xn gij (pk)
Betweenness(pk) = (i < j) (10) i j gij
where gijg(ijpk) is the probability that node pk falls on a randomly selected geodesic linking pi with pk.
4.3.2. Modularity
The modularity is an effects function that is used for network and graph analysis. It is a numerical index of how appropriate a particular division of communities is from the network. For a division with g groups, we define a g × g matrix E whose component eij is the fraction of edges in the original network that connects vertices in group i to those in group j. Then, the modularity Q is defined as follows.
X X
Q = eii − eijeki (11)
i i,j,k
The modularity ranges from 0 to 1. Local peaks in modularity during the progress of the community structure algorithm indicate particularly good divisions of the network.
5. Proposal and implementation of the visualization system
5.1. Outline of the proposal system
In this study, we develop the web application by using the R Language’s package from Shiny [1]. We use R as a computational engine. For visualization, we use D3.js[2], which is a JavaScript library. We accumulate the analysis data, which is fixed in the database of MySQL[3]. In Figure 1, we show the analysis image of the proposed system. It will be possible to get the result through the web browser by mounting the system on a web server. We developed the system in the following environment.
- OS : Mac OS X Yosemite
- CPU : Intel Core i7 2.9GHz
- Memory : 8GB
- Language : R, JavaScript, SQL
In Figure 1, we explain the working of the proposed system. First, an analyst inputs a condition (e.g., shop name, periods) to analyze POS data. Next, a condition setting function defined in subsection 5.2 submits a query to the database based on the input conditions. Then, a visualization and analysis auxiliary function described in subsection 5.2 performs processing for visualization. This function calculates the centrality and clustering values of the network. Finally, this function delivers the network graph of the product relationships and important goods to the analysts.
5.2. Two functions of the proposal system
In this section, we are going to explain two functions of the proposed system outlined in Figure 1. The proposed system has the following two functions:
- Condition setting function
- Visualization and analysis auxiliary function
The condition setting function is a function to select dates, store numbers, and visualization indexes. With this function, users can interactively manipulate the data and enable free condition setting. The visualization and analysis auxiliary function is a function to set centrality and clustering and decide how to visualize. With this function, users can see the relationship between goods under the conditions set that they can set by themselves.
5.3. Details of the proposal system
For this study, we used POS data with the ID of a supermarket in Japan. POS data is the data of the sales of all goods in a store. POS data with the ID contains the customer information. By utilizing this data it is possible to grasp the customer behavior and improve the sales in a store. The data used in this study is obtained from 18 stores of a supermarket through one fiscal year in 2014. It consists of purchase data and personal attribute data.
- The purchase data
- Purchased goods, number of goods to be purchased, purchase price, purchase stores, purchase dates, and so on
- The personal attribute data
- Gender, age, and so on
In this study, we use purchase stores, purchase dates, days of the week, time zone, and receipt numbers for identifying the receipt of the purchased goods and purchased goods. Those are accumulated in a MySQL database.
The proposed system visualizes on the basis of the indexes of the relationship. The user can choose the index. The indexes are association rules that are used in simultaneous analysis, and co-occurrence indexes show the similarity between the sets. By using association rules and co-occurrence indexes, it is possible to obtain the rules from an enormous network. However, if the rules are also enormous, it is difficult to derive the useful rule just by visualizing. Generally, a threshold value of the index is set and the important rule is picked out. However, when the threshold is made too high, important information may not be even picked out. To address this problem, we provide the system with the function that sets the threshold freely. The system allows the analyst to freely set the dates, time zone, index, threshold value, and the number of clusters by using dynamic D3.js. Thereby, the analyst can easily inspect sets as the rule. Here, in Figure 2, we show the whole layout of the system and explain the operation of the system.
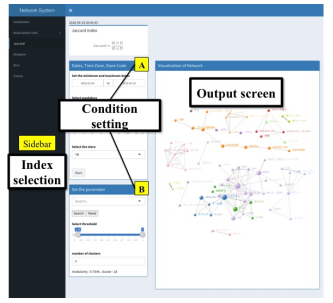 Figure 2: Screenshot of our proposal system
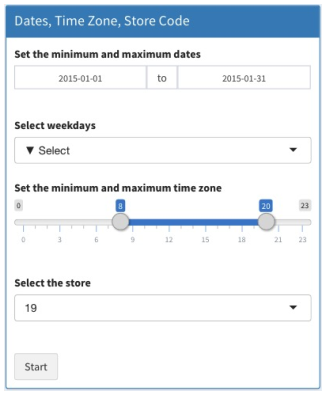 Figure 3: Screenshot of condition setting about dates, time zone, and store code
After the application starts, the user selects the index by clicking on “Sidebar,” as shown in Figure 2. The layout of the application is switched to the respective indexes on selection of the index.
In Figure 3, the condition of the analysis period, the time zone and the analysis target shop is set to extract the data from the database. First, it sets the analysis period that the analyst wants through “Set the minimum and maximum dates.” As shown in Figure 3, it sets the period from “2015-01-01” to “2015-0131” as 1 month. In this way, the analyst can set it by a week unit or a month unit as well as a single date and time. Next, the day of the week can be selected when necessary in the period. In Figure 3, day of the week setting is not being used because of “5Select.” Next, it sets the analysis time zone that the analyst wants in the period using “Set the minimum and maximum time zone.” In Figure 3, it sets the time zone from 8 to 20, which is the time zone from “8 a.m.” to “8 p.m.” in the period that is set from “2015-01-01” to “201501-31” as 1 month. It sets the target store through “Select the store.” In this way, the analyst can set the target store that the analyst wants. Finally, the series of processing steps starting from the extraction of the data to visualization is begun by clicking the button
“Start.”
Figure 4 depicts the way in which the threshold of the index and the number of clusters can be set. In addition to the condition that was set in Figure 3, it is possible to set condition setting for threshold and the number of clusters. As shown in Figure 4, the visualized goods can be searched using the “Search…” button. If the goods for which the search was conducted existed in the graph, only the relevant goods are indicated. Otherwise, it displays the message “The search goods did not exist in the visualization.” It sets the threshold of the selected index in “Set threshold.” In this way, it is possible to adjust the enormous network by choosing rules in the case of many goods. In Figure 4, the rules that are greater than 0.05 of Jaccard coefficient value are selected. A visualized network is divided into more than one cluster in “number of clusters.” The default number of clusters is 0 and this setting is calculated by using the modularity. In Figure 4, the number of clusters in the network is divided by the default setting, and the color of network is set automatically.
Here, the network is visualized based on the conditions set in Figure 3 and Figure 4. Then, the analyst can perform actions such as clicking, moving, and scaling of the network. In our proposed system, when the analyst clicks the target node, the system shows the relationship between the target node and the others that are related to the target node. When the analyst double-clicks the node, the network returns the original state. Figure 5 shows that all goods are interrelated, which is because goods that have no relationships at all are excluded beforehand. Though we excluded goods that have no inter-relationships from the system, there is a possibility that they are contributing to the sales. Figure 5 shows an example of the network visualization, which is based on the condition of the purchase history from “8:00” to “20:00” of January at a particular store. The index is the Jaccard coefficient and the threshold is 0.05. The color of the network is divided by the modularity. And we focus on two partition parts in Figure5.
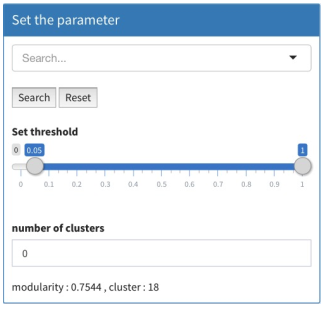 Figure 4: Screenshot of condition setting about threshold of the network index and the number of clusters
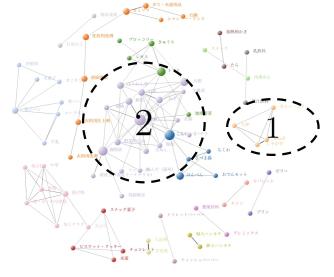 Figure 5: An example of the output screen
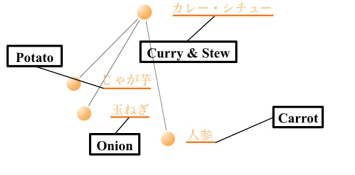 Figure 6: 1st partition part
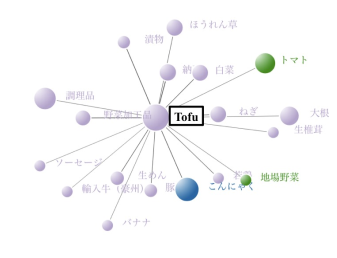 Figure 7: 2nd partition part
Figure 6 shows the first part of the partition in Figure 5. This figure shows that “Curry & Stew” is related to “potato,” “onion,” and “carrot.” This indicates that it was possible to extract the typical ingredients from the network for curry and stew in Japan.
And Figure 7 shows the second part of the partition in Figure 5. This figure shows that “Tofu” is related to many goods and it is also involved in the other community goods. From this, it turns out that “Tofu” is a goods to be a hub that has relationships with various goods in supermarkets. When the particular goods extracted have relationships to many other goods and the threshold is high, they can indicate the core goods in the supermarket. Sales can be promoted by cross-selling with the core goods in the sales strategy.
Visualizing in this manner will help create the sales strategy and the analyst can easily understand the relationships between the normal goods and the core goods in an enormous network.
6. Experimental evaluation
In this section, we describe the evaluation of the system. We conducted an experimental evaluation based on a semi-structured interview. We set evaluation criteria beforehand to get the evaluation of the system. The evaluation criteria are shown below:
- Quality of visualization (Is the relationship between the goods captured?)
- Interactive processing (Is condition setting sufficiently interactive?)
- Real-time processing (Is it used for a decisionmaking at a site?)
In the evaluation experiment, we identified the target analyst who had experience in management and working at a supermarket. However, she had limited knowledge of data structures and programming. The system was used by the analyst and we received the evaluation for each evaluation criteria, as shown in Table 2. In addition, we received the feedback on possible improvements in the system, as shown in Table
3.
Table 2: Evaluations
| No. | Evaluation |
| 1 | Relationship between goods that tend to be bought at the same time is classified by colors. Therefore, the visualization is easy to understand and the appearance of the visualization is dynamic and interesting. |
| 2 | User can interactively perform various condition settings on the system and it is possible to visualize it using various patterns. Best of all, it can be expected to shorten analysis hours because there is no necessity to process the data by each condition setting. |
| 3 | It enables real-time analysis if the system is equipped with a server and the environment is adequately equipped. For this reason, the headquarters can cooperate and do quick strategic planning as well as on-site judgment. |
Table 3: Areas of improvement
| No. | Improvement points |
| 1 | Calculation speed and large scale database |
| 2 | Addition of the function for actual use |
| 3 | Documents for users are required |
Based on the evaluation as per Table 2, we can conclude that the visualization display was found to be easy to understand. This is because of the appropriate grouping of goods, which makes it easier to understand the relationships between goods. The evaluation also showed that analysis hours could be reduced because there is no need to process the data by each condition setting. The proposed system enables realtime analysis if the system is adequately equipped. From the evaluation, it can be inferred that the proposed system is effective in terms of reducing the burden on the analyst for data processing.
We also studied the suggestions for improvement, as described in Table 3. Admittedly, the calculation speed of the system is inferior because of the usage of R script instead of compiler languages such as C and Java. The computational complexity is proportional to the amount of data and as the data becomes big, it takes more time to analyze it. For example, if the relationship between the goods is visualized for a 1-month time period, the operation becomes difficult and slow. Therefore, it is necessary to improve the interactive operations in such cases. The system is definitely just a prototype. Faster calculation time can be achieved by improving the environment and introducing compiler languages.
The lack of sufficient functions pointed out in Table 3 arises from the business experience at a supermarket. In particular, decisions such as elimination of the node (goods) that an analyst deemed unnecessary, multi-selection of stores, and condition setting
of the category of goods, etc. are planned for improving user convenience when the actual system is introduced. Therefore, the problem will be resolved by adding the function to the interface.
The third area of improvement in Table 3 points toward the necessity of a document explaining the analysis methods and usage. Although the proposed system can visualize the relationships between goods using various methods, it is necessary to take into account the kind of scene for each visualization indexes can be used. For example, it is necessary to demonstrate and recommend to the user that degree centrality should be used to extract goods that are purchased at a high frequency, such as bargain items.
7. Conclusion and future studies
In this study we proposed a system that allows users to visualize relationships between goods while manipulating interactively. Data extraction, processing, calculation, and visualization are automated even when an analyst does not have knowledge of programming, and an interface has been developed. We made it possible to freely set the threshold settings such as association rules and co-occurrence indexes. In addition, the system can support the proposal of real-time sales.
In this study, we used association rules and cooccurrence indexes to select the rule from a network. However, we could not demonstrate how the rule is useful by extracting with indexes. Therefore, we need to clarify index selection, which is a key topic for future studies. In the experimental evaluation of this study, some improvement areas were pointed out. In the future, it is necessary to improve and impart various functions in order to make the proposed system easier to use. Moreover, we could not obtain the quantitative evaluation about the system during the experiment, which is another necessary topic that needs to be explored.
- M. J. Shaw, C. Subramaniam, G. W. Tan and M. E.Welge : “Knowledge Management and Data Mining for Marketing,” Decision Support Systems, Vol. 31, Issue. 1, pp. 127-137, 2001.
- M. S. Yadav, K. Valck, T. H. Thurau, D. L. Hoffman and M. Spann : “Social Commerce: A Contingency Framework for Assessing Marketing Potential,” Journal of Interactive Marketing, Vol. 27, Issue 4, pp. 311-323, 2013.
- M. Shirota : Impact of Big Data, TOYO KEIZAI INC., pp22- 26, 2012 (in Japanese).
- K. Hashimoto, K. Otake, and T. Namatame : “Proposal of the Visualization System of Simultaneous Purchasing Relation using POS Data with the ID of the Supermarket,” Future Technologies Conference (FTC) pp.610-615, IEEE, 2016, https://doi.org/10.1109/FTC.2016.7821668.
- P. Holme, C. R. Edling and F. Liljeros : “Structure and Time- Evolution of an Internet Dating Community,” Social Net- work, Vol. 26, pp. 155-174, 2004.
- K. Yuta, N. Ono and Y. Hujiwara : “Structural Analysis of Human Network in Social Networking Services,” Trans- actions of Information Processing Society of Japan, Vol.43, No.3, pp.865-874, 2006.
- F.Toriumi, K.Ishida and K.Ishii : “Proposal for a Network Growth Model of Social Network Service,” IEICE Transactions on Fundamentals of Electronics, Communications and Computer Sciences of Japan, Vol.J93-D, No.7, pp.1135-1143, 2010.
- K.Tanaka and Y.Kadono : “A Study on Development Organizations for Information Systems through Network Analysis,” Proceedings of Autumn 2015 National Conference Presentation Competition of JASMIN.
- A. Ito, T. Yoshikawa, T. Furuhashi, R. Ikeda, and T. Kato : “Search of Interesting Rules in Visualized Association Rule Mining,” Proceedings of 26th Fuzzy System Symposium, pp.684-689, 2010 (in Japanese).
- Y. Matsuo, H. Tomobe, K. Hashida, H. Nakashima and M. Ishizuka : “Social Network Extraction from the Web information,” Transactions of the Japanese Society for Artificial Intelligence, Vol.20, No.1, pp.46-56, 2005 (in Japanese).
- T. Pang-Ning, M. Steinbach, K. Vipin. : “Association Analysis (Chapter 6) : Basic Concepts and Algorithms,” Introduction to Data Mining. Addison-Wesley, 2005.
- C.D. Manning and H. Schutze : Foundations of Statistical Natural Language Processing, The MIT Press, London, 2002.
- L. Freeman : “Centrality in Social Networks Conceptual Clarification,” Social Networks, Vol.27, No.1, pp.215-239, 1979.
- M.E.J. Newman : “Detecting Community Structure in Networks,” The European Physical Journal B, Vol.38, Issue 2, pp.321-330, 2004.
- K. Otake, Y. shinozawa, A. Sakurai, T. Uetake, M. Oka and M. Suzuki : “Examination of the Effect of Social Login Through Analysis of User’s Purchasing Tendency —Case study of golf portal site—,” 12th Annual IEEE Consumer Communications and Networking Conference (CCNC), pp.617-618, 2015.