An Optical-based Fingertip Force Sensor

Adv. Sci. Technol. Eng. Syst. J. 3(5), 23–27 (2018);
 DOI: 10.25046/aj030504
This work introduces the design and prototype development of a novel optical-based fingertip force sensor, which is integrated in a bio-mimetic finger for robotic and prosthetic manipulation. Given the optical nature of the sensor, the proposed device is free of any electrical and metal components. Accordingly, the design improves manipulation of objects with high electromagnetic compatibility performance, reducing sensor’s susceptibility in the presence of these disturbances. The sensor has inherently high SNR and low-power consumption. The concept of using simplified and low cost optical based fingertip force sensor for bio-mimetic anthropomorphic fingers has not been widely implemented so far. The sensor is based on a cantilever design combined with a couple of fiber optics and a reflective surface, it is integrated on the distal phalange of a novel bio-mimetic and anthropomorphic robotic finger. Sensor design was performed and optimized throughout a 3D printing process and Finite Element Analysis. The sensor’s sensitivity (0.098V/N), resolution (0.01N), accuracy (3% of full scale output (FS)) and hysteresis (9.24% of FS) were characterized through a calibration processes. Various applications like surgical manipulation or handling in harsh environment (i.e. high voltage, high temperature and explosive environments) will benefit from the proposed sensor’s performance, reliability, simplicity and bio-compatibility.
1. Introduction
Many multi-fingered robotic hands with multi-axial force and torque sensors have been developed. These multi axial force sensors usually employ strain gauges driven by electrical circuitry and are made of metal components [1]. The use of sensors with electrical circuit and metallic components increases the sensor’s vulnerability to electrical or magnetic fields [2]. In contrast with multi-axial force sensors based on strain gauge technology, sensors designed based on the use of fibre-optics has several benefits including simplified design, immune to electromagnetic fields, miniaturization, low-level noise, has low power consumption and no need for any electronic noise filtering [3]. In this context, previous research has already proposed interesting applications on the development of force and tactile sensors with the use of metal free components and biologically friendly solutions which, moreover, will also guarantee compatibility in medical scenarios [2-3].
This work has been proposed due to the following limitation observed from current fingertip force measuring systems:
- Complex tactile system design
- High electromagnetic vulnerability
- Unavailability of simplified and low cost optical based fingertip force sensor design forbiomimetic anthropomorphic fingers.
The concept of using simplified and low cost optical based fingertip force sensor for biomimetic anthropomorphic fingers has not been widely implemented so far. The proposed fingertip force sensor takes advantage of the use of fibre-optics and is integrated in a biomimetic finger in order to get tactile information during grasping and manipulation of objects. The objective of this work is designing optical based fingertip force sensor. The design involves only the distal phalange of the finger. The phalange has the same shape, arrangement, length and proportion as its human counterpart [4].
2. Sensor Design
To exactly imitate the size and shape of the human index finger bones, the laser-scan model of human finger was used. The Stereo Lithography (STL) format of the model was first imported into Autodesk123 (Autodesk, Inc.). In this stage the original file was further modified by introducing a cantilever beam design, holes for placement of optical fibre and grove between sensing head and reflective surface (Figure 1).The design involves optical fibre, mirror and built-in cantilever beam [2]. After modifying the file, it was further analysed in Autodesk Mesh mixer to reduce the number of meshes [5] in the model. The aim of mesh reduction was to easily simulate Finite Element Analysis (FEA) of the model in Solid Works (Dassault Systèmes Solidworks Corp) [6]. Finally the model with reduced mesh (Figure 2) was exported to Solid Works and the FEM analysis was performed. The standard parameters of phalanx of index finger [7] are shown in Table 1.
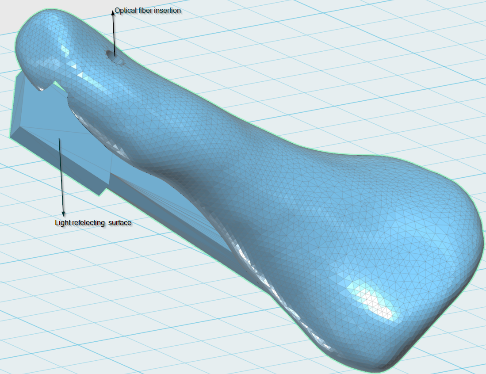 Figure 1: Built-in cantilever beam and optical fibre holes: the wired fibre will be inserted through the hole in order to design the tactile sensor (see also Figures 4 and 5)
Table 1: Parameters of the index bio-mimetic finger: length and weight of the index finger phalanges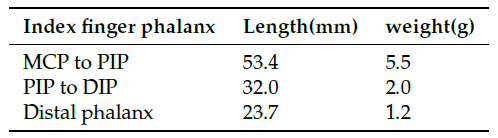
2.1. FEA Simulation
The purpose of FEA simulation is to ensure how much amount of force the fingertip can resist without undergoing plastic deformation. First geometry or shape of finger phalanx was defined. Next, an appropriate material (i.e. Acrylonitrile Butadiene Styrene, ABS) for the model has been selected. Mechanical properties [8] of ABS have been used as input for the FEA simulation (Table 2).
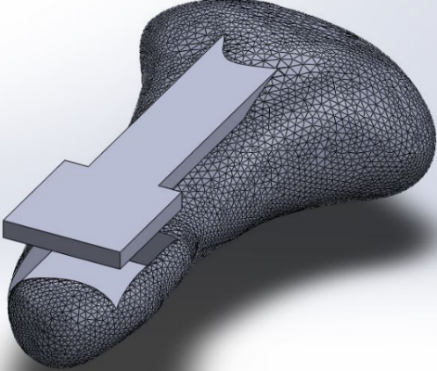 Figure 2: Reduced mesh of the distal phalanx of the index finger: the mesh was distributed along the fingertip in order to perform the FEM
Table 2: Mechanical Properties of the ABS material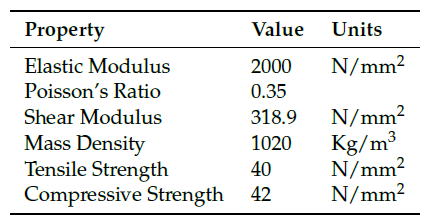
The mean maximum external finger force (i.e. 5[N]) for static prehension is applied to the phalanx of index finger [9]. Finally FEA analysis of the 3D model been performed. The description of how the applied forces spread throughout the phalanx is illustrated in Figure 3.
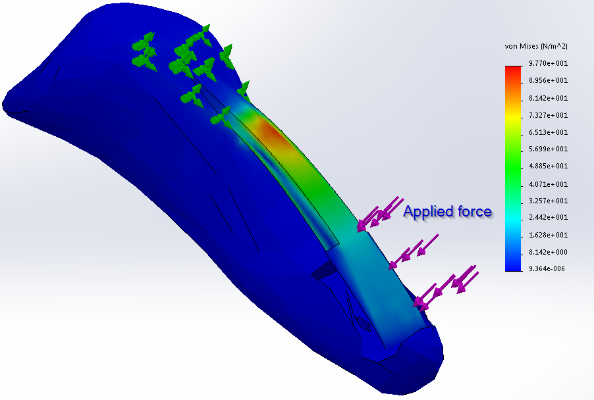 Figure 3: FEM simulation of the cantilever (ABS material, load of 5[N]): force is applied to the cantilever in order to estimate Von Mises stress
The red portion of the simulation indicates high stress concentration areas and the blue part shows unloaded or stress free region of the phalanx Figure 3. According to the finite element simulation result the maximum stress applied on the beam due to the applied force is much lower than, the yield strength of ABS. This means the applied force doesn’t produce mechanical failure or damage to the built in cantilever beam of the phalanx and it shows the design is safe.
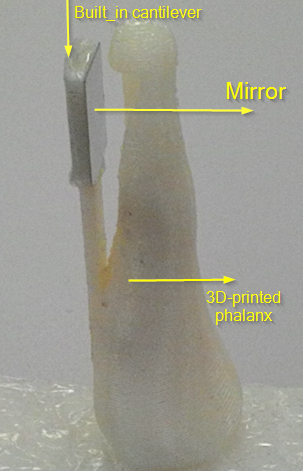 Figure 4: 3D printed distal phalanx of index finger: the mirror allows measuring the cantilever flexion according to the applied load and therefore to transduce such a flexion into a modulation of the intensity light provided through the fibre (see also Figures 1 and 5)
2.2. 3D Printing and sensor component integration
After the FEM simulation, the real distal phalanx of index finger was fabricated using HP 3D printer. The phalanx has built-in cantilever beam used for positioning light reflective surface. The movement of this beam moves the mirror and modulates the intensity of reflected light back to the receiving terminal of the optical fibre. The 3D printed phalanx is shown in the Figure 4.
2.3. Working principle of the sensor
The light beam is projected on a moving cantilever beam reflective surface by fibre optic cable (i.e. the emitter), a fraction of the reflected beam is received by the second optic fibre (i.e. the receiver) that are closely located [1] (Figure 5). The reflected light intensity is a function of the amount of force applied at the fingertip. The applied force changes the distance between the reflective surface and the sensing head of optical fibre cables. This change modulates the intensity of reflected light and produces different voltage outputs. The amount of output voltage from the sensor is directly proportional with the force applied at tip of the phalanx.
3. Sensor Calibration
To use the designed sensor, the sensor has to be calibrated. The calibration should convert force applied to the fingertip into corresponding voltage [2].
3.1. Calibration set-up
The experimental consists of a Keyence FS-N11MN Digital Fibre Optic Amplifier, IIT-FT17 force (IIT-FT17 force & torque sensor), which is combined with a torque (F/T) sensor: sensor data are acquired via an NI USB-6000 Data AcQuisition (DAQ) board (National Instruments Inc.) while the sensor is mounted on a mechanical vice as it is reported in Figure 6. The phalanx of the finger is fixed on the vice, while the force sensor is physically connected with the moving element of the vice. This solution allows to manually modulate the effective applied force to the phalanx, i.e. to the sensor. During the experiments, the electrical output of the FS-N11MN amplifier is sent to an analogue pin of the DAQ. Then, a LabView (National Instrument, NI) graphical interface captures the output signal in real-time, while another program – developed in C++ Programming Language – acquires the force sensor outputs. This further measurements are processed via another LabView mask. These data (i.e. output of the two force sensors) are saved and processed.
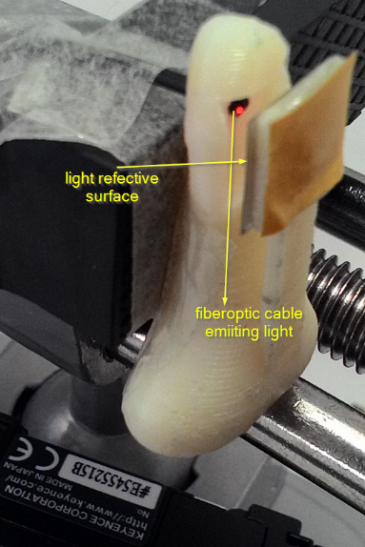 Figure 5: Fingertip fibre optic cable and mirror arrangement (see also Figures 1 and 4)
3.2. Calibration procedure
Different trials were performed while applying force to the sensor and releasing the load, thanks to the linear guide which was provided by the vice in Figure6. The IIT-FT17 force and torque (F/T) sensor was used to compare the reading vs. the fibre-optic sensor and therefore calibrate this latter one. Different values of force were applied. Precisely, a sequence of 15 values of forces were applied during the ‘loading’ and ‘unloading’ stages. The NI DAQ board was used to acquire and save the value of the signals (i.e. the voltage) from the KEYENCE amplifier and the reference F/T sensors. Signals were acquired every 2 ms, namely at a sampling frequency of 500 Hz.
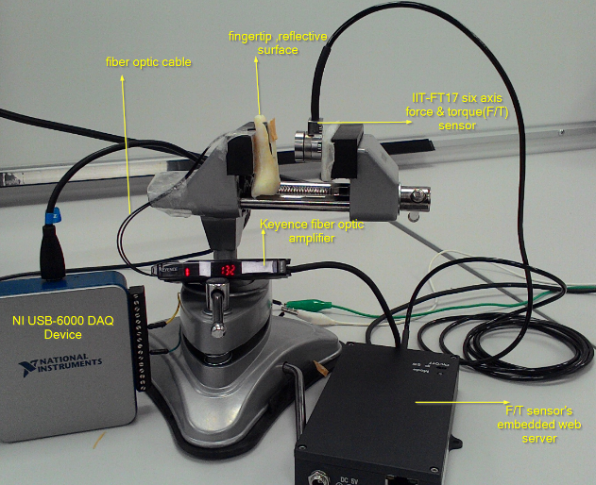 Figure 6: Force sensor calibration setup: load is applied to the fingertip and sensor output is measured accordingly (see the details on Paragraph 3)
4. Sensor Performance
4.1. Regression analysis
Following the experiment and data acquisition, all information were re-shaped into a data base format to be analysed and to identify a proper calibration between the applied load and the voltage output of the sensor. According to a preliminary qualitative analysis of the data, linear regression method was adopted in order to find a proper fitting of the data [10]. The electrical signal was correlated with the applied force on the finger, finally, a fitting curve was obtained (Figure 7). Here, the linear regression equations are reported:
V = 0.098 × F + 1.10 (1)
F = 10.22 × V – 11.29 (2)
where V and F are representing the sensor signal and applied force, respectively.
Thanks to the Equation (2), the effective force can be calculated, provided that the output voltage of the sensor is measured. Moreover, these equations define the sensor sensitivity, namely 10.22 N/V [8]. A regression analysis shows that the relationship between the force and the output of the sensor is quite linear with a coefficient of determination (R2 = 0.9739): more than 97.39 % of the electric voltage is due to the load which is applied to the fingertip. An analysis on the standard deviation of the prediction of the value of the force provides a result of 1.86%: a small deviation occurs between the data vs. the actual values.
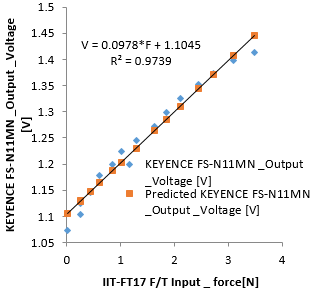 Figure 7: Calibration curve of force sensor performed with a regression analysis (see details in Paragraph 4)
4.2. Sensor accuracy
In this context accuracy is measure of closeness between actual sensor readings and its corresponding predicted value. The sensors accuracy is measured by its relative and absolute errors. The sensor relative error is the difference between the actual voltage reading obtained from KEYENCE FS-N11MN Fibre Optic Sensor and the corresponding predicted voltage value obtained from fitted linear equation during the calibration procedure. Table 4 shows the actual and predicted voltage values. Based on the data given on Table 4 percentage of sensor’s maximum relative error is 3.1097%. This means the sensor introduces maximum of ±0.03109 error from each of its readings and is indication of sensors better accuracy.
Table 3: Results of the Regression Analysis which brought to the linear calibration expressions (see details in Paragraph 4)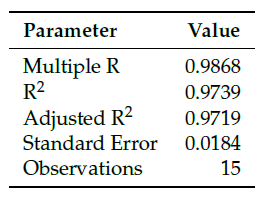
4.3. Sensor range & resolution
The designed sensor works over an input range between 0[N] and 4[N]. If exceeded the specified design range ,it result in permanent damage or destruction of sensor. The corresponding output range of the sensor is between 1.1045 [V]and 1.6[V].
The smallest input force value the senor can detect [11] is 0.01[N]. In other words the sensor can discriminate input force values above 0.01[N].
4.4. Sensor sensitivity & saturation
It is change in output voltage of the designed sensor per unit change in input force. The slope of fitted linear regression equation (i.e. Equation 1 is sensitivity [11] of the sensor (i.e. 0.0978 V/N or 10.2249 N/V).
Table 4: Actual and predicted reading of the voltage outputs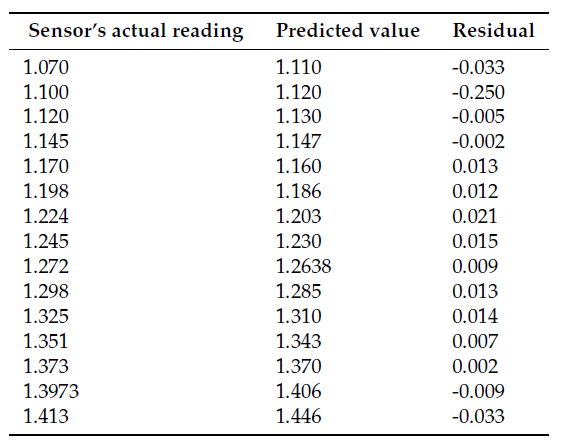
As the input force applied to the fingertip increases the distance between optical fibre and reflective sensor decreases and sensor’s output voltage increases. Beyond its input range (i.e. 4[N]) the sensor reaches its saturation limit. This means, any further increment of input force will no longer increase [11] output voltage. Sensor’s saturation emerges from its physical construction.
Table 5: Voltage outputs of the ‘loading’ and ‘unloading’ stages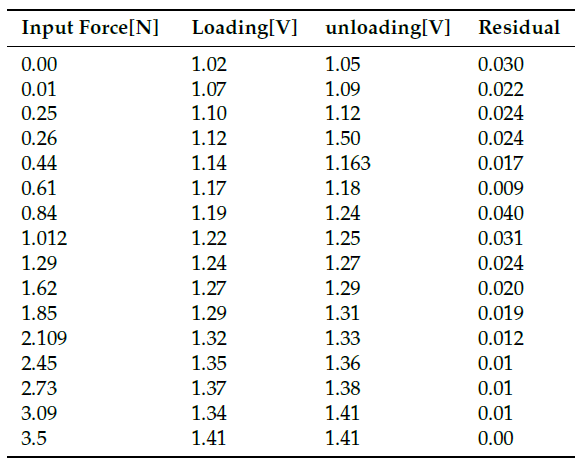
4.5. Zero offset & mechanical hysteresis
The zero offset is the amount of deviation in sensor’s output voltage from the exact value at the lowest point of the measurement range. Zero offset can be expressed in signal units (i.e. Volts), or as a percentage of the full scale range. As it is shown in Equation (1) from the linear regression, the zero offset value for the designed sensor is 1.1045[V]. since the input range is from 0 to 4[N] and output range is 1.1045 [V] to 1.6[V], the zero offset tolerance of the sensor is 1.1045[V] ± 0.1238[V].
Mechanical hysteresis can affect the sensor performance, due to the elastic-plastic deflection of the cantilever beam affecting not only the instantaneous application of the load, but also the previous application or history. Table 5 shows the voltage outputs during ‘loading’ and ‘unloading’.
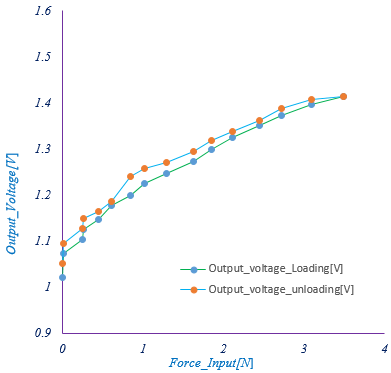 Figure 8: Sensor hysteresis curve
The data of Table 5 were collected during the calibration processes. These values are also plotted within Figure 8. According to these output, the ‘loading’ and ‘’unloading’ curves provide different values of the sensor output values vs. same value of the applied force (i.e. the input). Therefore, the percentage of the hysteresis van be calculated as the ratio of the maximum difference between the output values curve and sensor range. The effective percentage of the maximum hysteresis error is 9.24%, namely each sensor measurements during unloading will be 9.24% greater from each loading measurements [11]. A summary of the overall sensor performance parameters is reported in Table 6.
Table 6: Summary of the performance parameters of the sensor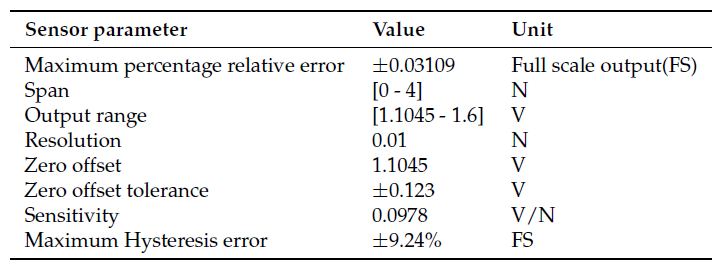
5. Conclusion and Future work
This works presented simplified design and integration of an optical force sensor to measure external applied force to the biomimetic fingertip during physical interaction. The FEA analysis of the phalange has been conducted to ensure that how much amount of force the fingertip can resist without undergoing plastic deformation. Then the actual finger has been fabricated using HP 3D printing machine. The structural components of the sensor (i.e. cantilever beam, reflective surface and the two optical fibre) were integrated at the fingertip. Sensor calibration and linear regression analysis has been conducted. The regression analysis shows high correlation between applied force and corresponding voltage output from the digital fibre optic sensor. The sensors performance parameters have been briefly addressed. Various applications like surgical operation, manipulations in area of high electromagnetic noise can be benefited from the proposed sensor’s performance (i.e. sensitivity, accuracy, linearity and resolution) and its EMC design. As a future work the structural components and arrangement of the sensor can be further optimized to get a better performance and improved sensor characteristics. The deployment of optical fibre, shape of the reflective surface and structure of built-in cantilever beam can be further modified and improved.
Acknowledgment
This paper is an extension of work originally presented in at IEEE Sensors 2017 [12].
- Konstantinova, J, Stilli, A, Althoefer, K, Force and proximity fingertip sensor to enhance grasping perception. Intelligent Robots and Systems (IROS), 2015 IEEE/RSJ International Conference on. IEEE, 2015, 2118–2123.
- Noh, Y, Sareh, S, Back, J, Würdemann, HA, Ranzani, T, Secco, EL, Faragasso, A, Liu, H, Althoefer, K. A three-axial body force sensor for flexible manipulators. Robotics and Automation (ICRA), 2014 IEEE International Conference on. IEEE, 2014, 6388–6393.
- Noh, Y, Secco, EL, Sareh, S, Würdemann, HA, Faragasso, A, Back, J, Liu, H, Sklar, E, Althoefer, K, A continuum body force sensor designed for flexible surgical robotics devices. Engineering in Medicine and Biology Society (EMBC), 2014 36th Annual International Conference of the IEEE. IEEE, 2014, 3711–3714.
- Xu, Z, Todorov, E, Design of a highly biomimetic anthropomorphic robotic hand towards artificial limb regeneration. Robotics and Automation (ICRA), 2016 IEEE International Conference on. IEEE, 2016, 3485–3492.
- Salinas, R, 3D Printing with RepRap Cookbook; Packt Publishing Ltd, 2014.
- Akin, JE, Finite element analysis concepts: via SolidWorks; World Scientific Publishing Co Inc, 2010.
- Xu, Z, Kumar, V, Matsuoka, Y, Todorov, E, Design of an anthropomorphic robotic finger system with biomimetic artificial joints. Biomedical Robotics and Biomechatronics (BioRob), 2012 4th IEEE RAS & EMBS International Conference on. IEEE, 2012, 568–574.
- Callister, WD, Rethwisch, D.G. Materials science and engineering; Vol. 5, John Wiley & Sons NY, 2011.
- Radwin, RG, Oh, S, Jensen, TR, Webster, JG, External finger forces in submaximal five-finger static pinch prehension. Ergonomics 1992, 35, 275–288.
- Draper, NR, Smith, H, Pownell, E, Applied regression analysis; Vol. 3, Wiley New York, 1966.
- Fraden, J, Handbook of modern sensors; Vol. 3, Springer, 2010.
- Agidew TF, Secco EL, Maereg AT, Reid D, Nagar AK, Fibre Optic-Based Force Sensor for Bio-Mimetic Robotic Finger, IEEE Sensors 2017, Glasgow, UK.
No related articles were found.