Design Optimization of Open Office Building Form for Thermal Energy Performance using Genetic Algorithm

Adv. Sci. Technol. Eng. Syst. J. 6(2), 254–261 (2021);
 DOI: 10.25046/aj060228
Consideration of building energy performance in the early stage of the design process is very important to help minimizing energy consumed by the built environment. Therefore, help in minimizing energy crisis problem. Optimization of building form and orientation at the early stage of the design process can save a significant amount of energy consumed by the building. This paper proposes an annual thermal energy performance-based form making (EPBFM) method that generates numerous design configurations and tests their annual thermal energy performance till it reaches an optimal solution. The proposed workflow uses 3d parametric modeling program, energy simulation program, and genetic algorithm. A case study of an open plan office building is used to evaluate the proposed workflow in three different cities with different climates, Cairo, London, and Chicago. Building’s contexts were not considered in order to highlight the change of the building form and orientation caused due to the change in climate conditions. Then, Scatterplots were developed to test the impact of each dynamic parameter on thermal energy use intensity (EUI). Compared to the initial square shaped building, optimization results showed that thermal EUI decreased by 22.76%, 29.7%, and 19.2% in Cairo, London, and Chicago, respectively. Manipulation of building area along one axis and each floor area along the other axis proved to have the highest positive impact in decreasing thermal EUI.
1. Introduction
The built environment continues to magnify the energy crisis problem. HVAC systems are responsible for a significant percentage of the total energy used in buildings [1]. Building form and orientation decided at the early stages of the design process have the highest percentage of energy saving potential of a building [2]. However, there is still a lack in studies that consider manipulation of building form and orientation for energy performance at the early stage of the design process.
Through reviewing journal articles that optimize building form, and/or orientation for energy performance, we found that some research focused on the form representation without considering a certain type of building program. For example, [3], and [4] optimized a single zone cubic form to generate irregular complex forms through the manipulation of building points. The research highlighted the importance of generating complex forms to enhance building energy performance, as the basic forms such as cube and cuboid are too strict. The purpose was to minimize energy use in Philadelphia in the first study, and in three different climates, namely hot, cold, and temperate in the second one. In [5], the authors presented a form representation of a single zone free form that was optimized for thermal performance in fourteen different cities with different local climate condition.
There are also studies that were performed considering different types of buildings. Example of the research performed on office buildings, [6] optimized rectangular shaped five-floor office building in Milan, North Italy. The research manipulated the two dimensions of the whole building, and its orientation along with envelope and HVAC operation parameters. In [7], the authors optimized a rectangular shaped small single-story office building with a pitched roof in Miami, Atlanta, and Chicago. The form dynamic parameters manipulated were the building depth and the roof ridge. In [8], the authors optimized an open plan rectangular office building consists of three floors in Los Angeles, Helsinki, Mexico City, and New York City. The form dynamic parameters were the addition of corners to the whole building, and the addition or elimination of a courtyard. Orientation was also manipulated in all cases except for Los Angeles. Examples of the research performed on residential buildings, [2] optimized two floor building with four rooms in each floor in Chicago, Phoenix, and Oporto. In [9,10], the authors considered Lisbon, Portugal. In [11], the authors generated twelve alternatives of a single level, and a two-level houses in Coimbra, Portugal. In [12], the authors optimized two slab buildings attached to a corner tower in four warm temperate climate cities in Argentina, and Spain. In [13], the authors optimized rectangular multi-apartment house with a central staircase in Budapest, Hungary. Examples of the research performed on school buildings, [14] optimized one class room unit and its’ open corridor, one class room unit and its’ enclosed corridor, two class rooms and their corridor. In [15], the authors optimized ceiling height and envelope of a single classroom unit. Examples of research performed on sports buildings are found in [16], and [17]. In [12], the authors performed research on rural tourism buildings and considered four warm temperate climate cities in Argentina, and Spain. Many studies that optimized building envelope for energy performance exist but studies that optimize building form for energy performance are still limited and need more contributions to include varieties of form representation, and different cities with different local climate conditions.
This paper develops a thermal EPBFM optimization method for a three-floor open plan office building in Cairo, London, and Chicago. The building is square shaped in its initial state, and each of the three floors changes its shape to squares and rectangles with different sizes during optimization. The surroundings were not considered to be able to understand the change that occur to the building form and orientation due to the change in local climate conditions. This method allows for the optimization of building form and orientation parameters using genetic algorithm to enhance thermal energy performance of the building. After the optimization, numerous alternative design configurations are generated and ordered in reference to their thermal energy performance.
2. Methodology
The EPBFM optimization method was applied to an open office building in three different cities with different climate conditions, Cairo (Arid climate), London (Temperate climate), and Chicago (Cold climate). The surroundings were not considered to be able to understand the change that occur to the building form and orientation due to the change in local climate conditions. It is assumed that the initial building form is a three-floor squared building where each floor represents an open office plan with 3m height. The initial building is 10 * 10 m, with total built up area 300 m2, and total volume 1296 m3(figure 1.).
The usage of Grasshopper along with a 3d program in the early stage of the design process is very important because non-programmers can deal with it easily [18]. Grasshopper [19] with its user-friendly graphical user interface (GUI) is used to develop the thermal EPBFM optimization method that can evaluate the thermal energy performance of numerous architectural form design alternatives in the early stage of the design process. This workflow optimizes the form and orientation of the initial squared building form to generate diversity of building design configurations and test their thermal performance. The initial form is then used as the base case to compare results of new generated forms to it. EnergyPlus is used to perform the simulation, and each floor is considered as one thermal zone (open office space) in the thermal energy simulation. The workflow consists of the following phases:
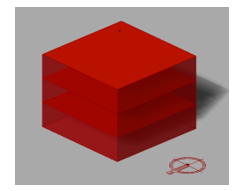 Figure 1: Initial squared building form, with the north direction presented in the bottom right. (north-west view)
2.1. Model architectural building form
Rhinoceros 6 [20] and its plug-in software Grasshopper were used to model the architectural building form and to assign its different dynamic and static parameters. The same building form and orientation dynamic parameters were assigned to each of the three cases. While building envelope parameters such as external wall and roof materials were fixed with specific values for each of the three climates to suit specific local climate conditions. Table.1 and 2 represents building static parameters. Table 1 represents the external wall, window, and roof name and U- values, while table 2 represents the external walls, and roof materials.
Table 1: Building parameters fixed within each climate.
| Static parameters | Cairo
climate zone 2B |
London
climate zone 4A |
Chicago
climate zone 5A |
| External walls
|
CBECS 1980-2004 Exterior Wall MASS, Climate Zone 2B | CBECS 1980-2004 Exterior Wall MASS, Climate Zone 4A | CBECS 1980-2004 Exterior Wall MASS, Climate Zone 4C-5A |
| External walls U-value | 3.573262 (W/m2-K) | 0.758753 (W/m2-K) | 0.620546 (W/m2-K) |
| Window
|
ASHRAE 189.1-2009 EXTWINDOW CLIMATEZONE 2B | ASHRAE 189.1-2009
EXTWINDOW CLIMATEZONE ALT-RES 4-5 |
ASHRAE 189.1-2009
EXTWINDOW CLIMATEZONE ALT-RES 4C-5A |
| Glazing U-value | 13.833333 (W/m2-K) | 4.433333 (W/m2-K) | 4.433333 (W/m2-K) |
| Roof
|
CBECS 1980-2004 EXTROOF IEAD CLIMATEZONE 2B | CBECS 1980-2004 EXTROOF IEAD CLIMATEZONE 4A | CBECS 1980-2004 EXTROOF IEAD CLIMATEZONE 5A |
| Roof U-value | 0.274975 (W/m2-K) | 0.351549 (W/m2-K) | 0.313911 (W/m2-K) |
Table 2: Building parameters fixed within each climate.
| Static parameters | Cairo
climate zone 2B |
London
climate zone 4A |
Chicago
climate zone 5A |
| External walls materials
|
1IN Stucco
8IN CONCRETE HW RefBldg Mass NonRes Wall Insulation-0.43 1/2IN Gypsum |
1IN Stucco
8IN CONCRETE HW RefBldg Mass NonRes Wall Insulation 1.47 1/2IN Gypsum |
1IN Stucco
8IN CONCRETE HW RefBldg Mass NonRes Wall Insulation-1.76 1/2IN Gypsum |
| Roof materials
|
Roof Membrane
IEAD NonRes Roof Insulation-3.83 Metal Decking |
Roof Membrane
IEAD NonRes Roof Insulation-3.03 Metal Decking |
Roof Membrane
IEAD NonRes Roof Insulation-3.38 Metal Decking |
After modeling the building form and deciding its dynamic parameters (genes). The number sliders of the chosen dynamic parameters are connected to the genetic algorithm optimizer that changes sliders values in each iteration. The building form and orientation dynamic parameters are explained in Table.3 with their number, values, and values’ units. The height of each floor is allowed to have two values only 3m, or 6m. The building is allowed to expand its area gradually in the east-west direction. In addition, each floor is allowed to expand its area gradually in the north-south direction. Eleven values were assigned to both expansion dynamic parameter. These values start with the base case value (1 %) which is equal to 10m and ends with 2% which mean that the length of the building is multiplied by two to become 20 m. Finally, the whole building is allowed to rotate gradually anti-clock wise with 21 values that starts with 0 radians and ends with 2 radians to avoid repetition of forms as the building is symmetrical on both north-south, and east-west axes.
Table 3: Form and orientation dynamic parameters for the three climate zones. Table presents north-west bird eye perspective
| Form dynamic parameters | No. of parameters | Attributes for each parameter. (unit) |
| Building height | 1
|
3 (base case), and 6. (Meters) |
| Building expansion | 1 | 1(base case),1.1,1.2,
1.3,1.4,1.5,1.6,1.7,1.8, 1.9, and 2. (%) |
| Floor expansion | 3 | 1(base case),1.1,
1.2,1.3,1.4,1.5,1.6,1.7,1.8,1.9, and 2. (%) |
| Building rotation in the anti-clock direction. | 1 | 0 (base case), 0.1, 0.2, 0.3, 0.4, 0.5, 0.6, 0.7, 0.8, 0.9, 1, 1.1,1.2,1.3,1.4,1.5,
1.6,1.7,1.8,1.9, and 2. (Ra dians.) |
2.2. Simulation and optimization
In [21], the authors plug-ins for Grasshopper are used to add physical properties of building envelopes, to connect to energy simulation engine EnergyPlus, and to insert natural conditions found in the EnergyPlus Weather file (.epw) for each of the three chosen cities. The thermal energy outputs represent annual heating and cooling loads. In this paper each of the three building floors were considered as a single open office thermal zone. It is worth mentioning that the default program assigned to buildings by ladybug and honeybee is office building, and the default zoning assigned to spaces is open office.
Optimization allows for the exploration of a large number of design alternatives to find the minimum or maximum value of an objective function when reaching the best value for dynamic parameters [7]. Octopus is a grasshopper genetic algorithm plug-in based on SPEA-2 and HypE algorithm that can be used to run single objective optimization process while involving genetic diversity as a second objective [22]. Octopus is used to perform single objective optimization to minimize annual thermal EUI. Octopus was stopped after performing 6 generations for each case starting from zero to five. Thermal EUI of the building was used to calculate the annual thermal energy consumed per unit area as a result of the changing of the area of the building during optimization. Lastly, Octopus user interface is used to compare results presented in the graph.
In this paper, the evaluation objective function is to minimize annual thermal EUI, in addition to promoting genetic diversity. Percentages of reduction or increase of total thermal EUI load per unit area of new generated design configurations in comparison to the base case were calculated using the following equation (Eq. (1)):
F (x) total thermal load = 100 (1 – (f (g) /f (i)) (1)
where F(x) is the value that calculates the percentage of reduction or increase in the objective function (annual thermal EUI). And, f(g) represents the simulation result of each of the new generated design configurations and f(i) is the simulation result of the initial base case. Positive results indicate the reduction of annual thermal EUI, and negative results indicate the increase in annual thermal EUI.
3. Results and Discussion
The results demonstrated that the proposed EPBFM method is capable of enhancing thermal energy performance of building form in the hot, cold, and temperate climate zones. EPBFM method also provides diversity of design configurations with better performance for designers to choose the best configuration that suits project other needs. This was achieved using just one initial form with the same form and orientation dynamic parameters. Thermal energy use intensity (EUI) savings were 22.76% for Cairo, 29.7% for London, and 19.2 for Chicago in comparison to the initial square shaped building form. This workflow helps architects to include energy assessment at the early stage of the design process using a friendly GUI to generate and test numerous alternative design configurations, that they cannot design and test without the help of a computational generative design tool. In addition, the solutions found in the Octopus user interface help architects to understand the role of different dynamic parameters and their assigned values in enhancing or worsening the thermal energy performance. The proposed method proves to be beneficial to contribute to the research concerned with enhancing energy performance in the built environment. And could be further developed through the addition of different types of dynamic parameters and/ or the application to other climate zones.
For each case of the three cities, the pareto front configurations were chosen to present the optimal design configuration that has the lowest thermal EUI and the worst design configuration that has the highest thermal EUI. In addition, to presenting some design configurations in between them. Figures 2,3, and 4 shows the three graphs in the Octopus user interface after performing the optimization for each city. Each square represents an iteration, where the pareto front iterations are highlighted with circles. The graph includes all the simulated configurations with their thermal EUI, and genetic diversity values that appears when you hover over a square. In order to take a photo of the chosen configuration, each case was generated through clicking on its square and selecting the command reinstate solution. This option allows for the regeneration of the building form model in the rhinoceros while presenting its objective functions, and dynamic parameters values in grasshopper. Figure 2 shows that the lowest thermal EUI value reached for Cairo case was 92.62 kWh/m2 per year. While figure 3 shows the lowest thermal EUI reached for London is 25.49 kWh/m2 per year. And figure 4 shows the lowest thermal EUI reached for Chicago is 61.29 kWh/m2 per year. Better values for thermal EUI could be achieved through increasing the number of generations (optimization time) to include more numbers of tested design configurations. In this study, the optimization time taken to perform the five generation was around 5 hours using a laptop with a 7th Generation Intel® Core™ i7-7700HQ Processor (2.80GHz, up to 3.80GHz with Turbo Boost, 6MB Cache), and 16.0 GB installed memory (RAM). Optimization process time could be decreased through the usage of better computer resources.
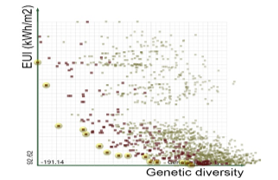 Figure 2: Cairo Simulation results presented in graph between genetic diversity and thermal EUI.
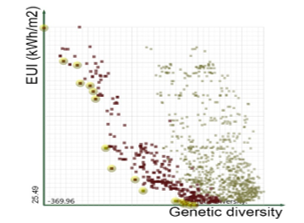 Figure 3: London Simulation results presented in graph between genetic diversity and thermal EUI
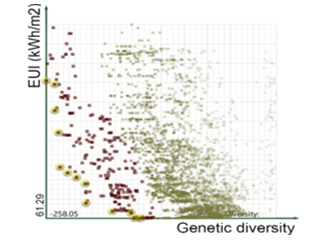 Figure 4: Chicago Simulation results presented in graph between genetic diversity and thermal EUI
Cairo pareto front results were selected from the results graph in Octopus to represent a random selection of variety of generated forms with different thermal EUI values that starts from the optimal solution till it reaches the worst solution. The pareto front configurations are presented in figure 5 with the percentage decrease or increase in thermal EUI in reference to the initial squared form. The configurations are ordered according to their thermal EUI performance from the optimal to the worst configuration with the base case located in between with 0% value. Figure 5 shows that oprimal solution tended to expand the building dimension along north-south axis. And to expand the top and bottom floors along east-west axis which causes the shading of the middle floor west and east facades. In addition to rotating the building slightly towards north-west direction. While the worst configuration tended to increase the height of the building floors and to avoid the expansion of the whole building along north-south axis, in addition to tilting the building to completely face the north-west direction.
Generally, it appears that shading the ground and/ or the middle floor enhances the thermal EUI of the initial box in Cairo case. However, there still exist top enhanced solution in the pareto front that has no self-shading as seen in the seventh configuration that was enhanced by 17.98 % in reference to the base case. It is also obvious that irregular forms with square shaped foot print is the best in terms of thermal energy performance. However, irregular forms with rectangular shaped foot print can also provide enhanced thermal energy performance when compared to the initial regular form as seen in the fifth, sixth, and eighth configurations.
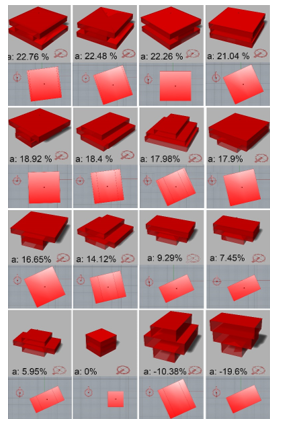 Figure 5: Cairo Pareto front solutions and the base case. Design configurations are ordered from the optimal to the worst solution (from left to right, and from top to bottom). (a: percentage of increase or reduction in thermal EUI in comparison to the base case). All perspectives are taking from the same north-west view angle and position, and each perspective is proceeded by a plan. North arrow is presented in the left side of plan and bottom right part of perspective.
While in Cairo there are thirteen enhanced solutions before the base case in the pareto front, London and Chicago (figures 6, and 5) have only nine better enhanced solutions before the base case. In both London and Chicago, the optimal forms tended to expand the whole building and the three floors to the maximum to take the shape of a larger regular square shaped form, while keeping the building height fixed at 3 meters. While the optimal configuration for London tilted the building slightly towards north-west direction, optimal configuration for Chicago kept the orientation same as the base case.
In London, and Chicago, the worst cases resemble Cairo worst configuration in increasing the height of the building floors and in avoiding the expansion of the whole building along north-south axis. But the three worst cases differ in the expansion of floors and the degree of rotating the building towards north-west direction. However, building rotation in the three cases existed in both enhanced forms and the forms with lower energy performance. In both London, and Chicago slight shading appeared in two and one enhanced configurations, but extreme self-shading appeared in 6 worse cases in London and in one of the cases with least performance in Chicago.
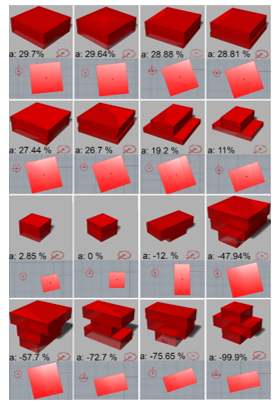 Figure 6: London Pareto front solutions and the base case. Design configurations are ordered from the optimal to the worst solution (from left to right, and from top to bottom). (a: percentage of increase or reduction in thermal EUI in comparison to the base case). All perspectives are taking from the same north-west view angle and position, and each perspective is proceeded by a plan. North arrow is presented in the left side of plan and bottom right part of perspective.Scatterplots
Scatterplots presented in this section shows the relationship between each dynamic parameter against annual thermal EUI objective function in each of the three cases. They are developed using the simulation results of around 500 iterations for each of the three cities. Scatterplots of each dynamic parameter against thermal EUI for the three cities are presented in one column to ease the comparison between different local climate conditions. Each circle in a scatterplot represents an iteration and the dotted line represents the trend direction. Annual thermal EUI values are presented in the y-axis in kWh/m2, while each of dynamic parameter’s values are presented in the x-axis with their unit.
In [7], the author stated that noticeable trend in a scatterplot reflects a strong impact of the dynamic variable. In this research, the scatterplots of expansion of the whole building along one axis against thermal EUI presented in figure 8. And the scatterplots of the expansion of each floor along the other perpendicular axis against thermal EUI presented in figure 9 show the most obvious decreasing trend. This means the manipulation of both form dynamic parameters have a positive impact as decreasing trend reflects decrease in thermal EUI.
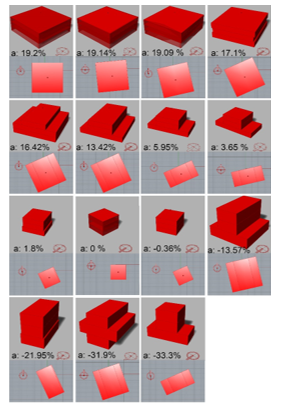 Figure 7: Chicago Pareto front solutions and the base case. Design configurations are ordered from the optimal to the worst solution (from left to right, and from top to bottom). (a: percentage of increase or reduction in thermal EUI in comparison to the base case). All perspectives are taking from the same north-west view angle and position, and each perspective is proceeded by a plan. North arrow is presented in the left side of plan and bottom right part of perspective.
On the other side, scatterplots of the increase in the floor height against thermal EUI show the most obvious increasing trend. This shows it has a negative impact as it causes the increase in thermal EUI. Finally, building orientation has increasing and decreasing trend in each of the three cities, which shows that building orientations values needs to be adjusted to keep values that cause a positive impact only. For example, in London case in figure 10 the lowest thermal EUI value is reached in the area between values 0, and 0.5 radians. Therefor values larger than 0.5 can be eliminated easily from the building orientation values dynamic parameter to avoid the resting of more useless values which causes the increase in calculation time.
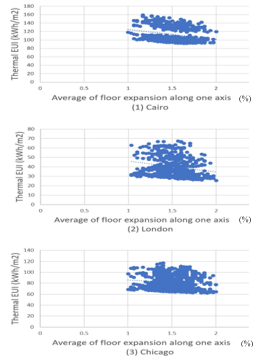 Figure 8: Scatterplots of average expansion of the three floors along one axis against thermal EUI for the three climates.
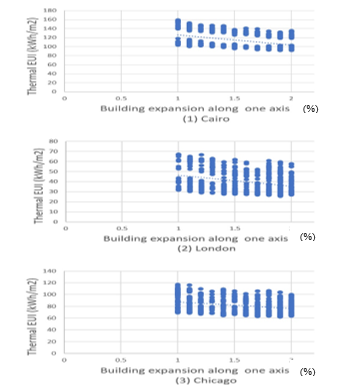 Figure 9: Scatterplots of Building expansion along one axis against thermal EUI for the three climates
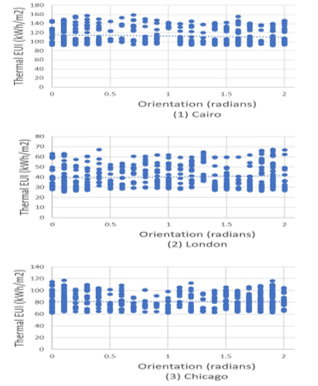 Figure 10: Scatterplots of building orientation against thermal EUI for the three climates
 Figure 11: Scatterplots of floor height against thermal EUI for the three climates
Generally, it appears that each dynamic parameter has the same positive or negative impact on the thermal EUI objective. However, there are still differences between the three cities. For example, scatterplots of both average expansion of the three floors, and Building expansion against thermal EUI show an obvious decreasing trend. But, in both types, Cairo plots has the highest obvious decreasing trend. On the other side, scatterplots of increasing in floor heights against thermal EUI show the highest obvious increasing trend, but Cairo case also has the highest obvious increasing trend.
4. Conclusion
The objective of this research is to propose EPBFM method for optimizing open office building form and orientation for thermal energy performance at the early stage of the design process. This proposed method allows for the generation of numerous design configurations from the initial problem set. After optimization all generated forms are ordered from the highest to the lowest in terms of thermal energy performance in the pareto graph. This workflow allows for the generation of different optimal forms that differs in accord with the difference in local climate conditions. The study uses the same initial problem set and same form and orientation dynamic parameters. The evaluation objective function used minimizes thermal load (cooling and heating loads) while promoting diversity. The percentages of reduction or increasing of thermal load of new generated forms in reference to the base case differed also in accord with the difference in climate zones. In this research the thermal energy use intensity (EUI) was decreased by 22.76% in the arid climate, 29.7% in the temperate, and 19.2 in the cold climate, in comparison to the initial square shaped building form. Scatterplots were developed to test the role of each dynamic parameter in enhancing or worsening thermal energy performance. The expansion of the building along one axis, and the expansion of floors along the other perpendicular axis proved to have the highest obvious positive impact on enhancing thermal EUI. While manipulation of building height has the highest obvious negative impact.
Future application to other climate zones is recommended to expand the current work. The current research considers the form and orientation dynamic parameters only to understand their effect on enhancing thermal energy performance and how the optimal architectural form and its orientation differs according to local climate conditions. The consideration and manipulation of envelope parameters such as, window-to-wall-ration, and shading devices is also recommended to further enhance the thermal energy performance. Other objective functions also can be added to expand the work such as, cost, and acoustics. It is important also to note that in this research optimization process were stopped after performing six generations for each of the three cases. The number of generated alternative design configurations increases with the increase in the generations, thereby increasing the number of generations is recommended to explore more design alternatives. This can be achieved through the usage of better computer resources or increasing the calculation time.
Conflict of Interest
The authors declare no conflict of interest.
Acknowledgment
The authors wish to thank Mostapha Sadeghipour Roudsari, and Chris Mackey (the developers of Ladybug and Honeybee) for providing online software assistance.
- L. Pérez-Lombard, J. Ortiz, C. Pout, “A review on buildings energy consumption information,” Energy and Buildings, 40(3), 394–398, 2008, doi:10.1016/j.enbuild.2007.03.007.
- L. Caldas, “Generation of energy-efficient architecture solutions applying GENE_ARCH: An evolution-based generative design system,” Advanced Engineering Informatics, 22(1), 59–70, 2008, doi:10.1016/j.aei.2007.08.012.
- Y.K. Yi, A.M. Malkawi, “Optimizing building form for energy performance based on hierarchical geometry relation,” Automation in Construction, 18(6), 825–833, 2009, doi:10.1016/j.autcon.2009.03.006.
- Y.K. Yi, Ali.M. Malkawi, “Site-specific optimal energy form generation based on hierarchical geometry relation,” Automation in Construction, 26, 77–91, 2012, doi:10.1016/j.autcon.2012.05.004.
- J.-T. Jin, J.-W. Jeong, “Optimization of a free-form building shape to minimize external thermal load using genetic algorithm,” Energy and Buildings, 85, 473–482, 2014, doi:10.1016/j.enbuild.2014.09.080.
- F. Ascione, N. Bianco, G.M. Mauro, G.P. Vanoli, “A new comprehensive framework for the multi-objective optimization of building energy design: Harlequin,” Applied Energy, 241, 331–361, 2019, doi:10.1016/j.apenergy.2019.03.028.
- Y. Fang, S. Cho, “Design optimization of building geometry and fenestration for daylighting and energy performance,” Solar Energy, 191, 7–18, 2019, doi:10.1016/j.solener.2019.08.039.
- K. Konis, A. Gamas, K. Kensek, “Passive performance and building form: An optimization framework for early-stage design support,” Solar Energy, 125, 161–179, 2016, doi:10.1016/j.solener.2015.12.020.
- V. Granadeiro, L. Pina, J.P. Duarte, J.R. Correia, V.M.S. Leal, “A general indirect representation for optimization of generative design systems by genetic algorithms: Application to a shape grammar-based design system,” Automation in Construction, 35, 374–382, 2013, doi:10.1016/j.autcon.2013.05.012.
- V. Granadeiro, J.P. Duarte, J.R. Correia, V.M.S. Leal, “Building envelope shape design in early stages of the design process: Integrating architectural design systems and energy simulation,” Automation in Construction, 32, 196–209, 2013, doi:10.1016/j.autcon.2012.12.003.
- E. Rodrigues, A.R. Gaspar, Á. Gomes, “Automated approach for design generation and thermal assessment of alternative floor plans,” Energy and Buildings, 81, 170–181, 2014, doi:10.1016/j.enbuild.2014.06.016.
- P.E. Camporeale, P. Mercader-Moyano, “Towards nearly Zero Energy Buildings: Shape optimization of typical housing typologies in Ibero-American temperate climate cities from a holistic perspective,” Solar Energy, 193, 738–765, 2019, doi:10.1016/j.solener.2019.09.091.
- B. Kiss, Z. Szalay, “Modular approach to multi-objective environmental optimization of buildings,” Automation in Construction, 111, 103044, 2020, doi:10.1016/j.autcon.2019.103044.
- A. Zhang, R. Bokel, A. van den Dobbelsteen, Y. Sun, Q. Huang, Q. Zhang, “Optimization of thermal and daylight performance of school buildings based on a multi-objective genetic algorithm in the cold climate of China,” Energy and Buildings, 139, 371–384, 2017, doi:10.1016/j.enbuild.2017.01.048.
- B.J. Futrell, E.C. Ozelkan, D. Brentrup, “Bi-objective optimization of building enclosure design for thermal and lighting performance,” Building and Environment, 92, 591–602, 2015, doi:10.1016/j.buildenv.2015.03.039.
- N.C. Brown, C.T. Mueller, “Design for structural and energy performance of long span buildings using geometric multi-objective optimization,” Energy and Buildings, 127, 748–761, 2016, doi:10.1016/j.enbuild.2016.05.090.
- D. Yang, S. Ren, M. Turrin, S. Sariyildiz, Y. Sun, “Multi-disciplinary and multi-objective optimization problem re-formulation in computational design exploration: A case of conceptual sports building design,” Automation in Construction, 92, 242–269, 2018, doi:10.1016/j.autcon.2018.03.023.
- K. Negendahl, “Building performance simulation in the early design stage: An introduction to integrated dynamic models,” Automation in Construction, 54, 39–53, 2015, doi:10.1016/j.autcon.2015.03.002.
- Grasshopper – algorithmic modeling for Rhino, Jan. 2020.
- Rhino 6 for Windows and Mac, Jan. 2020.
- Ladybug Tools | Home Page, Jan. 2020.
- Octopus | Food4Rhino, Jan. 2020.