A Reconfigurable Stepped Frequency Continuous Wave Radar Prototype for Smuggling Contrast, Preliminary Assessment
 , Giuseppe Espa 2, 3, Mohammedhusen Manekiya 1, Giada Marchi 1, Claudio Pascucci 4
Adv. Sci. Technol. Eng. Syst. J. 6(4), 13–20 (2021);
 DOI: 10.25046/aj060402
A reconfigurable Stepped Frequency Continuous Wave (SFCW) radar prototype for supporting the italian financial police to contrast smuggling, is proposed in this work. In particular, the proposed radar can provide information related to the container contents and the presence of false bottoms speeding up the control operations at borders and ports. Moreover, it is able to reveal the presence of people hidden behind reinforced concrete hiding places. Radar resolution is improved by using suitable post-processing method such as the Multiple Signal Classification (MUSIC) algorithm. Numerical as well as experimental results obtained considering realistic operative scenarios demonstrated the potentialities and capabilities of this system as an effective tool for smuggling contrast. The preliminary experimental results have been obtained using a compact radar prototype equipped with high gain and directivity antennas to cover all the different frequency bands.
1. Introduction
In recent years, globalisation has led to a sharp increase in the smug- gling of goods and illegal materials such as drugs, tobacco, and weapons. To contrast smuggling, Guardia di Finanza (GdF), the Italian financial police, increases the controls at customs and ports. However, checking the contents of thousands containers or vehicles requires a lot of time, human resources, and money. New tech- nologies and tools can effectively to support the GdF work and be effective to contrast smuggling. In such a scenario, radar technolo- gies and, particularly, ground penetration (GPR) and through the wall radars (TTR) could represent effective tools for GdF. A scan-A (1D) analysis of a container can provide accurate information con- cerning the contents, presence of false bottoms or hidden humans without the need to empty the container or vehicle, saving time, money and resources. In order to be useful for these operations, it is necessary to reach a high resolution of about tens centimetres and an unambiguous range of less than ten meters. These performances can be easily obtained with an SFCW radar [1]. Due to their com- plexity and the high cost of microwave components, SFCW radars had less diffusion for through the wall and ground penetration radar applications than pulsed radars [2]. However, in the last decade, microwave components strongly improved their performances and reduced their dimensions and cost, making the realization of com- pact SFCW radars more feasible. Recently SWCW radars have been successfully adopted for GPR applications [3, 4], landmine detection [5], surveillance [6], through the wall inspection [7], the monitoring of the structural integrity of engineering structures [8]– [10] or for biomedical applications such as the monitoring of human or animal life signals [11]–[13]. The last application can be very useful for police operation since it can be used to detect fugitives hid- den inside improvised hiding places such as bunkers and wall false bottoms or human traffic. SFCW radar capabilities to characterize the electric properties of materials as in [10] can be very useful to identify hidden goods, such as tobacco, drugs, and hidden weapons. To improve the radar performances, such as resolution, detection capabilities, clean the clutter and reduce the background noise, suit- able post-processing algorithms can be applied [14]–[18]. This paper is an extension of work originally presented in 2nd Global Power, Energy and Communication Conference (GPECOM) [19] where only preliminary numerical results have been reported. In this work, a low-cost SFCW radar prototype as support, the GdF work is developed, fabricated, numerically and experimentally assessed in realistic scenarios. The device is based on the ability to operate at different frequency bands enclosed in a range 100MHz-12GHz.. Based on a Direct Digital Synthesis (DDS) generator, the proposed system is easily reconfigurable in terms of frequency bands, number of steps, and spatial resolution. The device can be programmed as
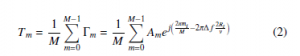
complex vector Γˆ = [Γ0, . . . , ΓM−1]. The inverse discrete Fourier transformer reported in the following equation is then applied to the Γˆ vector in order to obtain the conversion from frequency to time domain and better reveal the presence of echoes produced by targets.
ground, through the wall and life detection radar, and it is suitable for smuggling contrast and rescue operations. The prototype is
based on the system reported in [19], and it is capable of taking a single scan-A deep profile measurements using 600 frequency steps in less than 2 seconds with a minimum spatial resolution of 0.005 m, simulating a pulsed radar or as continuous-wave radar (CW) to work like a Doppler radar. The device is too slow for moving targets, but it is perfect for GPR and TTW applications where the targets are fixed. The obtained numerical and experimental preliminary results, related to realistic scenarios and directly provided by the GdF, demonstrated the capabilities and potentialities of the proposed system.
2. Mathematical Formulation
This section reports the mathematical formulation of a stepped frequency continuous wave radar and the formulation of post- processing MUSIC algorithm. A typical SFCW radar schema is shown in Fig. 1. It consists of a sweep generator directly con- nected with a wideband directive antenna. The receiving section can receive the backscattered electromagnetic wave and aims to provide the in-phase and quadrature (I/Q) signals. The control sys- tem directly process the frequency domain signal into a synthesized time-domain signal. In particular, the received baseband I/Q signals are combined into a complex number as follows:
SFCW radar strength is its ability to set the resolution properly and unambiguously adapt to the different operative scenarios. The resolution range is provided by the following equation:
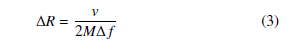
where v is the electromagnetic wave propagation velocity in the medium. As it can be noticed from (3) the resolution range only de- pends by the frequency steps number M and the ∆ f . The following relation can estimate the unambiguous range:
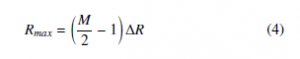
similarly to equation (3), the unambiguous range can be changed by acting on the step number M and on the resolution range. In most of practical scenarios a A-scan (1D) range profile is enough and it can be obtained by processing the received signal for a given fixed position of the RX and TX antennas. However, it is worth noticing that for all the applications that require a B-scan (2D) representation, such as GPR applications, it is possible repeating the procedure for A-scan (1D) by using different antenna positions.
2.1 The MUSIC post processing algorithm
![]()
where φm = 2π fmτ, whit fm is the m-th frequency step and τ is the propagation delay, Im = Aicos(φm), and Qm = Am sin(φm).
To properly resolve close targets, suitable post-processing algo- rithms must be applied to the SFCW radar signals. These signal are very weak and enveloped by the background or by other noise sources. Super-resolution algorithms such as the well-known MU- SIC algorithm has been recently successfully used for different practical applications [20]–[24] and the MUSIC algorithm can be very useful to extract the echoes of targets from the background noise. In particular, the I/Q signals collected by the receiver can be expressed by the following vectorial relation:
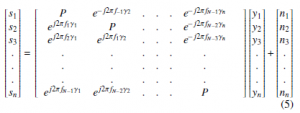
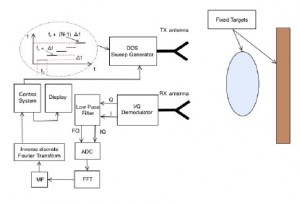
Figure 1: Schema of the SFCW radar.
The sweep generator generates M different sinusoidal tones. The receiver is aimed at collecting all the backscattered signals from the targets . In particular, the Im/Qm signals are organized into a that in compact form is [s] = [ A] y + [n], where [n] is the noise vector, y is the reflection coefficient vector whose elements are related to the fN frequency steps, [ A] is the n × n delay matrix. The n × n signal covariance matrix is given by:
![]()
where represent the complex conjugate transpose. The signal covariance matrix [R] can be expressed as:
![]()
where [Rn] = σ2 [I] is the noise autocorrelation matrix, σ is the noise variance, [I] is the identity matrix and [Rs] is the signal covariance matrix, which can be written as [Rs] =
|An|2 [ei] eH =P [ei] eH , where |An|2=P is the power of complex different operative scenarios. In particular, Fig. 3 reports a GUI screen snapshot, representing the tool for through the wall opera- tions. On the left side panel, the radar signals are presented both in time domain and with their spectrogram.
exponentials, [ei] = 1, e jω1 γ1 , e jω1 γ2 , …, e jω1 γn , with ω = 2π f . Since [Rs] is a hermitian matrix then the remaining eigenvectors υn
The peak position in the time-domain can be obtained by searching the maximum value of the following function.
where a(γ) is the mode vector, obtained from the columns of matrix [A] and N∗n are the noise eigenvectors.
3. Prototype description
The SFCW radar prototype consists of a programmable digital sig- nal generator (DDS), namely the TG124A (Signal Hound company), with a frequency range from 100KHz up to 12.5GHz and a power range from 12dB up to 3dB. The receiver is a digital spectrum analyzer, the SA124B (Signal Hound company), with the follow- ing characteristics: frequency range 100KHz, 12.5 GHz, minimum detectable power 150dBm. The DDS generator is synchronized with the receiver by means of a coaxial cable that reports the refer- ence local oscillator signal mandatory to obtain the baseband I/Q signals. The DDS generator is directly connected with a transmit- ting directive radiator, namely a log-periodic wideband antenna for the frequency band comprised between 500.0 MHz-6.0GHz and a high gain horn antenna for the frequency range 8.0GHz-13GHz, the antenna must be manually changed for different operations. The receiver can receive the backscattered electromagnetic wave and provide the I/Q signal that the control system can directly process. Moreover, the SA124B receiver can be easily programmed to sam- ple the I/Q signals and transmit them to an elaboration unit (a high- performance laptop) with a high-speed USB connection. The radar prototype’s RF sections are connected with three shielded semi-rigid coaxial cables equipped with sub-miniature type A (SMA) connec- tors. The SFCW radar prototype photo is shown in Fig. 2. The radar prototype can operate both in bistatic as well as monostatic configuration, as reported in Figs. 1 and 2 respectively. When the radar operates in monostatic configuration, a circulator is connected between the generator, receiver and antenna. The monostatic con- figuration is considered to reduce the weight of the prototype when operator is involved in through the wall operations (TTW). To re- duce the perturbations on the electromagnetic field prodused by the mechanical support, the device was assembled on Teflon dielectric support and placed on a mechanical pedestal to steer the antenna properly. To properly set the radar functionalities, a graphical user interface (GUI) in Matlab language, has been developed. With the GUI, it is possible to customize the radar characteristics to fit with
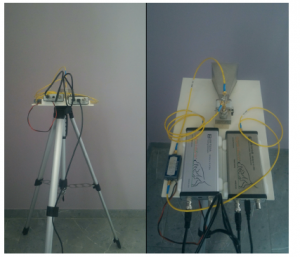
Figure 2: Photo of the assembled SFCW radar prototype.
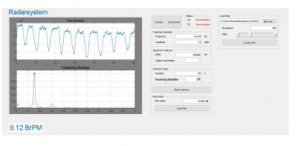
Figure 3: The SFCW radar graphical user interface (GUI).
4. Numerical and experimental assessment
This section is aimed at assessing the capabilities of the proposed SFCW radar. In particular, in sub-section 3.1 are reported the simulated results presented in [19] while sub-section 3.2 reports a preliminary experimental assessment aimed at detecting the human presence behind a wall. This experiment has been carried out to demonstrate the capability of this system to detect fugitives.
4.1 Numerical assessment
In this sub-section, the proposed SFCW radar has been assessed in realistic operative scenarios suggested by the GdF. In particular, the contents of different containers equipped with the false bottom are checked with a fast scan-A (1D) analysis. The radar system, the antenna and related scenarios are accurately simulated with a customized numerical time-domain electromagnetic engine (FDTD). All the simulations have been performed with quad-cores personal computer, 16 GByte RAM. A gaussian white noise has been added to the original data to simulate better a realistic scenario. The signal to noise ratio of this experiment was S NR = 5dB. Different SNR ratio has been tested in a controlled environment, a noise above 5 dB produced very low effects on the simulations demonstrating the robustness of the proposed system. With reference to Figs. 4, 6, and 10, the blue colour represents the container’s metallic walls, grey colour represents air-filled, brown colour relates to a homogeneous content of woods or granite blocks. The small orange lines in Fig. 6 represents empty space between wood blocks. The light pink colour in Fig. 10 represents a homogeneous block of tobacco.
- Empty container with false bottom at different distance
Smugglers usually modify containers stored in ports by inserting false bottoms of different material inside them, the goal is to hide goods and illegal material. In the first experiment, an empty standard container of length 6.058 m, width 2.438 m, and height 2.591 m is considered. The container doors are opened, and the radar pointed precisely in the middle of the aperture at position xr = 1.219m, y = 1.2945m.
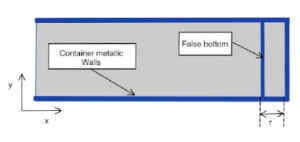
Figure 4: Empty container equipped with a metallic false bottom placed at different distances, A 0.353 m, B 0.453 m, C 0.554 m, D 0.653 m, and E 0.754 m.
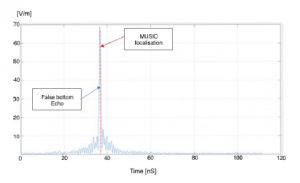
Figure 5: Empty container equipped with a metallic false bottom placed at differ- ent r=0.554 m, test case C. Time domain retrieved signal, blue line, MUSIC peak detection dotted red line.
Figure 10 shows the container section equipped with false metal- lic bottom placed at different distances. The radar parameters are the following: fmin = 1.0 GHz, fmax = 2.071 GHz, M = 120,
∆ f = 90MHz, bandwidth B = 1.071GHz. With these parameters an unambiguous range Rmax = 16.8m and a resolution of ∆R = 0.14m can be reached. To obtain the position of the false bottom, it is enough a single scan A radar trace. The synthetic data were obtained with an FDTD electromagnetic simulator, namely the gprMax, a well-known gnu software for ground penetration radar (GPR) simu- lations. To consider the defocusing effects, due to the reflections on container metallic walls, a set of simulations have been performed, considering an empty container and different frequency bands. The goal is to evaluate the effects of reflections and reduce the defo- cusing effect which can afflict the detection of the peak. Different false bottom positions were considered as reported in Tab. 1 and the synthetic data obtained with gprMax, for each frequency step, are combined and post-processed with the same procedure reported in [25] to obtain the response of a stepped frequency continuous wave radar. Tab. 2 reports the positions of false bottom obtained with a simple peak detection of the inverse discrete Fourier trans- former in the time domain. For the sake of comparison, the false bottom position were also estimated with the MUSIC algorithm. Tab. 2 also reports the position errors obtained with the simple peak detection using the MUSIC algorithm. As it can be noticed from the data of Tab. 2 the localization error is very small. The MUSIC algorithm simplifies the data reading and interpretation, keeping the errors below five millimetres. An example of post-processed I/Q data converted into a scan-A time-domain diagram is reported in Fig. 5. As it can be noticed from the data reported in Fig. 5 the peak detected with the standard post processing procedure and with the music algorithm overlaps since both methods localize the peak with a high degree of accuracy. The next experiment considers an empty container with a non-metallic false bottom. This exper- iment’s scope is to assess the capabilities of radar to detect low reflective materials such as wood and plastic wall. Three different commonly used materials, (dry wood, plexiglas, and pressed board wood, whose dielectric characteristics are summarized in Tab. 3) are considered for the wall false bottom realization. The geometry of the considered scenario is shown in Fig. 6. The scan-a diagram’s simulation results obtained positioning the electromagnetic source in the middle of container aperture are reported in Figs. 7,8 and 9 respectively. The echo of the container end wall was filtered to visualize the false bottom’s echo better. This filtering procedure is quite simple since the real dimensions of a standard container are known. For all considered scenarios, the false bottom made of dielectric material was successfully identified and localized with a high degree of accuracy. In particular, the wood dry false bottom (Fig. 7) is localized with a very low error γ = 2.7mm. The local- ization of plexiglas false bottom (Fig. 8) presents a slightly high error γ = 6.8mm with respect to the wood dry false bottom wall. The last scenario (Fig. 9) provide the worst results: the localization error γ = 16.1mm, even though is quite high with respect to the two previous scenarios; still satisfactory.
Table 1: False bottom positions.
| A | B | C | D | E | |
| r [m] | 0.353 | 0.453 | 0.554 | 0.653 | 0.754 |
Table 2: Retrieved false bottom positions with peak detection and MUSIC algorithm.
| Scenario | Peak Pos | MUSIC Pos. | Err. Peak | Err. MUSIC |
| A | 5.700 m | 5.701m | 5.0 mm | 3.5 mm |
| B | 5.600 m | 5.602 m | 4.9 mm | 3.3 mm |
| C | 5.499 m | 5.500 m | 3.9 mm | 3.4 mm |
| D | 5.399 m | 5.402 m | 4.4 mm | 3.3 mm |
| E | 5.302 m | 5.301 m | 3.3 mm | 3.0 mm |
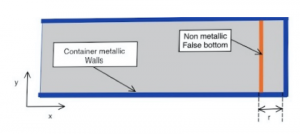
Figure 6: Empty container equipped with a non metallic false bottom placed at distance r = 5.40m.
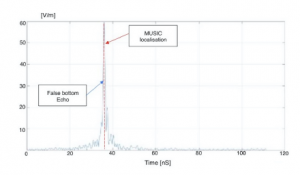
Figure 7: Empty container with a wood dry false bottom placed at distance r = 5.40m. Retrieved echo radar signal and MUSIC peak estimation.
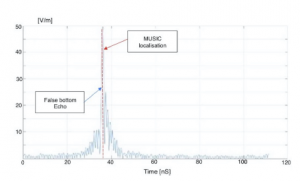
Figure 8: Empty container with a plexiglas false bottom placed at distance r = 5.40m.. Retrieved echo radar signal and MUSIC peak estimation.
Table 3: Dielectric characteristics of wall materials used for the false bottom.
| Scenario | Material | εr |
| A | Wood, dry | 4.5 |
| B | Plexiglas | 3.5 |
| C | Wood, pressed board | 2.0 |
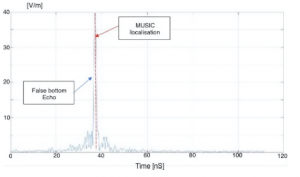
Figure 9: Empty container with a wood pressed board false bottom, placed at distance,r = 5.40m.. Retrieved echo radar signal and MUSIC peak estimation.
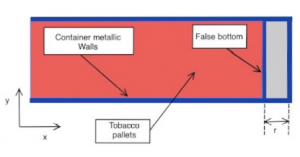
Figure 10: Container filled with tobacco pallets and a metallic false bottom placed at a distances r = 5.30m.
In the following experiments, different goods fill the container. The objective is to assess the radar capability to successfully detect the presence of false bottoms or other anomalies in goods without the necessity of unloading the container. This aspect is essential for police operations because it permits to check off more containers in less time. The shipper’s shipping manifest permits estimating an electromagnetic wave’s velocity and finding anomalies in the load. The first experiment considers a container filled with tobacco pallets and a metallic false bottom placed at a distance r = 5.3m from the container door. The goal is to assess the capability to detect the false bottom despite the load presence. Scan-a result of the above scenario is reported in Fig. 11, as it can be noticed the echo is quite noisy due to the load presence. However, thanks to the MUSIC localization algorithm, the false bottom is successfully localized with a high level of accuracy with an error γ = 12.5mm. In the last experiment, the container is filled with blocks of granite. The dielec- tric permittivity of granite is εr = 7.0 quite high. This experiment is of particular interest because unload a container filled with granite blocks requires much time and specific mechanical facilities. The scan-a results obtained from the simulation performed with gprMax are reported in Fig. 13. The echo is very well defined and presents a sharp peak easily detected by the MUSIC algorithm. The metallic false bottom is successfully detected with an error γ = 2.3mm. It is worth noticing that the results reported in Fig. 13are less noisy with respect to the data related to 11 a little bit noisier.
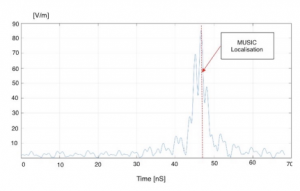
Figure 11: Container filled with tobacco pallets and a metallic false bottom placed at a distances r = 5.30m. Retrieved echo radar signal.
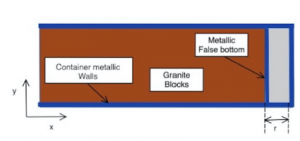
Figure 12: Container filled with granite blocks and a metallic false bottom placed at a distances r = 5.30m.
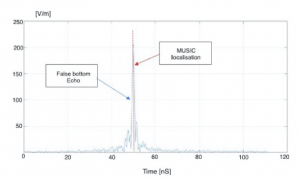
Figure 13: Container filled with granite blocks and a metallic false bottom placed at a distances r = 5.30m. Retrieved echo radar signal.
4.2 Experimental assessment
In this section, the SFCW radar prototype has been assessed in an operative scenario. The experimental setup refers to a typical through the wall application where a fugitive hides in a hiding place created behind a concrete wall. To detect humans hide behind walls, the radar prototype operates in continuous wave (CW) mode. The small chest and heart movements are detected by considering the Doppler effect carried on by the scattered electromagnetic wave. The wall thickness is 25cm, the distance of the fugitive’s chest from the wall is d = 1.5m, and he is sitting on a chair. The radar proto- type is manually steered to the other side of the wall at a distance of dr = 1.0m with the goal of detecting the fugitive by revealing his signals life such as the breathing rate and the heartbeat. A photo of the considered through the experimental wall setup is reported in Fig.14.
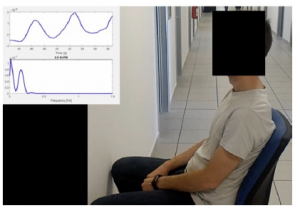
Figure 14: Experimental set-up. Radar in through the wall modality. Life signal detection, breathe rate and heartbeat, of a subject placed behind a 25 cm thickness wall.
The tool for the detection of human life signals has been se- lected in the radar GUI. The mechanical pedestal has been set at hight h = 1.5m and then horizontally moved along the wall with a step size of about s = 0.50m, the total length of the wall was 2.0m. The DDS generator’s power has been set to the minimum value of Ptx = 13dBm. The electromagnetic wave power that reaches the fugitive chest is very low, and it cannot create health or interference problems with other devices. The following Fig. 15 reports the fugitive breathing rate detected at the second scan 1.0m far away from the sidewall. As it can be noticed from the data reported in Fig. 15, the fugitive shows normal breathing conditions, and it is quite relaxed. When the radar is moved on the first, third or fourth positions at 0.5m, 1, 5m and 2.0m respectively, far away from the sidewall, the system reports no human activities. In the next experiments, the fugitive simulated an accelerated breathing rate increasing from eight, with reference to Fig. 15, up to twenty breath cycles for minutes reported in Fig. 16. The radar prototype’s resolution capabilities are quite accurate, and it can detect the small movements of the fugitive’s heart. Fig. 17 (red line) reports the heart movement’s radar signal. For the sake of comparison, the data reported in Fig. 17 has been compared with the data obtained with a commercial optical heartbeat detector (blue line), as it can be noticed from Fig. 17 the agreement is quite accurate, and it demonstrate the capabilities of this prototype not only for police operations but also for the rescue operation.
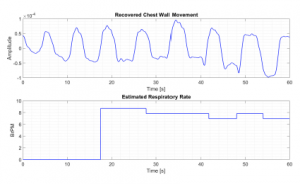
Figure 15: Experimental set-up. Life signals, breathing rate, of the fugitive detected behind the wall. Normal breathing conditions.
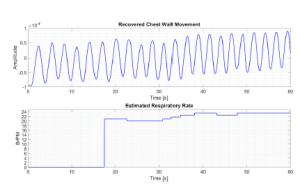
Figure 16: Experimental set-up. Life signals, breathing rate, of the fugitive detected behind the wall. Simulated accelerated breathing conditions.
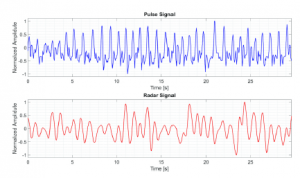
Figure 17: Experimental set-up. Life signals, heartbeat rate of the fugitive detected behind the wall with a more focused beam.
5. Conclusion
In this work, a Stepped Frequency Continuous Wave (SFCW) radar operating in the L band, suitable for fast inspection of foods and goods stored in metallic containers, has been proposed and numer- ically assessed in realistic scenarios. In particular, the proposed SFCW radar can estimate the dielectric characteristics of materials contained in a container and easily detect metallic or dielectric false bottoms commonly used for smuggling. A numerical assessment campaign, carried on considering different materials and simulating realistic scenarios, demonstrated the effectiveness and potentiali- ties of the proposed system as a helpful tool for the contrast of smuggling.
Conflict of Interest
The authors declare no conflict of interest.
Acknowledgment
The authors would like to thank Dr. E. Bor- tolotti for management the project and for the revision of manuscript, and the Autostrade Brennero S.P.A. A22 for funding the radar pro- totype.
- C. Nguyen, P. Joongsuk, Stepped-frequency radar sensors, Springer, 2016.
- G. Tronca, I. Tsalicoalou, S. Lehner, G. Catanzariti, “Comparison of pulsed and stepped frequency continuous wave (SFCW) GPR systems,” in 17th In- ternational Conference on Ground Penetrating Radar (GPR), 1–4, 2018, doi: 10.1109/ICGPR.2018.8441654.
- A. Langman, M.-R. Inggs, “Pulse versus stepped frequency continuous wave modulation for ground penetrating radar,” in Proceeding of International Geo- science and Remote Sensing Symposium, IGARSS 2001, 1533–1535, 2001, doi:10.1109/IGARSS.2001.976902.
- G. Gok, Y. K. Alp, O. Arikan, “A New Method for Specific Emitter Identifica- tion With Results on Real Radar Measurements,” IEEE Trans. Inform. Forensic Secur., 15, 3335–3346, 2020, doi:10.1109/TIFS.2020.2988558.
- L. Nicolaescu, P. V. Genderen, K. Palmer, “Calibration procedures of a stepped frequency continuous wave radar for landmines detection,” in Proceedings of the International Conference on Radar (IEEE Cat. No.03EX695), 412–417, 2003, doi:10.1109/RADAR.2003.1278777.
- A. S. Turk, A. Kizilay, M. Orhan, A. Caliskan, “High resolution signal process- ing techniques for millimeter wave short range surveillance radar,” in 17th Inter- national Radar Symposium (IRS), 1–4, 2016, doi:10.1109/IRS.2016.7884697.
- A. Kusmadi, A. Munir, “Simulation design of compact stepped-frequency continuous-wave through-wall radar,” in International Conference on Electri- cal Engineering and Informatics (ICEEI), 332–335, 2015, doi:10.1109/ICEEI. 2015.7352521.
- M. Pieraccini, M. Fratini, F. Parrini, G. Macaluso, C. Atzeni, “High-speed CW step-frequency coherent radar for dynamic monitoring of civil engineering structures,” Electron. Letters, 40, 907–908, 2004, doi:10.1049/el:20040549.
- M. Pieraccini, M. Fratini, F. Parrini, C. Atzeni, “Dynamic Monitoring of Bridges Using a High-Speed Coherent Radar,” IEEE Trans. Geosci. Remote Sensing, 44, 3284–3288, 2006, doi:10.1109/TGRS.2006.879112.
- S. S. Lambot, E. C. Slob, I. Van-den Bosch, B. Stockbroeckx, M. Vanclooster, “Modeling of ground-penetrating Radar for accurate characterization of subsur- face electric properties,” IEEE Trans. Geosci. Remote Sensing,, 42, 2555–2568, 2004, doi:10.1109/TGRS.2004.834800.
- W.-C. Su, M.-C. Tang, R. E. Arif and, T.-S. Horng, F.-K. Wang, “Stepped- Frequency Continuous-Wave Radar With Self-Injection-Locking Technology for Monitoring Multiple Human Vital Signs,” IEEE Trans. Microwave Theory Techn., 67, 2555–2568, 2019, doi:10.1109/TMTT.2019.2933199.
- M. Caruso, M. Bassi, A. Bevilacqua, A. Neviani, “A 2–16 GHz 65 nm CMOS Stepped-Frequency Radar Transmitter With Harmonic Rejection for High- Resolution Medical Imaging Applications,” IEEE Trans. Circuits Syst., 62, 413–422, 2015, doi:10.1109/TCSI.2014.2362332.
- M. Donelli, F. Viani, “Life signals detection system based on a continuous- wave X-band radar,” Electronics Letters, 52, 1903–1904, 2016, doi:10.1049/ EL.2016.2902.
- I. Nicolaescu, “Improvement of Stepped-Frequency Continuous Wave Ground- Penetrating Radar Cross-Range Resolution,” IEEE Trans. Geosci. Remote Sensing, 51, 85–92, 2013, doi:10.1109/TGRS.2012.2198069.
- M. Scherhaufl, F. Hammer, M. Pichler-Scheder, C. Kastl, A. Stelzer, “Radar Distance Measurement With Viterbi Algorithm to Resolve Phase Ambigu- ity,” IEEE Trans. Microwave Theory Techn., 68, 3784–3793, 2020, doi: 10.1109/TMTT.2020.2985357.
- G. Cui, L. Kong, X. Yang, “Reconstruction Filter Design for Stepped- Frequency Continuous Wave,” IEEE Trans. Signal Process., 60, 4421–4426, 2012, doi:10.1109/TSP.2012.2197206.
- S. R. J. Axelsson, “Analysis of Random Step Frequency Radar and Comparison With Experiments,” IEEE Trans. Geosci. Remote Sensing, 45, 804–904, 2007, doi:10.1109/TGRS.2006.888865.
- A. N. Gaikwad, D. Singh, M. J. Nigam, “Application of clutter reduction tech- niques for detection of metallic and low dielectric target behind the brick wall by stepped frequency continuous wave radar in ultra-wideband range,” IET Radar Sonar Navig., 5, 416–425, 2011, doi:10.1049/iet-rsn.2010.0059.
- M. Donelli, M. Manekiya, G. Marchi, I. Maccani, C. Pascucci, “High Res- olution L-band Stepped Frequency Continous Wave Radar for Smuggling Contrast,” in 2020 2nd Global Power, Energy and Communication Conference (GPECOM), 327–332, 2020, doi:10.1109/GPECOM49333.2020.9247932.
- T. Yamakura, H. Yamada, Y. Yamaguchi, “Resolution improvement of the MUSIC algorithm utilizing two differently polarized antennas,” in IEICE Trans- action on Communications, 1827–1832, 1996, doi:10.1155/2019/8907685.
- S.-M. Shrestha, I. Arai, T. Miwa, Y. Tomizawa, “Signal processing of ground penetrating radar using super resolution technique,” in IEEE Radar Conference, 300–305, 2001, doi:10.1109/NRC.2001.922995.
- K.-T. Kim, D.-K. Seo, H.-T. Kim, “Efficient radar target recognition using the MUSIC algorithm and inveriant features,” IEEE Trans. Antennas and Propaga- tion, 50, 325–337, 2002, doi:10.1109/8.999623.
- S.-M. Shrestha, I. Arai, T. Miwa, “Signal processing of ground penetrating radar combining FFT and MUSIC algorithm for high resolution,” in Tech. Rep. IEICE SANE2000 SAT2000-130, 31–43, 2003, doi:10.1155/S1110865703307036.
- S.-M. Shrestha, I. Arai, “Signal processing of ground penetrating radar us- ing spectral estimation techniques to estimate the position of buried targets,” EURASIP Journal on Applied Signal Processing, 12, 1198–1209, 2003, doi: 10.1155/S1110865703307036.
- V. Kafedziski, S. Pecov, D. Tanevski, “Target detection in SFCW ground penetrating radar with C3 algorithm and Hough transform based on gprMax simulation and experimental data,” in 2018 25th International Conference on Systems, Signals and Image Processing (IWSSIP), 2018, doi:10.1109/IWSSIP.
2018.8439227.
No related articles were found.