Social Financial Technologies for the Development of Enterprises and the Russian Economy

Adv. Sci. Technol. Eng. Syst. J. 8(3), 118–135 (2023);
 DOI: 10.25046/aj080314
The main contradiction identified in the study is that the existing scientific and methodological solves of economy development management processes does not create prerequisites for improving the efficiency of their work, the introduction of progressive technologies for material and moral stimulation of the work of performers and administrative and managerial personnel, advanced social mechanisms for country’s economy development and social security employees. Economic and mathematical modeling of the complex system of social financing of enterprises and the economy of the country, scientifically sound personnel policy and the system of motivation of performers and administrative and management personnel is an important and urgent problem. The purpose of the study is to develop and implement an economic and mathematical model of a comprehensive system of social financing of enterprises and the economy of the country, optimizing the wages of the workforce, consistent with revenue growth, deductions for the development of the enterprise (relevant for the employer and the entire workforce), taxation and social contributions (important for the state). The results of the studies conducted and presented in this article allow us to conclude that the proposed social financial technologies for the development of enterprises and the economy of Russia, make it possible, at quite achievable rates of growth of gross domestic product (revenue of enterprises) by 3% per year, to ensure an increase in the wages of working citizens for 5 years by 34 %, which will make it possible to practically end poverty, and to increase contributions to the development fund over 5 years by 16%. Starting from 2026, increase receipts from income tax, tax on profit rate and value added tax and bring this growth to 30% by 2041, which will allow the state to solve many social problems.
1. Introduction
Social financial technologies for the development of enterprises and the economy of any country in the world are connected with the life of a person and his relationships with other people in society. The realization of the most diverse needs of people in goods, works, services in society is provided only in the process of work, thus, the social financial technologies considered in this study should be perceived as a reflection of labor relations aimed at self-realization of citizens of working age.
For the first time, social protection of the population, including citizens working at enterprises, was issued through collective insurance.
According to the existing legislation of the Russian Federation, all enterprises, companies, organizations must make contributions: to the Pension Fund of Russia (PFR) – 22% of wages; to the Federal Compulsory Medical Insurance Fund (FCMIF) – 5.1% of wages; to the Social Insurance Fund (SIF) – 2.9% of wages (in case of temporary disability and maternity). Also, according to Federal Law No. 517-FZ of December 19, 2022, depending on the class of occupational risk, contributions in the amount of 0.2% to 8.5% of wages are paid.
All citizens of the Russian Federation are associated with the aforementioned funds. So, working citizens make contributions to the PFR and the FCMIF, and this is 82,678 thousand people, more than 36 million people receive a penis in our country, which means that in total it is already more than 118 million people, i.e. more than 80% of the population of the country, which indicates the importance and urgent need to study issues related to the effective management of funds of social funds and optimization of contributions of enterprises to these funds, so that the relationship with the funds does not lead to a decrease in the efficiency of enterprises and organizations, but on the contrary, is an incentive to the development of the enterprise, the economy of the country, motivation of personnel to work.
On the topic of this study, we analyzed 176 articles by different researchers and specialists. The analysis of articles devoted to the practical implementation of financial and social mechanisms of personnel management and enterprise development, which take into account the interests of the workforce, managers, shareholders and owners of enterprises, as well as the state as one of the stakeholders in the growth of wages of enterprise personnel, its development and increase in tax deductions to the federal and territorial budgets, can be divided into the following groups: Cash Flow Management (30 articles), Investment Efficiency (34 works), Socio-economic Security (23 articles), Welfare, Wage Growth (27 articles), Enterprise Development (12 scientific studies), Economic and Mathematical Modeling (23 scientific articles) and Business Process Management (27 articles). The relative weight of each group in the review is shown in Figure 1.
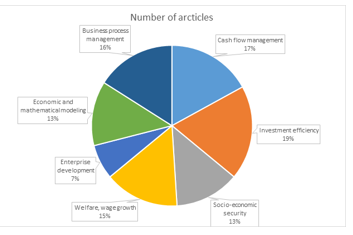
Figure 1: Distribution of Articles by Research Topics
Figure 1 shows that the largest share of the studied articles on the research topic falls on the Investment Efficiency section (34 articles, or a fifth of all works), followed by a problem related to cash Flow Management (Cash Flow Management), with the number of articles 30, which is 17% of the literature review. The group of articles devoted to Business Process Management closes the top three most popular research topics (28 papers, 16% of articles). The smallest group of works belongs to the Enterprise Development section with a total number of articles equal to 12, which is 7% of the list of analyzed articles.
The degree of elaboration of the research problem and its analysis are presented in detail in Table 1.
Table 1: Analysis of works devoted to the problems of this study
| Articles directions | Scientists and specialists who have contributed to the subject of the study |
| Welfare, Wage Growth | [1-27] |
| Enterprise Development | [28-39] |
| Investment Efficiency | [40-73] |
| Socio-economic Security | [74-96] |
| Cash Flow Management | [97-126] |
| Economic and Mathematical Modeling | [127-149] |
| Business Process Management | [150-176] |
A comparative analysis of the scientific results obtained by the authors and the results of other scientists and specialists dealing with certain aspects of the problems raised in the article is presented in Table 2.
Table 2: Comparison with Other Studies and Scientific Increment of Knowledge
| Number | Research directions | Scientific result | Scientific novelty |
| 1 | Welfare, Wage Growth | Social technologies have been developed for the financing of enterprises and the development of the country’s economy, maximizing the wages of employees, taxation and social contributions of enterprises, which can significantly increase the welfare of working citizens and ensure the supply of products in accordance with the increased demand for it and practically end poverty. | In contrast to the models of social financing of enterprises used in practice [14; 22] the basis of this social technology of enterprise financing is a breakthrough mechanism for increasing wage growth, material and moral incentives for workers, based on taking into account the needs of working citizens, managers, owners and shareholders of enterprises and the state, which allows the entire workforce to participate in the process of enterprise management, be a full participant in socio-economic relations in society, the development of the country and enterprises by directing part of the company’s revenue to its development and the growth of the welfare of citizens of the country, equipping the workplaces of employees, improving their qualifications. |
| 2 | Enterprise Development | A unique social technology for financing the economy of the country and its enterprises has been developed, which allows linking profits from the sale of products and services with additional remuneration of personnel, labor, taxation and social contributions of enterprises to the FCMIF, PFR and SIF, as well as contributions to the development of the enterprise. | In contrast to the well-known macroeconomic models of managing the country’s economy and microeconomic models of managing the development of enterprises [28-30] the developed method allows us to simultaneously take into account the interests of the labor collective, managers and shareholders of enterprises and the state as a whole through the use of progressive mathematical models aimed at solving the main tasks, the purpose of which is the effective management of social contributions to the PFR, FCMIF, SIF and effective, interrelated relationships with the needs of working citizens in wage growth, by the state and owners on the basis of making complex scientifically based management decisions with a synergistic effect. This approach gives a significant increase in the economic, social and professional efficiency of working citizens and the economy of the country as a whole in comparison with their work, provided that the interests of only one of the parties are taken into account: working citizens, business owners or the state as an institution for data collection. taxes and social contributions of citizens and enterprises. Thus, the difference between the methodology of this scientific research compared to analogues lies in the complexity and comprehensiveness of the management of the enterprise and working citizens, based on the interests of all participating groups of beneficiaries. |
| 3 | Investment Efficiency | An approach to the economic assessment of the effectiveness of the development of the country’s economy and enterprises, as well as investments in the development of enterprises, equipping the workplace of an employee and improving his qualifications, which consists in making a management decision to redistribute the effect of reducing the cost of products, services, works, goods associated with the growth of income of enterprises per employee, and the direction of this effect on the increase in wages and the development of the enterprise. | This approach differs from other methods of assessing enterprises and the country’s economy, as well as the effectiveness of investments [45; 54; 66] in that the criterion for the effectiveness of the management decision is the growth of wages of the workforce and the growth of the welfare of the population, which is ensured by the optimal redistribution of the effect of reducing the cost of goods between wages, enterprise development, social contributions, taxation of enterprises, while taking into account the interests of all beneficiaries. In addition, in the author’s approach, additional profit from increased sales is directed to investments in the entrepreneurship development fund, payroll, taxation and social contributions, the amount of which significantly depends on the average monthly revenue of enterprises per working citizen, which motivates him to high effective, high-performance work makes him not in words, but on a participant in labor relations interested in the development of the enterprise where he works and the country in which he lives. Thus, the author’s methodology makes such an approach to social technologies for financing enterprises and the country’s economy closed, complex and dynamic, increasing the well-being of citizens working at the enterprise. |
| 4 | Socio-economic Security | An approach to ensuring the social and financial security of the state and the population is proposed, the essence of which is that the authors propose technologies that ensure wage growth, bringing the pension level to 40% of wages in four years; in 8 years – up to 60% of wages; in 10 years – up to 80% of wages fees, an increase in total FCMIF and PFR receipts, as well as tax on profit, income tax and VAT by 30% of the base level, while reducing FCMIF and PFR receipts by 14.08% over five years. | In contrast to the works [74; 80], the developed technology is aimed at increasing the investment attractiveness of the country’s economy and domestic enterprises by applying in practice the progressive system of personnel labor incentives developed by the authors and the optimal distribution of funds from reducing the cost of production and investments between the payroll, development fund and contributions to the PFR, FCMIF, income tax, VAT and tax on profit are based on solving the problem of economic and mathematical modeling and using social technologies of financing to manage enterprises and the economy of the country as a whole. |
| 5 | Cash Flow Management | A comprehensive model for managing the cash flows of an enterprise, its income and expenses, cost, unit fixed costs and unit variable costs, the effect of cost reduction, tax and social deductions from the sale of products has been developed. | The proposed model differs from the models used for managing financial flows of enterprises [99; 105; 109; 126], by enabling management decision makers to coordinate investment programs and plans depending on the prices of final products, goods, works, services, their volumes and production costs, which contributes to the growth of profitability of investments in the economy of the country and enterprises, labor productivity of personnel (citizens working at the enterprise) and finance for the development of enterprises. |
| 6 | Economic and Mathematical Modeling | A new formulation and approach to solving the problem of nonlinear programming about the optimal combination of labor wages compatible with an increase in company revenue, tax revenues, which is important for the development of the state and the growth of the welfare of its citizens, and to the enterprise development fund, which is important for its management and shareholders, owners, are proposed. | In contrast to the famous researchers devoted to solving the problem of investment allocation [130; 133; 137; 138], in the author’s approach, the company’s budget is used as a source of financing, which is formed by contributions to the development fund, depending on the effectiveness of each employee’s activities. This approach allows the most efficient redistribution of financial flows between the payroll fund, the enterprise development fund, taxation and social contributions and provides sources of financing for equipping the workplace of personnel, improving the skills of employees, involves all personnel in the enterprise management. |
| 7 | Business Process Management | An economic and mathematical model of wage maximization consistent with the growth of the revenue, process management of cash flows of enterprises, characterized by a systematic combination of methods of nonlinear programming, economic and mathematical modeling, social financial technologies, has been developed, this makes it possible to create tools for managing the cash flow and development of enterprises and to develop standard projects of management decision support systems with the prospect of their integration into existing and promising information and analytical systems at enterprises that ensure a combination of the interests of the workforce, owners, managers of enterprises and the state. | The developed complex model of nonlinear programming, which maximizes wages consistent with the growth of the company’s revenue and the funds that are released from the company by reducing the cost, allows us to find an optimal scientifically based management solution to the complex problem of combining and taking into account the development goals of the state, the enterprise and the needs of the workforce by dividing into smaller subtasks: increasing the wages of the labor collective through the use in practice of material and moral factors to increase productivity and labor efficiency, revenue growth at the enterprise, reduction in the unit cost of production, increase in contributions to the development fund and wages, tax deductions and social contributions to the FCMIF, PFR and SIF, each of which represents a well-known task of economic andmathematical modeling, and then the integration of the results into a comprehensive management decision-making system at the stage of practical implementation by applying additional criteria: market capacity, profit share, aimed at increasing material incentives for personnel, for the development of the economies of countries and enterprises, for investment, etc. |
Thus, the literature review presented in Tables 1 and 2 allowed us to conclude that in scientific research there are practically no economic and mathematical models and technologies of social financing of enterprises using methods of nonlinear programming and mathematical optimization, which allow the manager to ensure the relationship of financial indicators of enterprises (revenue, profit, unit cost of production) and a progressive system of material incentives for the labor of citizens working at enterprises, as well as tax and social contributions to the FCMIF, PFR and SIF, which allows for a synergistic effect as a result of taking into account the needs of workers (citizens working at enterprises), owners, managers of enterprises, budgets of all levels (federal and territorial) and the state as a whole. The article [25] shows that social financial technologies are based on the construction of models of economic and mathematical optimization, flowcharts, tools, algorithms, software products and environments and allow solving two problems:
1) Efficient allocation of enterprises’ contributions to off-budget funds and their subsequent use (PFR, FCMIF, SIF).
2) Effective distribution and accounting at enterprises of the needs of the state, owners, shareholders and the workforce.
The solution to the first problem should be sought in the transition of healthcare and pension insurance to personalized medical and pension accounts of citizens [25-27; 85-95].
The article [25] solves the second problem of optimizing social financial technologies, taking into account various interests both in the country as a whole and within labor relations at enterprises.
In the same article, using a nonlinear model, it is also proved that in the case of an increase in wages at an enterprise above the average in Russia, it is advantageous for the state to reduce deductions to FCMIF by increasing tax deductions due to wage growth.
In the article [93], using a nonlinear model, it is also proved that when wages increase above the average in Russia (consistent with revenue growth), it is advantageous for state and employer to reduce deductions to the PFR.
In the article [95], using a nonlinear model, it is proved that when switching, starting from 2021, to personalized accumulative pension accounts (PAPA) for 19 years (by 2039), 11,833,027 rubles will accumulate on PAPA of working citizens (with an average salary of 54,175 rubles), which is enough to provide a pension in the amount of 80% of wages for 20 years, which corresponds to the expected period of survival.
In other words, after 2038, every working citizen with a salary of 52,355 rubles (the average salary in Russia in August 2021) will have an amount of 11,099,133.99 rubles on his account, which is enough to receive a monthly pension of 80% of the national average salary for the rest of his life (the survival period). Accordingly, enterprises after 2038 can stop deducting 22% of wages in favor of citizens, which will reduce the unit cost of goods produced in the country, and hence the price of their sale to the population, and this in turn is already an effective method of combating inflation in the country.
This article shows that the post-retirement transition to a reduction in the percentage of deductions from wages for pension and medical support of citizens from the first (2021), and not from 2038, is much more profitable for the labor collective, employers and the state.
In this article, the main contradiction is noted, which consists in the fact that the existing organizational, economic and scientific support for the development of enterprises does not create prerequisites for improving the efficiency of their work, the introduction of progressive technologies for material and moral stimulation of the labor of performers and administrative and managerial personnel, advanced social technologies for financing the economy of the country and the development of enterprises, as well as social security of employees.
The existing processes of socio-financial development of the country’s economy and individual enterprises can be characterized as extremely inefficient, since there is no holistic scientific and methodological approach integrated into everyday practice to develop and apply effective management solutions based on optimization tools, models and breakthrough financial management algorithms. The low efficiency of managing the country’s economy and the socio-financial activities of enterprises is associated with the fragmentation and imperfection of the mathematical apparatus and tools used in practice, as well as methods of stimulating labor. Attempts to create a full-fledged integrated enterprise development management system, including a progressive incentive system for employees, receipts to the development fund, as well as effective financial resource management mechanisms based on the methodology of nonlinear programming of enterprise development management processes and their individual assets, organizational and structural units built in this article, are presented in [25-27; 85-95], but their main drawback is that the issues of social financing of the Russian economy and domestic enterprises have not been fully worked out, mutually linking the interests of the state, the labor collective, owners, shareholders, heads of enterprises, problems of enterprise taxation management, social contributions to the PFR, FCMIF and SIF are not fully reflected depending on from the growth of revenue of enterprises, the growth of employee productivity, criteria for making informed management decisions have not been developed, aimed at organizing effective labor relations in the company.
Ambitious goals require advanced social financial technologies and optimization models for the development of enterprises and promising systems for financing their activities, taking into account the optimization of taxation and social contributions to FCMIF, PFR and SIF. Nonlinear processes and computational methods in the management of such systems are becoming increasingly relevant as the most effective tools for making managerial decisions and providing scientifically sound algorithms and models for the development of management objects. When managing complex systems with many interrelated parameters, it becomes necessary to use algorithms and methods of nonlinear programming to achieve the optimal result from the set of possible values of the dependent variable with limited ranges of changes in influencing factors. As a rule, both the objective function and each of the inequalities of the system of constraints of the optimization problem in most modern control models of real processes are nonlinear functions, which imposes additional restrictions on control objects and requires special mathematical models and instrumental methods for solving such problems. Thus, optimization methods, in particular nonlinear programming models, have proven themselves well in macroeconomic problems and problems of managing the development of enterprises using social financing technologies [85; 88; 91].
Thus, economic and mathematical modeling of a complex system of social financing of the country’s economy and enterprises, optimization of employees’ wages tied to the company’s revenue, optimization of the size of the enterprise development fund, which is important for the owners of enterprises and all employees, as well as taxes, which ensures the performance of state functions, a well-thought-out policy towards existing and potential consumers and categories of goods, an instrumental basis for managing the development of enterprises, taking into account promising and effective technologies for their financing and investment in development, structural analysis, system analysis, factors of the internal and external environment, a scientifically sound personnel policy and a system of motivation of performers and administrative and managerial personnel is an important problem for the national economy.
The purpose of the study is to build and implement an optimization model of an integrated system of social financing of the country’s economy and enterprises, maximizing the wages of the workforce associated with income for the development of the enterprise, which is important and relevant for owners and shareholders, the management of the enterprise, increasing revenue, taxation and contributions to off-budget funds, which is relevant for the state.
The object of the study is the average Russian enterprise, its financial flows, taxation and social contributions to extra-budgetary funds (FCMIF, PFR and SIF). The article discusses social financial technologies with the average monthly salary of employees according to the Federal State Statistics Service, the share of wages in the structure of gross domestic product (GDP) of Russia in the amount of 44.9% and the profitability of products in the amount of 9.9%.
The subject of the study is modeling the optimal distribution of investments in wages of labor, consistent with revenue growth, in the enterprise development fund, taxation and deductions to off-budget funds, which is relevant for the state, using methods of nonlinear programming and process management.
For the purposes of this article, we will define the concepts of “products”, “goods”, “work”, “service”. According to Article 38 of the Tax Code of the Russian Federation, by goods we will mean any property sold or intended for sale. Without loss of meaning in this article, the terms “products” and “goods” are identified.
Work is an activity whose results have a material expression and can be implemented to meet the needs of an organization and (or) individuals.
A service is an activity whose results have no material expression, are realized and consumed in the process of carrying out this activity.
2. Materials and Methods
The financial system of Russia consists of three subsystems: public finance; finance of enterprises (organizations) and household finance. As shown in [92], the basis of the Russian financial system is working citizens, on whose well-organized and motivated work its condition depends. The personnel of enterprises providing services to the population, performing work, producing products and essential goods also need to create and implement in daily practice an effective motivation system that can become a source of scientifically sound management decisions, involve each employee of the enterprise (organization) in the management system of all divisions of the enterprise. enterprises create the material and moral foundations of responsibility for the quality and efficiency of their work. The foundation of the motivation system can be an economic and mathematical model of enterprise profit management, which is considered in the works [25; 88; 90; 95]. The introduction of this model into the daily activities of enterprises for many years has shown their high efficiency, allows you to manage profits due to the optimal ratio of such economic indicators of enterprises as prices for products, goods, works, services, production volumes and sales of enterprise products, cost. When managing enterprises, optimization models of profit management make it possible to link the reduction in the cost of enterprises’ products, which provides additional demand for products and goods, with an increase in their production and sales volumes. Moreover, the growth of volumes allows you to get a double effect. The first is directly related to the growth of volumes. The second is associated with a reduction in the cost of production, due to a reduction in unit fixed costs with the growth of the company’s production.
One of the key tasks of this work is to build a comprehensive system of stimulating the work of personnel of enterprises, analysis and justification of ways to improve the working conditions and workplace of employees of enterprises, without motivation and initiative work of which it is impossible to achieve high financial results.
The work [94] shows that the most important factor in improving the Russian finance system are working citizens, on whose material and moral incentives depend not only household incomes (family budgets), but also the fullness of budgets at all levels of the financial system, namely: the finances of the state and the finances of economic entities (enterprises, organizations). Thus, there is a need to create such an economic and mathematical model that would allow calculating the amount of material incentives for employees of enterprises and all restrictions on the range of changes affecting its size factors. We will build an optimization model that ensures the maximization of material incentives for the work of employees of enterprises and the level of financial contributions for its development is not lower than indicated.
A common practice of managing the development of enterprises is the material stimulation of workers’ labor as a percentage of total revenue. Therefore, as a target function of the developed model, we will take the amount of deductions from the company’s revenue directed to financial incentives for employees: Salj = θj · Revj / 12 → max, where Salj stands for the monthly financial remuneration of employees of the j-th division of the enterprise in rubles; θj stands for the percentage of revenue from the revenue of the j-th division of the enterprise, directed to stimulating the work of performers (employees of the j-th division) in fractions of units; Revj stands for the revenue of the j-th division of the enterprise in rubles.
To stimulate the company’s employees to increase revenue and productivity of their labor, it is necessary to create a progressive scale of material remuneration. In other words, the percentage of income allocated to the remuneration of employees of the enterprise should depend on the amount of this income, i.e. θj(Revj). We will assume that all income earned by employees of the enterprise in excess of the base amount is distributed between employees and the enterprise in pre-established ratios. Let’s call this ratio the coefficient of redistribution of the financial result between the labor collective and the management, owners, shareholders of the enterprise and denote it ξ. Then the financial result received by the enterprise will be redistributed between employees and the enterprise in the following proportions:
- Salj = (Revj / 12) • θbj + ξ • (FRj – FRbj) / 12 – this part of the income will be used to stimulate the work of employees.
- Therefore, the amount of income that will be directed to the development of the enterprise is equal to Revdevj = (FRbj / 12) + ξ • [(FRj – FRbj) / 12] • (1 – Taxprof).
From the formulas presented above, it is possible to deduce the dependence of the parameter θj on the revenue growth of the enterprise, i.e. to create a progressive system of material and moral incentives for employees, in which the amount of remuneration directly depends on the revenue of the enterprise and at the same time the value of the percentage θj does not remain constant, but grows with the growth of revenue. This means that the increase in material incentives for employees occurs under the influence of a double effect: a) depending on the growth of revenue; b) on the change in the amount of interest directed to stimulating the work of employees. Thus, the amount of interest allocated to stimulate the work of employees has the following form: , where Revbj stands for the base revenue of the j-th division of the enterprise in rubles; θbj stands for the share of the basic income of the enterprise, which goes to stimulate the work of employees in fractions of units.
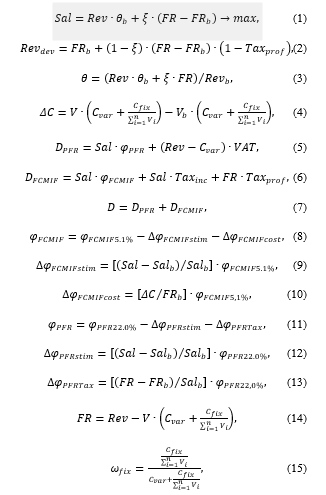
Combining all of the above, we will build an optimization model that belongs to the class of nonlinear programming models that maximizes the wages of employees with the growth of the company’s income, integrated with income for its development (relevant for the employer and the entire workforce as a whole), taxation and contributions to off-budget funds):
Target Function
![]()
when Sal stands for the salary of employees in rubles; Salb stands for the base salary of employees in the first case simulation in rubles; Rev stands for the revenue in rubles; θ stands for the share of the income of the enterprise, which goes to stimulate the work of employees in fractions of units; ξ stands for the coefficient of redistribution of the financial result between the labor collective and the management, owners, shareholders of the enterprise; ΔC stands for the unit cost reduction in rubles; Revdev stands for the value of the development fund in rubles; Revb stands for the base revenue in the first case simulation in rubles; θb stands for the share of the basic income of the enterprise, which goes to stimulate the work of employees in fractions of units; V stands for the number of products sold by the enterprise in units; Vb stands for the base number of products sold by the enterprise in the first case simulation in units; Cvar stands for the unit variable costs in rubles; Cfix stands for the total fixed costs in rubles; stands for the total number of products sold by the enterprise in units; n stands for the total number of divisions of the enterprise in units; DPFR stands for the amount of value added tax and receipts to the PFR in rubles; DFCMIF stands for the amount of tax on profit, income tax and receipts in FCMIF in rubles; D stands for the total deductions of the enterprise in rubles; φPFR stands for the rate contributions to the PFR in %; φPFR22.0% stands for the base rate of deductions to the PFR in the first case simulation, equal to 22.0% of the wage fund (WF) in %; ΔφPFRstim stands for the change in the rate of deductions to the PFR related to wage growth in %; ΔφPFRTax stands for the change in the rate of deductions to the PFR due to the increase in value added tax in %; φFCMIF stands for the rate of deductions to the FCMIF in %; φFCMIF5.1% stands for the base rate of deductions to the FCMIF in the first case simulation, equal to 5.1% of the wage fund (WF) in %; ΔφFCMIFstim stands for the change in the rate of deductions in FCMIF related to wage growth in %; ΔφFCMIFcost stands for the change in the rate of deductions to the FCMIF due to the effect of cost reduction in %; FR stands for the financial result or profit in rubles; FRb stands for the base financial result or base profit in the first case simulation in rubles; VAT stands for the rate of value added tax (VAT), 20%; Taxprof stands for the tax on profit rate, 20%; Taxinc stands for the income tax rate, 13%; ωvar stands for the share of variable costs in fractions of units; ωfix stands for the share of fixed costs in fractions of units.
The main limitations, prerequisites and assumptions used in the development and practical implementation of the optimization model (1)-(16):
- personalized pension accounts and medical savings accounts are used as a source of financing for pension provision and healthcare of citizens working at the enterprise, which means that part of the social contributions that the enterprise makes to the FCMIF and the PFR go to medical savings accounts and personalized accounts of citizens;
- information about the cost structure, operating and investment activities, as well as financial results provided by the management and employees of the analyzed enterprise is correct, complete and reliable;
- any hidden (not explicitly stated) factors will not have a significant impact on the company and the results of the practical application of the model (1)-(16);
- the company is active and will continue its business activities in the foreseeable future;
- in the future, the responsible attitude of the owners of the enterprise and the competent management of its operational activities will remain;
- the company will comply with all applicable provisions of laws and regulations, especially in terms of taxation and social contributions;
- the enterprise has, will receive or will extend all necessary permits and licenses on which the functioning of the enterprise and the applicability of the economic and mathematical model developed by the authors are based (1)-(16);
- all cash flows received from operating activities occur during the same year to which the corresponding income received and expenses incurred relate.
Figure 2 shows a flowchart of the integrated system of social financing of enterprises, which reflects in detail the main aspects and criteria for making key management decisions and shows the optimal strategy for the practical implementation of the optimization model (1)-(16).
A more detailed algorithm and tools for the practical application of social technologies for financing the Russian economy and enterprises are given in the section “Results”.
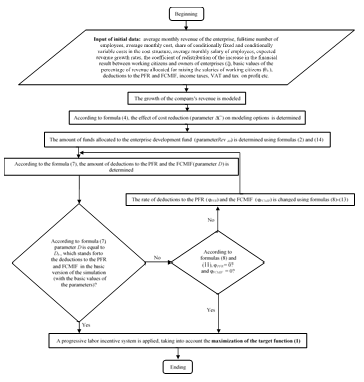
Figure 2: Block Diagram of the Complex System of Social Financing of Enterprises
3. Results
Table 3 shows the practical implementation of the optimization model (1)-(16). Column 1 shows the number of the simulation variant, which corresponds to the year shown in columns 2 and 15 of Table 3. The first simulation variant is the basic one and corresponds to the 2021st year, in which the basic values of the parameters being changed are indicated. The salary according to the Federal State Statistics Service for November 2023 is 63,060 rubles (see row 1, columns 10 and 13 of Table 3). The share of wages in the structure of Russia’s gross domestic product (GDP) is 44.9%, and the profitability of products sold is 9.9%. Formula (1) establishes the basic parameters and the relationship between them, namely: wages (Sal), enterprise income (Rev) and the share of the income of the enterprise, which goes to stimulate the work of employees. Since FR – FRb = 0 in the first case simulation, it is possible to determine the revenue of enterprises by dividing wages by the share of wages in the GDP structure (Rev = Sal : θb), i.e. 63,060 rubles : 0.449 (44.9%) = 140,445.43 rubles (see column 3 of Table 3).
The cost of production is equal to the revenue of enterprises minus the profit from the sale of products, which is 140,445.43 rubles · 0.099 = 13,904.10 rubles. This means that the cost price will be: 140,445.43 rubles – 13,904.10 rubles = 126,541.34 rubles (see the first row, column 4 of Table 3). Next, we increase the company’s revenue by 3% per year, which corresponds to the growth rate of average wages in [95]. As shown above, the revenue of enterprises is equal to the amount of wages divided by its share in the structure of GDP. So, for the second row of Table 1, the income is 63,060 rubles • 1.03 (average wage growth rate) : 0.449 = 144,658.80 rubles, for the tenth modeling option 63,060 rubles • 1.039 : 0.449 = 183,249.44 rubles, etc. In the latest version of the simulation, the revenue of enterprises per employee exceeds the basic version of the simulation by 4.38 times.
In the production of products, the total costs are divided into fixed (63,035.89 rubles, see column 7), which do not depend on the volume of products, and variable (42,023.92 rubles in the basic version of modeling, see column 8 of Table 3). At the same time, the share of fixed costs is equal to 60% of total costs in the basic version of modeling (ωfix = 60%, see line 1 of Table 3), and the share of variables is 40% of total costs (ωvar = 40%). With an increase in production volumes, unit costs decrease, and the share of fixed costs in the cost structure also decreases, which makes it possible to direct the released financial resources to additional material incentives for employees, i.e. to introduce a progressive system of material incentives for labor (see column 13 of Table 3). The meaning of this system is that with an increase in labor productivity increases the share of the income of the enterprise, which goes to stimulate the work of employees (θ), as shown in column 11 of Table 3. The share of fixed costs (ωfix) is determined by the formula (15), and the share of variable costs (ωvar) is determined by the formula (16). Variable costs depend on the quantity of products produced, while fixed costs do not.
The progressive system of material remuneration (objective function (1)) makes it possible to increase wages faster (see column 13) compared to the data in column 10 of Table 3, namely: more than eight times compared to the basic modeling option at annual growth rates of the volumes of products, services and works produced and sold, equal to 3.0% (see column 14 of Table 3).
Table 3: Progressive Labor Incentive System
| Option number | Year | The revenue of enterprises per employee with a share of wages in its structure of 44.9% in the first (basic) version of the simulation, rubles per month | The cost of production per employee with a profitability of 9.9% in the first (basic) version of the simulation, rubles per month | The share of fixed costs | The share of variable costs | Total fixed costs, rubles per month | Total variable costs, rubles per month | The effect of cost reduction, rubles per month | The average monthly nominal accrued salary, rubles per month | The share of the company’s income allocated to wages | Wage growth, rubles per month | Innovative technology of material remuneration of employees, rubles per month | Wage index |
| 1 | 2 | 3 | 4 | 5 | 6 | 7 | 8 | 9 | 10 | 11 | 12 | 13 | 14 |
| 1 | 2023 | 140,445.43 | 126,541.34 | 60.00% | 40.00% | 75,924.80 | 50,616.53 | 0.00 | 63,060 | 44.90% | 0.00 | 63,060 | 1.000 |
| 2 | 2024 | 144,658.80 | 128,059.83 | 59.29% | 40.71% | 75,924.80 | 52,135.03 | 2,277.74 | 64,952 | 45.40% | 2,155.89 | 67,108 | 1.064 |
| 3 | 2025 | 148,998,56 | 129,623.88 | 58.57% | 41.43% | 75,924.80 | 53,699.08 | 4,623.82 | 66,900 | 45.90% | 4,376.46 | 71,277 | 1.130 |
| 4 | 2026 | 153,468.52 | 131,234.86 | 57.85% | 42.15% | 75,924.80 | 55,310.05 | 7,040.28 | 68,907 | 46.40% | 6,663.65 | 75,571 | 1.198 |
| 5 | 2027 | 158,072.57 | 132,894.16 | 57.13% | 42.87% | 75,924.80 | 56,969.36 | 9,529.23 | 70,975 | 46.90% | 9,019.45 | 79,994 | 1.269 |
| 6 | 2028 | 162,814.75 | 134,603.24 | 56.41% | 43.59% | 75,924.80 | 58,678.44 | 12,092.85 | 73,104 | 47.40% | 11,445.93 | 84,550 | 1.341 |
| 7 | 2029 | 167,699.19 | 136,363.59 | 55.68% | 44.32% | 75,924.80 | 60,438.79 | 14,733.38 | 75,297 | 47.90% | 13,945.20 | 89,242 | 1.415 |
| 8 | 2030 | 172,730.17 | 138,176.75 | 54.95% | 45.05% | 75,924.80 | 62,251.95 | 17,453.13 | 77,556 | 48.40% | 16,519.45 | 94,075 | 1.492 |
| 9 | 2031 | 177,912.07 | 140,044.31 | 54.21% | 45.79% | 75,924.80 | 64,119.51 | 20,254.47 | 79,883 | 48.90% | 19,170.93 | 99,053 | 1.571 |
| 10 | 2032 | 183,249.44 | 141,967.90 | 53.48% | 46.52% | 75,924.80 | 66,043.10 | 23,139.84 | 82,279 | 49.40% | 21,901.95 | 104,181 | 1.652 |
| 11 | 2033 | 188,746.92 | 143,949.19 | 52.74% | 47.26% | 75,924.80 | 68,024.39 | 26,111.78 | 84,747 | 49.90% | 24,714.90 | 109,462 | 1.736 |
| 12 | 2034 | 194,409.33 | 145,989.92 | 52.01% | 47.99% | 75,924.80 | 70,065.12 | 29,172.88 | 87,290 | 50.40% | 27,612.24 | 114,902 | 1.822 |
| 13 | 2035 | 200,241.61 | 148,091.88 | 51.27% | 48.73% | 75,924.80 | 72,167.08 | 32,325.81 | 89,908 | 50.90% | 30,596.51 | 120,505 | 1.911 |
| 14 | 2036 | 206,248.86 | 150,256.89 | 50.53% | 49.47% | 75,924.80 | 74,332.09 | 35,573.33 | 92,606 | 51.40% | 33,670.29 | 126,276 | 2.002 |
| 15 | 2037 | 212,436.32 | 152,486.85 | 49.79% | 50.21% | 75,924.80 | 76,562.05 | 38,918.27 | 95,384 | 51.90% | 36,836.30 | 132,220 | 2.097 |
| 16 | 2038 | 218,809.41 | 154,783.71 | 49.05% | 50.95% | 75,924.80 | 78,858.91 | 42,363.57 | 98,245 | 52.40% | 40,097.28 | 138,343 | 2.194 |
| 17 | 2039 | 225,373.69 | 157,149.48 | 48.31% | 51.69% | 75,924.80 | 81,224.68 | 45,912.22 | 101,193 | 52.90% | 43,456.09 | 144,649 | 2.294 |
| 18 | 2040 | 232,134.90 | 159,586.22 | 47.58% | 52.42% | 75,924.80 | 83,661.42 | 49,567.33 | 104,229 | 53.40% | 46,915.67 | 151,144 | 2.397 |
| 19 | 2041 | 239,098.95 | 162,096.06 | 46.84% | 53.16% | 75,924.80 | 86,171.26 | 53,332.09 | 107,355 | 53.90% | 50,479.03 | 157,834 | 2.503 |
| 20 | 2042 | 246,271.92 | 164,681.20 | 46.10% | 53.90% | 75,924.80 | 88,756.40 | 57,209.80 | 110,576 | 54.40% | 54,149.30 | 164,725 | 2.612 |
| 21 | 2043 | 253,660.08 | 167,343.89 | 45.37% | 54.63% | 75,924.80 | 91,419.09 | 61,203.84 | 113,893 | 54.90% | 57,929.67 | 171,823 | 2.725 |
| 22 | 2044 | 261,269.88 | 170,086.47 | 44.64% | 55.36% | 75,924.80 | 94,161.66 | 65,317.69 | 117,310 | 55.40% | 61,823.45 | 179,134 | 2.841 |
| ………………………………….. | |||||||||||||
| 50 | 2072 | 597,766.59 | 291,359.88 | 26.06% | 73.94% | 75,924.80 | 215,435.08 | 247,227.82 | 268,397 | 69.40% | 234,002.09 | 502,399 | 7.967 |
| 51 | 2073 | 615,699.58 | 297,822.93 | 25.49% | 74.51% | 75,924.80 | 221,898.13 | 256,922.39 | 276,449 | 69.90% | 243,178.04 | 519,627 | 8.240 |
Table 4: Progressive system of reducing the tax burden on enterprises
| Option number | Year | Growth of the development fund, rubles per month | Receipts to the development fund, rubles per month | The rate contributions to the PFR | Index of deduc-tions to the PFR | The rate of deductions to the FCMIF | Index of deduc-tions to the FCMIF | Income tax rate | Tax on profit rate | VAT rate | Financial result, rubles per month | Increase in VAT deductions, rubles | Deductions to the PFR + VAT, rubles per month | Deductions to the FCMIF + income tax + tax on profit rate, rubles per month | Deductions to the PFR + deductions to the FCMIF + income tax +tax on profit rate + VAT, rubles per month |
| 1 | 2 | 3 | 4 | 5 | 6 | 7 | 8 | 9 | 10 | 11 | 12 | 13 | 14 | 15 | 16 |
| 1 | 2023 | 0.00 | 13,904.10 | 22.00% | 1.00 | 5.10% | 1.00 | 13.00% | 20.00% | 20.00% | 13,904.10 | 0.00 | 31,838.98 | 14,194.68 | 46,033.66 |
| 2 | 2024 | 431.18 | 14,335.28 | 19.87% | 0.90 | 3.88% | 0.76 | 13.00% | 20.00% | 20.00% | 14,335.28 | 538.97 | 31,838.98 | 14,194.68 | 46,033.66 |
| 3 | 2025 | 875.29 | 14,779.39 | 17.93% | 0.81 | 2.77% | 0.54 | 13.00% | 20.00% | 20.00% | 14,779.39 | 1,094.12 | 31,838.98 | 14,194.68 | 46,033.66 |
| 4 | 2026 | 1,332.73 | 15,236.83 | 16.15% | 0.73 | 1.75% | 0.34 | 13.00% | 20.00% | 20.00% | 15,236.83 | 1,665.91 | 31,838.98 | 14,194.68 | 46,033.66 |
| 5 | 2027 | 1,803.89 | 15,707.99 | 14.52% | 0.66 | 0.82% | 0.16 | 13.00% | 20.00% | 20.00% | 15,707.99 | 2,254.86 | 31,838.98 | 14,194.68 | 46,033.66 |
| 6 | 2028 | 2,289.19 | 16,193.28 | 13.02% | 0.59 | 0.00% | 0.00 | 13.00% | 20.00% | 20.00% | 16,193.28 | 2,861.48 | 31,838.98 | 14,230.13 | 46,069.10 |
| 7 | 2029 | 2,789.04 | 16,693.14 | 11.64% | 0.53 | 0.00% | 0.00 | 13.00% | 20.00% | 20.00% | 16,693.14 | 3,486.30 | 31,838.98 | 14,940.11 | 46,779.09 |
| 8 | 2030 | 3,303.89 | 17,207.99 | 10.36% | 0.47 | 0.00% | 0.00 | 13.00% | 20.00% | 20.00% | 17,207.99 | 4,129.86 | 31,838.98 | 15,671.39 | 47,510.37 |
| 9 | 2031 | 3,834.19 | 17,738.28 | 9.17% | 0.42 | 0.00% | 0.00 | 13.00% | 20.00% | 20.00% | 17,738.28 | 4,792.73 | 31,838.98 | 16,424.61 | 48,263.59 |
| 10 | 2032 | 4,380.39 | 18,284.49 | 8.06% | 0.37 | 0.00% | 0.00 | 13.00% | 20.00% | 20.00% | 18,284.49 | 5,475.49 | 31,838.98 | 17,200.42 | 49,039.40 |
| 11 | 2033 | 4,942.98 | 18,847.08 | 7.03% | 0.32 | 0.00% | 0.00 | 13.00% | 20.00% | 20.00% | 18,847.08 | 6,178.73 | 31,838.98 | 17,999.51 | 49,838.49 |
| 12 | 2034 | 5,522.45 | 19,426.55 | 6.07% | 0.28 | 0.00% | 0.00 | 13.00% | 20.00% | 20.00% | 19,426.55 | 6,903.06 | 31,838.98 | 18,822.57 | 50,661.55 |
| 13 | 2035 | 6,119.30 | 20,023.40 | 5.16% | 0.23 | 0.00% | 0.00 | 13.00% | 20.00% | 20.00% | 20,023.40 | 7,649.13 | 31,838.98 | 19,670.33 | 51,509.31 |
| 14 | 2036 | 6,734.06 | 20,638.16 | 4.32% | 0.20 | 0.00% | 0.00 | 13.00% | 20.00% | 20.00% | 20,638.16 | 8,417.57 | 31,838.98 | 20,543.52 | 52,382.50 |
| 15 | 2037 | 7,367.26 | 21,271.36 | 3.53% | 0.16 | 0.00% | 0.00 | 13.00% | 20.00% | 20.00% | 21,271.36 | 9,209.07 | 31,838.98 | 21,442.90 | 53,281.88 |
| 16 | 2038 | 8,019.46 | 21,923.55 | 2.78% | 0.13 | 0.00% | 0.00 | 13.00% | 20.00% | 20.00% | 21,923.55 | 10,024.32 | 31,838.98 | 22,369.26 | 54,208.24 |
| 17 | 2039 | 8,691.22 | 22,595.32 | 2.08% | 0.09 | 0.00% | 0.00 | 13.00% | 20.00% | 20.00% | 22,595.32 | 10,864.02 | 31,838.98 | 23,323.42 | 55,162.40 |
| 18 | 2040 | 9,383.13 | 23,287.23 | 1.42% | 0.06 | 0.00% | 0.00 | 13.00% | 20.00% | 20.00% | 23,287.23 | 11,728.92 | 31,838.98 | 24,306.20 | 56,145.18 |
| 19 | 2041 | 10,095.81 | 23,999.90 | 0.79% | 0.04 | 0.00% | 0.00 | 13.00% | 20.00% | 20.00% | 23,999.90 | 12,619.76 | 31,838.98 | 25,318.46 | 57,157.44 |
| 20 | 2042 | 10,829.86 | 24,733.96 | 0.20% | 0.01 | 0.00% | 0.00 | 13.00% | 20.00% | 20.00% | 24,733.96 | 13,537.32 | 31,838.98 | 26,361.09 | 58,200.07 |
| 21 | 2043 | 11,585.93 | 25,490.03 | 0.00% | 0.00 | 0.00% | 0.00 | 13.00% | 20.00% | 20.00% | 25,490.03 | 14,482.42 | 32,448.20 | 27,435.00 | 59,883.20 |
| 22 | 2044 | 12,364.69 | 26,268.79 | 0.00% | 0.00 | 0.00% | 0.00 | 13.00% | 20.00% | 20.00% | 26,268.79 | 15,455.86 | 33,421.64 | 28,541.13 | 61,962.77 |
| ………………………………….. | |||||||||||||||
| 50 | 2072 | 46,800.42 | 60,704.52 | 0.00% | 0.00 | 0.00% | 0.00 | 13.00% | 20.00% | 20.00% | 60,704.52 | 58,500.52 | 76,466.30 | 77,452.81 | 153,919.11 |
| 51 | 2073 | 48,635.61 | 62,539.71 | 0.00% | 0.00 | 0.00% | 0.00 | 13.00% | 20.00% | 20.00% | 62,539.71 | 60,794.51 | 78,760.29 | 80,059.47 | 158,819.76 |
The developed optimization model makes it possible to increase the salaries of employees, which is beneficial to both the state and shareholders, managers and owners of enterprises. The algorithm of practical implementation of the optimization model is as follows.
Formula (14) is used to calculate the financial result, which is given in column 12 of Table 4, and formula (4) is used to calculate the effect of reducing unit costs (see column 9 of Table 3).
Formula (5) is used to calculate receipts to the VAT and PFR (see column 14 of Table 4), and formula (6) is used to determine the values of column 15 of Table 4. To calculate the data presented in column 16 of Table 4, formula (7) is used. The data in column 16 of Table 4 are equal to the sum of the values in the columns 14 and 15 of Table 4.
Formula (3) is used to calculate the share of the company’s income, which is used to increase the salaries of employees. Formulas (1) and (2) are used to calculate the increase in wages and the development fund (column 12 of Table 3 and column 3 of Table 4, respectively). The coefficient ξ is equal to 0.8, which means that 80% of the increase in the financial result of enterprises from the sale of products is directed to the salaries of employees, and 20% is directed to the development fund. This distribution of the financial result is taken from the ratio of wages and financial result in the basic version (63,060 rubles : 13,904.10 rubles = 4.5). We will show an algorithm for calculating deductions for salary increases and to the entrepreneurship development fund using the example of the second row of column 12 of Table 3 and column 3 of Table 4. According to the formula (14), the financial result is 144 658.80 rubles (the company’s revenue per employee, see row 2, column 3 of Table 3) – 128 059.83 rubles (the cost of production per employee) = 16,598.96 rubles. The increase compared to the basic version of the simulation is 2,694.86 rubles = 16,598.96 rubles – 13,904.10 rubles (the financial result in the basic version of the simulation, see row 1, column 12 of Table 4). Then for the second row of column 12 of Table 3, the wage increase according to the formula (1) is equal to 2,155.89 rubles. = 2,694.86 rubles (increase in financial result relative to the base value) • 0.8 (coefficient of redistribution of financial result between employees and owners, managers, shareholders of enterprises), and an increase in contributions to the development fund (see the second row, column 3 of Table 4) is 431.18 rubles = 2,694.86 rubles (increase in financial result relative to the base value) • (1 – 0.8 (coefficient of redistribution of the increase in financial result between employees and managers of enterprises) • 0.8 (adjustment of the income tax rate, 20%, see formula (2)). Similarly, for the other rows of column 12 of Table 3 and column 3 of Table 4. For the 51st variant of the simulation, the growth of the development fund amounted to 48,635.61 rubles per employee (see the last row of column 3 of Table 4), which is more than the basic option development fund [(48,635.61 rubles : 13,904.10 rubles) • 100% = 350%] by 350%.
In column 4 of Table 4 the average monthly contributions to the development fund are given, determined by adding an increase in contributions to the development fund to the base amount of the financial result (see formula (2)). So, for the second row of column 4 of Table 4 the value of 14,335.28 rubles = 13,904.10 rubles (see the first row, column 4 of Table 4) + 431.18 rubles (see the second row, column 3 of Table 4). Similarly, for the remaining rows of column 4 of Table 4. In column 5 of Table 4 shows the size of the deduction rate in the PFR, which are determined by the formula (11) of the economic and mathematical model (1)-(16) and include the effect of wage growth and VAT. The VAT rate is 20%, the value is shown in column 11 of Table 4. The article [95] shows that pension funding is carried out from two sources: deductions from the wages of employees (22%) and the federal budget (for 2023 – 4,822.23 rubles on average per pensioner). It was emphasized above that wage growth increases VAT and pension contributions and is not beneficial to the labor collective and the owner.
This article proposes a mechanism of state regulation that encourages enterprises to increase wages, which consists in reducing pension contributions and deductions to the FCMIF depending on wage growth, but at the same time does not allow a reduction in the basic amount of deductions for VAT, pension provision, income tax, income tax and deductions to the FCMIF.
According to the second term of the formula (5) of the economic and mathematical model (1)-(16) for the basic (first variant, Table 4) the value of VAT is equal 17,965.78 rubles = (140,445.43 rubles (the average monthly revenue of enterprises, see the first row, column 3 of Table 3) – 50,616.53 rubles (conditionally variable costs, see the first row, column 8 of Table 3)) · 0.20 (VAT rate). Further, according to the first term of formula (5), deductions to the PFR are calculated as the product of wages at the rate of deductions to the PFR (63,060 rubles · 0.22 = 13,873.20 rubles). Total deductions, according to formula (5), will be 17,965.78 + 13,873.20 rubles = 31,838.98 rubles (first row, column 14 of Table 4). On the example of the second row of column 14 of Table 4 we will show a detailed methodology for calculating the rate of monthly deductions to the PFR and VAT, taking into account the reduction in the rate of deductions to the PFR (column 5 of Table 4):
Step 1. We determine the amount of monthly deductions to the PFR and VAT (formula (5) of the economic and mathematical model (1)-(16)). To do this, we will calculate deductions to the PFR and VAT at the base rate of deductions to the PFR (22.0%). And in the future, we will reduce the deduction rate in proportion to the increased amount of deductions so that in row 2, column 14 of Table 4 get an irreducible amount 31,838.98 rubles, i.e. as in the basic version of the simulation.
Step 2. We calculate the amount of deductions to the PFR at a rate of 22.0% (see the first term of formula (5)): 67,108 rubles (the average monthly nominal accrued salary, taking into account the progressive labor incentive system, see row 2, column 13 of Table 3) • 0.22 = 14,763.76 rubles.
Step 3. Calculate the amount of VAT deductions. According to the second term formula (5) the amount of VAT deductions is equal to (144,658.80 rubles (the average monthly revenue of enterprises, see the second row, column 3 of Table 3) – 52,135.03 rubles (conditionally variable costs of enterprises in the sale of products, services and works, see the second row, column 8 of Table 3)) • 0.2 (VAT deduction rate) = 18,504.75 rubles.
Step 4. According to formula (5), to the value obtained in step 3 of the algorithm, we add the amount of deductions to the PFR from wages at a rate of 22.0%, we have 18,504.75 rubles + 14,763.76 rubles = 33,268.51 rubles.
Step 5. To calculate the rates of deductions to the PFR, the condition is accepted that the amount of monthly deductions to the PFR and VAT must be at least the amount of these deductions in the basic version of the simulation. Thus, the rate of deductions to the PFR can be reduced with an increased salary level so that deductions to the PFR and VAT amount to 31,838.98 rubles (see row 1, column 14 of Table 4). Then, according to the formula (5) of the economic and mathematical model (1)-(16) the amount of deductions to the PFR it should be 31,838.98 rubles – 18,504.75 rubles (total VAT deductions according to step 3 of the algorithm) = 13,334.23 rubles. In other words, the product of increased wages (67,108 rubles for the second row of column 13 of Table 3) the rate of deductions to the PFR should bring at least 13,334.23 rubles, hence we get the rate of deductions to the PFR in the amount of 13,334.23 rubles : 67,108 rubles • 100% = 19.87%, which is indicated in the second row of column 5 of Table 4. Similarly, for all other rows of column 19 of Table 3.
In other words, with this approach, PFR and the federal budget receive an irreducible amount of 31,838.98 rubles per month from each employee, and the company’s deductions to the PFR for modeling options are reduced in accordance with formulas (11)-(13) from 22.00% in the basic version to 0.00% in the 21st version of modeling, which corresponds to the 2043st year (see line 21, column 5 of Table 4). Further, the rate of deductions to the PFR remains unchanged and equal to 0.00% (see lines 21-51, column 5 of Table 4). To calculate the rates of deductions to the PFR, the condition of not reducing the amount of monthly deductions due to VAT and deductions to the PFR (formula (5) of the model) was also taken into account, at least the amounts necessary to accumulate funds for retirement for the period of survival (see Table 3-6 [95]), as can be seen from the analysis of the data presented in column 14 of Table 4. Thus, for column 5 of Table 4 the reduction in the rates of deductions to the PFR occurs due to wage growth and the redistribution of VAT funds from the increased amount of wages of working citizens and VAT from the increased volume of manufactured and sold products, goods, works and services to personalized pension accounts of citizens in banks (see formulas (11)-(13)).
Despite the reduction in the rate of deductions to the PFR, the financing of pension provision is not reduced, since it is fully compensated by the increase in VAT deductions received by the federal budget and directed to personalized pension accounts of employees in banks.
Let’s look at this process in more detail. In column 13 of Table 4 shows an increase in deductions from VAT in the PFR, compensating for a decrease in the rate of deductions from wages in the PFR (column 5 of Table 4). In the second version of the simulation (2024), deductions from VAT in the PFR will amount to 538.97 rubles (row 2, column 13), in the tenth version of the simulation 5,475.49 rubles, in 20 option (2042) 13,537.32 rubles (row 20, column 13 of Table 4). In all these variants (from 1 to 20), deductions to the PFR and VAT are constant (31,838.98 rubles, column 14) and correspond to the basic variant. But already in 21 variants (2043) with the rate of deductions to the PFR equal to 0 (row 21, column 5 of Table 4) deductions to the PFR and VAT begin to increase 32,448.20 (line 21, column 14 of Table 4) and to 51 variants in accordance with formula 5 of the economic and mathematical model (1)-(16) amount to 78,760.29 rubles, exceeding the basic modeling variant in (78,760.29 : 31,838.98 = 2.47) 2.47 times.
It should be emphasized that Tables 3 and 4 is suitable only for citizens who started working in 2023. For those who have already worked, the table is shifted a year ago. That is, for those who have already worked for 1 year, the calculation is carried out by 2023 and zero deductions to the PFR will begin from 2044. For those who have been working for 5 years before the implementation of social financing technologies, zero deductions will begin from 2047 and so on.
Thus, the proposed mechanism contributes to the growth of wages of the labor collective, the growth of deductions for development and the growth of revenues to PFR and the federal budget.
Contributions to the FCMIF are formed as follows. According to the formula (6) for the basic (first variant, Table 4) the amount of income tax is determined (63,060 rubles • 0.13 (income tax rate, see column 9 of Table 4) = 8,197.80 rubles, income tax (13,904.10 (financial result, see column 12 of Table 4) · 0.20 (income tax rate, see column 10 of Table 4) = 2,780.82 rubles) and deductions to the FCMIF (63,060 rubles · 0.051 = 3,216.06 rubles), which in total will be: 8,197.80 rubles + 2,780.82 rubles + 3,216.06 rubles = 14,194.68 rubles (first row, column 15 of Table 4).
In other words, with this approach, the territorial budget and the FCMIF receive an irreducible amount of 14,194.68 rubles per month from each employee, and the company’s deductions to the FCMIF for modeling options are reduced in accordance with formulas (8)-(10) from 5.10% in the basic version to 0.00% in the 6th version of modeling, which corresponds to the year 2028 (see row 6, column 7 of Table 4). Further, the rate of deductions to the FCMIF remains unchanged and equal to 0.00% (see rows 6-51, column 7 of Table 4). To calculate the rates of deductions to the FCMIF, the condition of not reducing the amount of monthly deductions due to income tax, income tax and deductions to the FCMIF (formula (6) of the model) at least the amount of monthly deductions in the basic version of the simulation was also taken into account, as can be seen from the analysis of the data presented in column 15 of Table 4. Thus, for column 7 of Table 4, the reduction in the rates of deductions to the FCMIF occurs due to wage growth and the redistribution of income tax funds from the increased amount of wages of working citizens and income tax from the increased volume of manufactured and sold products, goods, works and services to personalized medical savings accounts of citizens in banks.
It should be emphasized that despite the reduction in the rate of deductions to the FCMIF, the financing of medical care is not reduced, since it is fully compensated by the increase in income tax and income tax deductions received by the territorial budget and directed to personalized medical savings accounts of working citizens in banks.
Table 5: The Economic Effect
| Line number | Year | The growth index of the revenue of the enterprise | Revenue of enterprises per employee, rubles | Wage growth index | Salary + deductions from wages, rubles | Annual wage growth, thousand rubles | Average annual contributions to the development fund, thousand rubles | The rate of deductions to the PFR, | The rate of deductions to the FCMIF |
| 1 | 2 | 3 | 4 | 5 | 6 | 7 | 8 | 9 | 10 |
| 0 | 2023 | 1.00 | 140,445.43 | 1.000 | 63,060 | 62,564,096,160 | 13,794,756,169 | 22.00% | 5.10% |
| 1 | 2024 | 1.03 | 144,658.80 | 1.064 | 67,108 | 66,579,958,692 | 14,222,544,098 | 19.87% | 3.88% |
| 2 | 2025 | 1.06 | 148,998,56 | 1.130 | 71,277 | 70,716,297,100 | 14,663,165,666 | 17.93% | 2.77% |
| 3 | 2026 | 1.09 | 153,468.52 | 1.198 | 75,571 | 74,976,725,661 | 15,117,005,880 | 16.15% | 1.75% |
| 4 | 2027 | 1.12 | 158,072.57 | 1.269 | 79,994 | 79,364,967,078 | 15,584,461,301 | 14.52% | 0.82% |
| 5 | 2028 | 1.15 | 162,814.75 | 1.341 | 84,550 | 83,884,855,738 | 16,065,940,384 | 13.02% | 0.00% |
And the total deductions due to income tax, income tax and deductions to the FCMIF (column 15 of Table 4, formula (6) of the economic and mathematical model (1)-(16)), despite the reduction in the rate of deductions to the FCMIF, increase from 14,194.68 rubles (in the basic version and variants 2 to 5), starting from option 6 (14,230.13 rubles) to 80,059.47 rubles in the 51st version of the simulation (5.64 times).
Thus, the proposed mechanism contributes to the growth of wages of the labor collective, the growth of deductions for development and the growth of revenues to FCMIF.
It is worth noting that the total deductions due to income tax, income tax, VAT, deductions to the FCMIF and the PFR (see formula (7)) increase from 46,033.66 rubles in the basic version of the simulation to 158,819.76 rubles in the 51st version of the simulation, i.e. 158,819.76 rubles : 46,033.66 rubles = 3.45 times (see column 16 of Table 4).
The rate of deductions to the FCMIF becomes zero already for the salary of a working citizen of Russia in the amount of 84,550 rubles, which is 34.08% higher than the average salary in the country as of November 2022 (84,550 rubles : 63,060 rubles = 1,341), as can be seen by comparing the data presented in line 6, columns 13 of Table 3 and column 7 of Table 4.
4. Discussion
The use of a progressive labor incentive system and the reduction of deductions to the PFR and the FCMIF with a corresponding increase in revenue from VAT, income tax and profit tax is beneficial to working citizens, business owners and the state. The economic effect for working citizens, owners of enterprises and the state from an annual increase in GDP (revenue of enterprises) by 3.0% over the first five years of the introduction of social financing technology is presented in Table 5.
Column 1 of Table 5 shows the year number, and column 2 of Table 5 shows the year. The first row (year zero) of Table 5 corresponds to the basic modeling variant (2023), i.e. row 1 of Tables 3 and 4. It is assumed that the annual revenue of enterprises will increase annually for 5 years by 3.0% from the baseline (row 1 of Tables 3 and 4). The data presented in columns 2-6, 9 and 10 are taken from similar columns of Tables 3 and 4. Annual wage growth (62,564,096,160 thousand rubles, see the first row, column 7 of Table 3) calculated as the product of wages (63,060 rubles, see row 1, column 13 of Table 3), by 12 (the number of months in a year) and by the population of working age according to Rosstat (82,678 thousand people according to Rosstat). With an increase in the revenue of enterprises by 3.0%, wage growth is 6.4% (see the first year, second row, column 5 of Table 5). With an increase in revenue by 3.0% per year for five years, wage growth per employee is 34.1% (see the last row, column 5 of Table 5), and the cumulative annual wage growth for all workers in Russia is 83,884,855,738 thousand rubles (see the last row, column 7 of Table 5). Thus, the wage increase is almost 20 trillion rubles.
Average annual contributions to the development fund (column 8 of Table 5) are determined by multiplying the amount of contributions to the development fund (column 4 of Table 4) by 12 (the number of months in a year) and by
82,678 thousand people (the population of working age). So, for the basic variant (year zero, the first row of column 8 of Table 5) the value of 13,794,756,169 thousand rubles = 13,904.10 rubles • 12 • 82,678 thousand people. For the second row, column 8 of Table 5 value 14,222,544,098 thousand rubles = 14,335.28 rubles • 12 • 82,678 thousand people. For the owners of enterprises, the use of social technologies developed in this article for financing enterprises leads to an increase in the size of average monthly contributions to the development fund to 16,193.28 rubles (see the sixth row, column 4 of Table 4) and this is only from one employee at the enterprise. There are 82,678 thousand citizens of working age in Russia. Thus, with an increase in the revenue of enterprises by 15%, the average annual contributions to the development fund using social technologies for financing enterprises are equal to 16,193.28 rubles • 12 • 82,678 thousand people = 16,065,940,384 thousand rubles (see the last row, column 8 of Table 5), the growth is 16,065,940,384 thousand rubles : 13,794,756,169 thousand rubles = 1.16 times, i.e. average annual contributions to the development fund increased by 16% compared to the base variant, the zero year.
An important result of the use of social financial technologies is the reduction of the deduction rate in the PFR for 5 years to 13.02% and in the FCMIF to 0 for workers with average wages who started working in 2023 (columns 9 and 10 of Table 5), which allows owners to significantly reduce social contributions and, accordingly, reduce the cost of all manufactured in Russia, goods, works and services.
5. Conclusion
The proposed technology of financing enterprises and the Russian economy, harmoniously combining the interests of working citizens, owners and the state, makes it possible:
- At quite achievable rates of GDP growth (enterprise revenue) by 3% per year, ensure a 34% increase in wages of working citizens over 5 years (see the last row, column 5 of Table 5), which will practically end poverty. Under the current funding system, this has not been done in 30 years.
- To ensure in four years the level of pension provision for current and future pensioners in the amount of 40% of wages; in 8 years – 60% of wages; in 10 years – 80% of wages. Under the current funding system, this has also not been done in 30 years.
- To increase contributions to the development fund for 5 years by 16% while reducing social contributions (PFR and FCMIF by 14.08%), which, first of all, the owners of enterprises are interested in, since this ensures the growth of their incomes, a significant reduction in cost and the possibility of constant modernization and updating of technological equipment and the release of new competitive products. In other words, if the owner motivates employees by increasing wages to increase sales volumes, then funds for development will grow at a higher rate than revenue. If the owner takes all the profits for himself, as is currently being done at many enterprises, then he will not be able to increase the volume of sales without motivation due to wage growth of working citizens, and, consequently, there will be much less funds for development. Thus, the motivation of employees by increasing wages, and owners by reducing social contributions is extremely beneficial for the owner. It is also important that wage growth, rigidly linked to an increase in product sales, stimulates the entire workforce to develop the enterprise. In other words, not only the owner and senior management, but the entire workforce becomes interested in the development of their enterprise.
- First, to stabilize, and starting from 2028, to increase deductions to the PFR and the FCMIF and income tax, income tax and VAT receipts and bring this growth to 30% by 2043, which will allow the state to solve many social problems. Reduce deductions to the PFR and FCMIF by 14.08% by 2028, which will significantly reduce the cost of products, services and works of all enterprises in Russia.
- The wage growth provided by the proposed social financial technologies contributes to the growth of the purchasing power of citizens of the relevant region (stimulates demand), and this, in turn, allows enterprises to increase products sales, which together ensures their development and subsequent wage growth of workers.
- At the beginning of this article, it was shown that in social relations, the main thing is not to distribute, but to create, and that all goods, works and services are produced in the process of labor at enterprises. Therefore, state (public) funds should, first of all, perform the function of enterprise development, and only then will the incomes of working citizens grow and there will be funds for social support. The reduction in the rate of deductions to the PFR proposed in this article at wages above a certain level is, as shown in this article, an effective tool to support the development of enterprises. Why drive money up in the form of taxes and social contributions, and then bring it to enterprises and citizens, creating the ground for corruption along the way, when they can immediately be sent to PAPA and medical bills and to enterprises in the form of a reduction in the rate of deductions to the PFR and FCMIF.
The developed optimization model (1)-(16) allows:
- To determine the optimal ratios of the main economic indicators of the company’s division, such as revenue, the price of products, goods, works, services, discounts on them, which are provided to increase demand for the company’s products, cost and profit, as well as to provide a progressive system of material incentives for employees involved in the business processes of the enterprise, in depending on the growth or decline of the specified economic indicators of the unit.
- To create the necessary economic mechanisms for moral and material encouragement of employees of the enterprise to increase the quality and effectiveness of their work, to involve them in the process of managing the activities of the enterprise, to create incentives for the formation of responsibility for the results of work in the workplace.
- To form long-term work plans of divisions and the enterprise as a whole, to identify deviations in the work of divisions in order to be able to correct them in a timely manner and provide employees with a clear and understandable information base for self-improvement, self-development, formation of independence and responsibility for decisions made.
- Calculate the size of consumption funds and accumulation funds. Determine, depending on the results of the work, the amount of material remuneration and the amount of deductions for the development of the enterprise, from which sources can be formed in the future for updating the material and technical base of the division, improving the skills of personnel, increasing the capacity of the division of the enterprise and (or) the equipment of the enterprise, the purchase of new technological and auxiliary equipment and necessary consumables for it, which will further contribute to the growth of the volume of manufactured and sold products of the enterprise, goods, works, services, reducing their cost and, ultimately, increasing the profit of the enterprise.
- To create additional sources of formation and strengthening of the financial system of Russia, since, as mentioned above, working citizens are the basis of the financial system of Russia. This means that the stability of the entire financial system depends on the organized and well-motivated work of working citizens, and the developed economic and mathematical model is a tool for managing the work of employees, increasing their material and moral remuneration depending on the results of work. At the same time, a distinctive feature of the developed staff motivation system is the dependence of the percentage of deductions from income for stimulating the work of employees on the amount of this income, which makes it possible to use a progressive scale of material incentives.
The developed economic and mathematical model and the system of personnel motivation, which contributes to the growth of the company’s revenue, as well as the system of progressive material and moral incentives for employees is a very important source of their development for enterprises.
An essential factor in the proposed system of material and moral incentives for personnel is their direct participation in the decision-making process, together with managers and owners of enterprises, on the acquisition of technological and auxiliary equipment that improves the quality of products, goods, works, services and the throughput capacity of the enterprise division and (or) equipment from the funds accumulated in each division for its development. Such participation morally stimulates each employee of the enterprise to continuously improve their professional qualifications, increases the prestige and demand for their work and at the same time contributes to the development of this division and the enterprise as a whole.
The developed economic and mathematical model of material incentives for employees, consistent with the growth of the company’s revenue, allows you to increase deductions for material incentives for employees, as well as deductions for the development of the enterprise. The indisputable practical significance of the model is the functional scientifically based relationship between the structure of the cost of manufactured and sold products, goods, works, services, financial incentives for employees involved directly in the business processes of the enterprise, the amount of deductions to the development fund and revenue, which allows the model to be used for the analysis and development of optimal long-term work plans of divisions and the enterprise as a whole.
Progressive financial incentives lead to an increase in deductions for the development of the enterprise. These funds, allocated for the purchase of advanced technological and auxiliary equipment and staff training, significantly improve the quality of the company’s products and contribute to the influx of new customers.
The economic and mathematical model presented in the scientific study is a development plan for the division and the enterprise as a whole. It models how, depending on revenue growth, the profitability and profit of the division’s work increases, the cost and prices of the company’s products decrease, the material remuneration of personnel and deductions for the development of the division and the enterprise as a whole increase. Social financial technologies for the development of enterprises allows employees to participate in management, coordinating with management their needs for the purchase of technological and auxiliary equipment, based on the amount of financial resources transferred by each division to the development fund. The proposed mechanism of material and moral incentives contributes to the fact that not only the management and owners of the enterprise and their deputies think about the development of the enterprise, but the entire workforce is interested in increasing professional growth, prestige and demand for their work, which contributes to a significant increase in the quality and availability of the enterprise’s products for citizens of the state.
Conclusion, recommendations and direction of future research. The economic and mathematical model of the integrated system of social financing of enterprises and the country’s economy developed by the authors can be used to improve the accuracy, efficiency and validity of management decisions in the interests of enterprise development, increase the profitability of its activities, increase employee salaries and contributions to the development fund.
The results of the development of the scientific and methodological apparatus and the implementation of practical tools of this study allow us to conclude that the goal of the study has been achieved. The completed scientific work provides management decision makers with effective tools for social financing of enterprises and the country’s economy. The directions of further research on the problems of the article are: the introduction of a progressive system of stimulating the work of employees in other fields of activity, for example, the provision of educational services to motivate highly effective work of scientific and pedagogical workers, improving their qualifications and professional level; expansion of the technology of setting and solving the problem of nonlinear programming for prospective investors and the search for optimal sources of financial resources from the point of view of the weighted average price for the implementation of investments in the development of enterprises and the economy of the country; adaptation of the economic and mathematical model developed in the article at enterprises of all sectors of the economy; the inclusion of the developed economic and mathematical tools into a unified information and analytical system for managing the financial flows of the enterprise, its interaction with widely used application software products and others.
Conflict of Interest
The authors declare no conflict of interest.
- A. Prskawetz, G. Feichtinger, M. Luptacik, A Milik, “Endogenous growth of population and income depending on resource and knowledge,” European Journal of Population, 14(4), 305-331, 1999, doi: 10.1007/BF02863319.
- A. Bellou, B. Kaymak, “The cyclical of job quality and real wage grow,” American Economic Rewiew Insigths, 3(1), 83-96, 2021, doi: 10.1257/aeri.20190553.
- Y. Avraamova, “The risks of reduced welfare of the population: stratification analysis,” Social Sciences, 48(3), 37-50, 2017, doi: 10.21557/SSC.49373409.
- A.R. Cardoso, “Long-term impact of minimum wages on workers’ careers: evidence from two decades of longitudinal linked employer–employee data,” The Scandinavian Journal of Economics, 121(4), 1337-1380, 2019, doi: 10.1111/sjoe.12327.
- C.C. Krolage, A. Peichl, “Long-run trends in top income shares: the role of income and population growth,” The Journal of Economic Inequality, 20, 97-118, 2022, doi: 10.1007/s10888-021-09520-8.
- C.C. Chao, M.S. Ee, X. Nguyen, E.S.H. Yu, “Minimum wage, firm dynamics, and wage inequality: theory and evidence,” International Journal of Economic Theory, 18(3), 2021, doi: 10.1111/ijet.12307.
- Y.Y. Finogenova, “Analysis of new financing opportunities for Russian pension insurance system,” European Journal of Economics and Management Sciences, 1, 47-53, 2017, doi: 10.20534/EJEMS-17-1-47-52.
- N. Gavkalova, I. Kolupaieva, M. Barka Zine, “Analysis of the efficiency of levers in the context of implementation of the state regulatory policy,” Eкономiчний часопис-xxi, 165(5-6), 41-46, 2017, doi: 10.21003/ea.V165-09.
- J. Barry, “Real wage growth in the U.S. health workforce and the narrowing of the gender pay gap,” Human Resources for Health, 19(1), 2021, doi:10.1186/s12960-021-00647-3.
- J. Adda, C. Dustmann, “Sources of wage growth,” Journal of Political Economy, 131(2), 2023, doi: 10.1086/721657.
- E.V. Kabashova, “Statistical methods in the analysis factors of welfare of the population,” Modern European Researches, 1, 27-34, 2017.
- J. Končar, R.M. Marić, S. Yučenović, G. Yukmirović, “Employee welfare in the western balkanretail sector: how to improve it through socio-organizational variables,” Revija za Socijalnu Politiku, 27(2), 151-170, 2020, doi: 10.15838/esc.2022.1.79.6.
- L. Malcoci, V. Mocanu, “The middle class in the republic of Moldova: determinant factors of formation,” Economie si Sociologie: Revista Teoretico-stiintifica, 1-2, 103-111, 2017.
- L. Pelinescu, M. Iordan, M.N. Chilian, “Digitization and population welfare in the new EU member states,” Romanian Journal of Economic Forecasting, 24(4), 59-75, 2021.
- E. Pi, Y. Ge, J. Yin, “The impacts of rural property rights on urban unemployment, wage inequality, and welfare in developing countries,” Journal of Economic Analysis & Policy, 17(1), 2015-2025, 2017, doi: 10.1515/bejeap-2015-0225.
- J. Litynski, “Living in sprawling areas: a cost-benefit analysis in Poland,” Journal of Housing and the Built Environment, 2022, doi:10.1007/s10901-022-09986-6.
- N. Rastvortseva, I.V. Manaeva, “Modern development of small and medium-sized cities: trends and drivers,” Economic and Social Changes: Facts, Trends, Forecast, 15(1), 110-127, 2022, doi: 10.15838/esc.2022.1.79.6.
- N. Semenova, E.I. Larionova, O.G. Karpovich, S.V. Shkodinsky, F.M. Ouroumova, “Social integration as a factor of economic growth: experience and perspectives of developing countries,” International Journal of Sociology and Social Policy, 2020, doi: 10.1108/IJSSP-03-2020-0083.
- S.P. Singh, “The 4 quadrants of monthly household budgets,” Research Trends in Multidisciplinary Subjects, 1 264, 264-271, 2022.
- Sofilda, R. Hamzah, M. Zilal Hamzah, “The effect analysis of minimum regional wages and macroeconomic on poverty level in Indonesia period 2010-2015,” Oida International Journal of Sustainable Development, 11(10), 11-24, 2018.
- Brunow, S. Losch, O. Okhrin, “Labor market tightness and individual wage growth: evidence from Germany,” Journal for Labour Market Research, 56(1), 2022.
- Synyayeva, A. Yarchuk, D. Verba, I. Verkhohod, D. Aleksandrov, “Resourses of educational and healthcare industries and population welfare: comparative analysis in post-socialist and OECD countries,” WSEAS Transactions on Business and Economics, 18, 531-542, 2021, doi: 10.37394/23207.2021.18.54.
- Ulugkhan, “Employment of the population on the basis of development and regulation of the labor market, demographic factors and welfare economic development of the region,” Internauka, 182(6-2), 66-67, 2021.
- Lu, X. Wu, R. Xu, “Why low unemployment rate in the United States has not delivered meaningful wage growth,” Highlights in Business, Economics and Management, 2, 2022, doi: 10.54097/hbem.v2i.2386.
- V. Sokolov, E.V. Kostyrin, A.B. Balantsev, “Social technologies of enterprise financing,” Economics and Management: Problems, Solutions, 3(4), 13-27, 2021, doi: 10.36871 / ek.up.pr2021.04.03.002.
- V. Sokolov, E.V. Kostyrin, “Justification of expediency of transition of financing of domestic healthcare to medical savings accounts,” Economics and Management: Problems, Solutions, 4(8), 194-212, 2018.
- V. Sokolov, E.V. Kostyrin, ”Justification of the necessity and effectiveness of the introduction of medical savings accounts for all subjects of the Russian Federation and Russia as a whole,” Economics and Management: Problems, Solutions, 11(1), 52-65, 2018.
- P.B. Etges, V. Grenon, M. Lu et al., “Development of an enterprise risk inventory for healthcare,” BMC Health Serv Res, 18, 578, 2018, doi: 10.1186/s12913-018-3400-7.
- Horkoff, M.A. Jeusfeld, J. Ralyté et al., “Enterprise modeling for business agility,” Bus Inf Syst Eng, 60, 1-2, 2018, doi: 10.1007/s12599-017-0515-z.
- E. Vahlne, W.A. Bhatti, “Relationship development: a micro-foundation for the internationalization process of the multinational business enterprise,” Manag Int Rev, 59, 203–228, 2019, doi: 10.1007/s11575-018-0373-z.
- A. Adamenko, D.V. Petrov, V.V. Markelov, “Effective management of cash flows of an economic entity,” Bulletin of the Academy of Knowledge, 6(35), 14-18, 2019.
- B. Akhmedjanov, I.S. Musakhonzoda, “Financial performance management system as a factor of efficiency of a balanced financial management system,” Journal of Advanced Research in Dynamical and Control Systems, 5(12), 301-310, 2020, doi: 10.5373/JARDCS/V12I5/20201718
- Alnaimat, N. Rudyk, A. Al-Naimi, A. Panchenko, I. Turski, “The impact of international economic sanctions on the use of financial technologies,” WSEAS Transactions on Business and Economics, 20, 682-693, 2023, doi: 10.37394/23207.2023.20.63.
- N. Altunina, I.E. Khorolskaya, A.I. Smirnova, “Evaluation of the effectiveness of cash flow management of a commercial organization,” Bulletin of the Academy of Knowledge, 4(39), 41-46, 2020, doi: 10.24411/2304-6139-2020-10435.
- K. Azimov, “The development of financial markets and financial theory,” Theoretical & Applied Science, 8(112), 2409, 2022, doi: 10.15863/TAS.2022.08.112.3
- E. Basovsky, Financial management, Moscow, INFRA-M, 2019.
- U. Boboev, D.A. Gaibulloeva, “Baҳisobgirii moliyavӣ ҳamchun manbai ittilooti nizomi meneҷmenti moliyavӣ,” Bulletin of the Technological University of Tajikistan, 1(44), 125, 2021.
- Bolgar, V. Varenyk, Z. Pestovska, I. Miro, “Innovative information technologies in financial management,” Academic Review, 2, 98-110, 2022, doi: 10.32342/2074-5354-2022-2-57-8.
- L. Combes, P. Plane, T. Kinda, R. Ouedraogo, “Financial flows and economic growth in developing countries,” Economic Modelling, 83(c), 195-209, 2019, doi: 10.1016/j.econmod.2019.02.010.
- Aurora Ndelo, Y. Permatasari, I. Harymawan, N. Anridho, “Corporate tax avoidance and investment efficiency: evidence from the enforcement of tax amnesty in Indonesia,” Economies, 10(10):25, 1-23, 2022, doi:10.3390/economies10100251.
- Ali, “Investment projects portfolio analyses using fuzzy evaluation methods,” Advances in Intelligent Systems and Computing, 1306, 685-693, 2021, doi: 10.1007/978-3-030-64058-3_85.
- Amel, “Corporate sustainability disclosure and investment efficiency: the Saudi Arabian context,” Sustainability, 14(21):13984, 1-13, 2022, doi: 10.3390/su142113984.
- Costăngioară, “Introducing a new requirement in the assessment of the impact of companies on the environment, the multidimensional approach,” in 19th International Scientific Geoconference, 271-278, 2019, doi: 10.5593/sgem2019/4.1/S17.035.
- Vasilyeva, T. Kudryavtseva, D.V. Ovsyanko, “Evaluation of the effectiveness of investment in innovation in industry,” Innovation Project Management, 9, 13-18, 2019, doi:10.17513/vaael.693.
- A. Filina, Z.M. Umarova, “Investment risk: types and evaluation methods,” Era of Science, 20, 477-480, 2019, doi: 10.24411/2409-3203-2019-12099.
- Golaydo, I. Parshutina, G. Gudimenko, A. Lazarenko, N. Shelepina, “Evaluation, forecasting and management of the investment potential of the territory,” Journal of Applied Economic Sciences, 2(48):12, 618-635, 2017.
- V. Grenaderova, “Methodological approaches to the evaluation of investment efficiency taking into account environmental factors,” in IOP Conference Series Materials Science and Engineering, 753(8):082036, 1-5, 2020, doi: 10.1088/1757-899X/753/8/082036.
- J. Heung, M.O. Hyun, “Debt origin and investment efficiency from Korea,” International Journal of Financial Studies, 8(3):47, 1-27, 2020, doi: 10.3390/ijfs8030047.
- D. Ierkovska, M.Yu. Bugayko, Hryhorak, Yu. Zaloznova, N. Trushkina, S.I. Gritsenko, T.I. Dovgan, V.Z. Ninich, V.А. Kulik, V.Ye. Marchuk, O.M. Harmash, O. Karpun, N.M. Perederii, “Intellectualization of logistics and supply chain management,” Electronic Scientific and Practical Collection, 9, 2021, doi:10.46783/smart-scm/2021-9.
- Bian, Ya. Shan, G. Zhao, “Evaluation and analysis of environmental protection investment efficiency in China based on DEA model,” Research Square, 1-16, 2021, doi: 10.21203/rs.3.rs-277471/v1.
- Yang, S. Fahad, F. Yuan, “Evaluating the influence of financial investment in compulsory education on the health of Chinese adolescents: a novel approach,” BMC Public Health, 22(1):1725, 1-15, 2022, doi: 10.1186/s12889-022-14125-5.
- Kim, J. Koo, J. Kim, “Development of an investment efficiency evaluation model for waterworks maintenance through data envelopment analysis,” Desalination and Water Treatment, 73-72, 2018, doi: 10.5004/dwt.2018.21640.
- V. Korolkova, T.S. Novikova, “Approaches to the efficiency evaluation for the complex of interrelated investment projects,” World of Economics and Management, 18(3):66-80, 2018, doi: 10.25205/2542-0429-2018-18-3-66-80.
- Kovalenko, A. Rokochinskiy, P. Volk, V. Turcheniuk, N. Frolenkova, R. Tykhenko, “Evaluation of ecological and economic efficiency of investment in water management and land reclamation projects,” Journal of Water and Land Development, 1-3(48), 81-87, 2021, doi: 10.24425/jwld.2021.136149.
- Lijia, X. Guanglong, L. Keyao, H. Juhua, M. Wanzhen, W. Xuejie, Zh. Huiru, “Investment efficiency assessment of distribution network for the high proportion of renewable energy: a hybrid multiattribute decision-making method,” Mathematical Problems in Engineering, 2022, doi: 10.1155/2022/2373363.
- Wang, J. Liang, J. Liu, ”Research on investment efficiency evaluation of wind power projects under supply-side reform,” in IOP Conference Series Earth and Environmental Science, 508(1):012089, 1-5, 2022, doi: 10.1088/1755-1315/508/1/012089.
- Liu, H. Zhang, Y. Wu, Y. Dong, “Ranking range based approach to MADM under incomplete context and its application in venture investment evaluation,” Technological and Economic Development of Economy, 5(25), 877-899, 2019, doi: 10.3846/tede.2019.10296.
- Luchko, R. Ruska, G. Lew, I. Vovk, “Modelling the optimal size of investment portfolio in a non-state pension fund,” Journal of International Studies, 1(12), 239-252, 2019, doi: 10.14254/2071-8330.2019/12-1/16.
- K. Malhotra, A. Saran, D. John, H. White, N.D. Cruz, J. Eyers, E. Beveridge, N. Blöndal, “Studies of the effectiveness of transport sector interventions in low- and middle-income countries: an evidence and gap map,” Campbell Systematic Reviews, 4(17), e1203, 2021, doi: 10.1002/cl2.1203.
- Nourani, Q.L. Kweh, W.M. Lu, I. Gurrib, “Operational and investment efficiency of investment trust companies: do foreign firms outperform domestic firms?” Financial Innovation, 8(79), 2022, doi: 10.1186/s40854-022-00382-1.
- Obinna, C. Amarachi, L. Anthony, D. Ajibare, Oladayo, D. Oluleye, “Small and medium enterprises assessment of investment decisions and financial performance of small and medium enterprises in federal capital territory,” Nigeria, 40-49, 2022, doi: 10.46281/ijsmes.v5i1.1813.
- Qixiong, L. Zhenqiu, C. Yu, Z. Ying, “An investment efficiency evaluation model for distribution network with distributed renewable energy resources,” Frontiers in Energy Research, 10, 1-4, 2022, doi: 10.3389/fenrg.2022.931486.
- Trung Tran, Q. Dat Tran, “How does national culture affect corporate investment efficiency?” Global Business Review, 2022, doi: 10.1177/09721509221088898.
- Sumets, “Evaluation of the investments efficiency in the development of the key component of the supply chain,” Electronic Scientific and Practical Publication in Economic Sciences, 5, 43-61, 2021, doi: 10.46783/smart-scm/2021-5-4.
- T. Do, N.N.N. Tran, “An investment willingness assessment model for private sector in PPP transportation,” Public-Private Partnership Transportation Projects in Vietnam, 2019.
- Wang, “Application of cloud computing and information fusion technology in green investment evaluation system,” Journal of Sensors, 1-13, 2021, doi: 10.1155/2021/2292267.
- Wang, W. Chen, W.J. Lekse, “Investment selection and evaluation for china express delivery market,” International Journal of Industrial Engineering: Theory Applications and Practice, 2(28), 190-208, 2021.
- Hao, H. Gao, Z. Liu, “An evaluation study on investment efficiency: a predictive machine learning approach,” Complexity, 1-9, 2021, doi: 10.1155/2021/6658516.
- Tian, Y. Zhang, G. Qu, “The impact of digital economy on the efficiency of green financial investment in China’s provinces,” International Journal of Environmental Research and Public Health, 19(14):8884, 1-18, 2022, doi:10.3390/ijerph19148884.
- Xiong, L. Wang, “Factors and economic evaluation of transnational investment risks,” Discrete Dynamics in Nature and Society, 1030183, 2021, doi: 10.1155/2021/1030183.
- Kou, X. Chao, Y. Peng, F. Wang, “Network resilience in the financial sectors: advances, key elements, applications, and challenges for financial stability regulation,” Technological and Economic Development of Economy, 28(2), 531-558, 2022, doi:10.3846/tede.2022.16500.
- Lehoux, T.V. Morozova, E.G. Safonova, A.D. Balashova, M.V. Protasov, “Practical aspects in calculating of impairment of financial assets according to IFRS 9 Financial instruments,” in Proceedings of the 33RD International Business Information Management Association Conference, IBIMA 2019: Education Excellence and Innovation Management Through Vision 2020, 6624, 2019.
- Liu, A. Hendalianpour, “A branch cut/metaheuristic optimization of financial supply chain based on input-output network flows: investigating the Iranian orthopedic footwear,” Journal of Intelligent and Fuzzy Systems, 41(2), 2561, 2021, doi: 10.3233/JIFS-201068.
- S. Aliyu, H.L. Ozdeser, B.L. Çavuşoğlu, M.A.M. Usman, “Food security sustainability: a synthesis of the current concepts and empirical approaches for meeting SDGS,” Sustainability, 21(13), 2021, doi: 10.3390/su132111728.
- El Bilali, “Research on agro-food sustainability transitions: where are food security and nutrition?” Food Security, 11(3), 559-577, 2019, doi: 10.1007/s12571-019-00922-1.
- Enahoro, K.M. Rich, S.S. Staal, D. Mason-D’croz, M. Mul, T.P. Robinson, P. Thornton, “Supporting sustainable expansion of livestock production in south Asia and sub-saharan Africa: scenario analysis of investment options,” Global Food Security, 20, 114-121, 2019, doi: 10.1016/j.gfs.2019.01.001.
- Hall, “National food security through corporate globalization: Japanese strategies in the global grain trade since the 2007–8 food crisis,” Journal of Peasant Studies, 47(5), 993-1029, 2020, doi: 10.1080/03066150.2019.1615459.
- Li, X. Li, L. Sun, G. Cao, G. Fischer, S. Tramberend, “An estimation of the extent of cropland abandonment in mountainous regions of China,” Land Degradation and Development, 29(5), 1327-1342, 2018. doi: 10.1002/ldr.2924.
- Semin, A. Kibirov, U. Rassukhanov, “Problems and main mechanisms to increase investment attractiveness of agricultural production,” European Research Studies Journal, 21(2), 378-400, 2018, doi: 10.35808/ersj/1009.
- T. Shakulikova, A.S. Baidalinova, A.M. Uakhitzhanova, G.B. Baimuldina, E.B. Ikmatova, “Agriculture financing – a basic premise for ensuring food security in Kazakhstan,” Journal of Applied Economic Sciences, 13(1), 216-226, 2018.
- Svanidze, L. Götz, I. Djuric, T. Glauben, “Food security and the functioning of wheat markets in Eurasia: a comparative price transmission analysis for the countries of central Asia and the south Caucasus,” Food Security, 11(3), 733-752, 2019, doi: 10.1007/s12571-019-00933-y.
- V. Vaganova, N.E. Solovjeva, O.N. Polukhin, V.M. Zakharov, G.G. Zabnina, R.V. Lesovik, S.L. Lesovaya, M.E. Ageykina, “Analysis of supply chain in investment activity in the Russian agricultural complex,” International Journal of Supply Chain Management, 9(5), 1615-1622, 2020.
- Verma, B. Vishal, A. Kohli, P.P. Kumar, “Systems-based rice improvement approaches for sustainable food and nutritional security,” Plant Cell Reports, 40(11): 2021-2036, 2021, doi: 10.1007/s00299-021-02790-6.
- Wakjira, T. Negera, A. Zacepins, A. Kviesis, V. Komasilovs, S. Fiedler, S. Kirchner, O. Hensel, D. Purnomo, M. Nawawi, A. Paramita, O.F. Rachman, A. Pratama, N.A. Faizah, M. Lemma, S. Schaedlich, A. Zur, M. Sper, K. Proschek, K. Gratzer, R. Brodschneider, “Smart apiculture management services for developing countries-the case of SAMS project in Ethiopia and Indonesia,” Peerj. Computer Science, 7, e484, 2021, doi: 10.7717/PEERJ-CS.484.
- V. Sokolov, E.V. Kostyrin, “Medical savings accounts as a tool for increasing doctors’ salaries and motivating Russian citizens to high-performance work and a healthy lifestyle,” Economics and Management: Problems, Solutions, 7(2), 24-31, 2020, doi: 10.34684/ek.up.p.r.2020.07.02.004.
- V. Sokolov, E.V. Kostyrin, “Organization of the transition of citizens of the Sverdlovsk region to medical savings accounts,” Economics and Management: Problems, Solutions, 12(108):1, 39-60, 2020, doi: 10.36871/ek.up.p.r.2020.12.01.007.
- V. Sokolov, E.V. Kostyrin, “The economic effect of using medical savings accounts instead of the existing system of healthcare financing,” Economics and Management: Problems, Solutions, 2(110):1, 16-26, 2021, doi: 10.36871/ek.up.p.r.2021.02.01.003.
- V. Sokolov, E.V. Kostyrin, “The mechanism of financing health care on the basis of medical savings accounts,” Economics and Management: Problems, Solutions, 3(5), 64-85, 2019.
- V. Sokolov, E.V. Kostyrin, S.V. Lasunova, “Financial technologies for the development of enterprises and the economy of Russia,” Economics and Management: Problems, Solutions, 10(118):1, 91-106, 2021, doi: 10.36871/ek.up.p.r.2021.10.01.013.
- V. Sokolov, E.V. Kostyrin, P.A. Nevezhin, “Modeling of the insurance and accumulative parts of the old-age labor pension,” Economics and Management: Problems, Solutions, 9(1), 132-153, 2018.
- V. Sokolov, E.V. Kostyrin, K.V. Rudnev, “Social financial technologies for the development of enterprises and the economy of Russia,” Soft Measurements and Calculations, 9(46), 74-96, 2021, doi: 10.36871/2618-9976.2021.09.004.
- V. Sokolov, E.V. Kostyrin, “Social financial technologies for the development of large scale healthcare systems and the Russian economy,” in 2022 15th International Conference Management of Large-Scale System Development (MLSD), 1-5, 2022. doi: 10.1109/MLSD55143.2022.9934748.
- V. Sokolov, P.A. Nevezhin, “Breakthrough technologies of old-age labor pension financing,” Economics and Management: Problems, Solutions, 7(3), 4-9, 2018.
- V. Sokolov, “The main source of development of the financial system of Russia,” Economics and Management: Problems, Solutions, 9(2), 158-161, 2016.
- V. Sokolov, E.V. Kostyrin, “Breakthrough technologies of old-age labor pension financing,” Economics and Management: Problems, Solutions, 7(115):1, 63-80, 2021, doi: 10.36871/ek.up.p.r.2021.07.01.009.
- V. Kostyrin, “Progressive system of stimulating the work of doctors,” Economics and Entrepreneurship, 2(103), 1122-1131, 2019.
- Abbasov, “Improving cash flow management,” Economic Herald of the Donbas, 33-38, 2021, doi: 10.12958/1817-3772-2021-4(66)-33-38.
- Apsite, D. Belova, “Financial analysis as a cash flow management tool,” Interactive Science, 2019, doi: 10.21661/r-509061.
- Atakul, “Exploring the cash flow management strategies of Turkish construction companies,” Journal of Construction Engineering, Management & Innovation, 5, 2022, doi:10.31462/jcemi.2022.03168180.
- Chubka, I. Skoropad, “Features of cash flow management in public finance,” Odessa National University Herald. Economy, 25, 2020, doi: 10.32782/2304-0920/2-81-25.
- Chubka, R. Zhelizniak, “Cash flow management in banking,” International Humanitarian University Herald. Economics and Management, 2019, doi: 10.32841/2413-2675/2019-40-21.
- Dvořáková, J. Kronych, A. Malá, “Cash flow management as a tool for corporate processes optimization,” Smart Science, 6(1-7), 2018, doi: 10.1080/23080477.2018.1505370.
- Etim, E. Daferighe, E. Enang, M. Nyong, “Cash flow management and financial performance of selected listed companies in Nigeria,” Indo-Asian Journal of Finance and Accounting, 3, 27-46,2022, doi: 10.47509/IAJFA.v03i01.03.
- Imanbayeva, H. Kusainov, B. Zhakupova, A. Niyazbayeva, B. Bimbetova, “Ways to improve the company’s cash flow management,” Reports, 4, 177-185, 2020, doi: 10.32014/2020.2518-1483.107.
- Ketova, I. Rusyak, E. Kasatkina, E. Saburova, D. Vavilova, “Organizing the cash flow management in the construction industry in the Russian Federation,” in IOP Conference Series: Materials Science and Engineering, 862, 042035, 2020, doi: 10.1088/1757-899X/862/4/042035.
- Koopman, R. Cumberlege, “Cash flow management by contractors,” in IOP Conference Series: Earth and Environmental Science, 654, 012028, 2021, doi: 10.1088/1755-1315/654/1/012028.
- Korobova, M. Blum, “Application of digital technologies in cash flow management at a commercial enterprise,” Voprosy Sovremennoj Nauki i Praktiki, 062-070, 2021, doi: 10.17277/voprosy.2021.02.pp.062-070.
- Kucherenko, H. Anishchenko, “Accounting and analytical support of cash flow management of enterprises,” Efektyvna Ekonomika, 2020, doi: 10.32702/2307-2105-2022.2.12.
- Kudyrko, I. Kopchykova, “Methodological approaches to cash flow management at the enterprise,” European Journal of Economics and Management, 8, 17-22, 2022, doi: 10.46340/eujem.2022.8.3.3.
- Nanggala, “Free cash flows, management ownership, dividend policy, and debt policy,” Jurnal Ekonomi Akuntansi dan Manajemen, 19, 30, 2020, doi: 10.19184/jeam.v19i1.17544.
- Nangih, T. Ofor, O. Joshua, “Cash flow management and financial performance of quoted oil and gas firms in Nigeria,” Journal of Accounting and Financial Management, 6, 2020.
- Nashkerska, N. Patriki, “Instruments for cash flow management of construction enterprises,” Economic Analysis, 223-229, 2020, doi: 10.35774/econa2020.01.02.223.
- Oladimeji, O. Aina, “Cash flow management techniques practices of local firms in Nigeria,” International Journal of Construction Management, 21, 1-9, 2018, doi: 10.1080/15623599.2018.1541705.
- Ongpeng, K. Aviso, D. Foo, R. Tan, “Graphical pinch analysis approach to cash flow management in engineering project,” Chemical Engineering Transactions, 76, 493, 2019, doi: 10.3303/CET1976083.
- V. Oriekhova, O.Hr. Golovko, “Cash flow management strategy,” Economics and Law, 89-97, 2022, doi: 10.15407/econlaw.2022.01.089.
- Peng, Z. Ren, “Design and implementation of electronic commerce cash flow management system,” Agro Food Industry Hi-Tech, 28, 2535-2540, 2017.
- Phuong, N. Thuy, “Impact of cash flow management on shareholder value of listed real estate companies in Vietnam,” Vnu Journal of Economics and Business, 1, 2021, doi: 10.57110/jeb.v1i4.4584.
- Piontkevich, E. Shatkovskaya, “An organization’s cash flow management in digital economy,” in Proceedings of the Ecological-Socio-Economic Systems: Models of Competition and Cooperation (ESES 2019), 2020, doi: 10.2991/assehr.k.200113.099.
- T. Dinh, N.C. Phuc, “Foreign financial flows, human capital and economic growth in African developing countries,” International Journal of Finance and Economics, 27(5), 2020, doi: 10.1002/ijfe.2310.
- N. Dobryshina, “Socio-economic security: essence, evolution, factors,” Transport Business of Russia, 10, 5-7, 2011.
- V. Ekimova, I.P. Savelyeva, K.V. Kardapoltsev, Financial management, Moscow, Yurayt Publishing House, 2019.
- Explanatory note to the draft federal law “On compulsory medical insurance in the Russian Federation using medical accounts,” 2019, URL: http: // sokolov.expert.
- A. Fedorov, “Methodology for assessing the impact of the effect of financial leverage on the total cash flow of the company,” Innovations and Investments, 10, 60-62, 2021.
- M. Galimova, A.N. Kirpikov, “Perspective economic assessment of financial stability indicators organizations with the use of economic and mathematical modeling of cash flows,” Economic Bulletin of the Republic of Tatarstan, 1, 64-72, 2019.
- A. Ilyinykh, “The economic essence of the cash flow of the organization,” Young Scientist, 14, 103-105, 2019.
- JingJing, “Risk assessment method of agricultural management investment based on genetic neural network,” Security and Communication Networks, 1-10, 2022, doi: 10.1155/2022/2373363.
- Podgornaya, K. Romanov, “Actual issues of cash flow management in enterprises in Russia,” Gênero & Direito, 8, 2019, doi: 10.22478/ufpb.2179-7137.2019v8n6.49183.
- V. Kostyrin, “Economic and mathematical models of financial incentives for the personnel at medical organization departments,” International Journal of Pharmaceutical Research, 4(12), 1769-1780, 2020, doi: 10.31838/ijpr/2020.12.04.253.
- V. Kostyrin, “Economic and mathematical modeling of financial resource management in medical organizations,” Industrial Engineering and Management Systems, 3(19), 716-729, 2020, doi: 10.7232/iems.2020.19.3.716.
- V. Kemenov, Cash flow management, Moscow, UNITY-DANA, 2015.
- V. Ketova, D.D. Vavilova, “Optimization of financial flows in a building company using an escrow account in the Russian Federation,” in Recent Research in Control Engineering and Decision Making, 427-442, 2021, doi: 10.1007/978-3-030-65283-8_35.
- N. Kirpikov, T.A. Sibgatullin, “Simulation modeling of cash flows in the system of predictive analysis and financial management of an organization,” Scientific Review: Theory and Practice, 7(63):9, 1086-1100, 2019, doi: 10.35679/2226-0226-2019-9-7-1086-1100.
- E. Kisova, V.K. Zolotareva, “Cash flows as a factor in ensuring financial stability of an organization,” Notes of a Scientist, 8, 362, 2021.
- A. Magomedov, E.D. Ozdeadzhieva, “Features of managing financial flows of the enterprise,” Economics and Entrepreneurship, 3(140), 1038-1041, 2022, doi: 10.34925/EIP.2022.140.03.196.
- Mahdi, Z. Grzegorz, A. Arash, E.G. Fratemeh, “The impact of investment efficiency on firm value and moderating role of institutional ownership and board independence,” Journal of Risk and Financial Management, 15(4):170, 1-13, 2022, doi: 10.3390/jrfm15040170.
- B. Melikhov, “Methodological foundations of systematic economic and statistical modeling of financial flows,” Bulletin of the Tula branch of the Financial University, 1-1, 227-238, 2019.
- S. Morozkina, A.V. Rykalo “Analysis of the organization’s cash flows,” Natural Sciences and Humanities Research, 24(2), 55-59, 2019.
- A. Pirogova, V.S. Kirsanova, “Financial flow management,” Development Trends and Actual Problems of Assessment, Management and Regulatory Support of the Financial System of Russia, 2, 205, 2020.
- S. Plaskova, N.A. Prodanova, E.V. Prokofieva, “Methods of financial analysis of the organization’s cash flows and assessment of the effectiveness of cash flow management,” Financial Analysis: Theory and Practice, 106, 2021.
- Ramli, L. Yekini, “Cash flow management among micro-traders: responses to the COVID-19 pandemic,” Sustainability, 14, 10931, 2022, doi: 10.3390/su141710931.
- Rosemary, I. Abner, A. Jack, O. Fausat, E. Enoch, U. Samuel, “Cash flow management and industrial firms’ performance in Nigeria,” Universal Journal of Accounting and Finance, 9, 2021, doi: 10.13189/ujaf.2021.090416.
- Shash, A. Qarra, “Cash flow management of construction projects in Saudi Arabia,” Project Management Journal, 49(2):875697281878797, 2018, doi: 10.1177/8756972818787976.
- Sofyan, U. Ludigdo, A.D. Mulawarman, (2021). “The meaning of cash flow management for the non-bank housing developers,” International Journal of Research in Business and Social Science, (2147- 4478), 10, 195-203, doi: 10.20525/ijrbs.v10i4.1174.
- Sulla, D. Slepchenko, I. Kuzmicheva, E. Zaostrovskikh, “Financial logistics and its application in cash flow management”, 2021, doi: 10.2991/assehr.k.210322.206.
- Vodolazska, K. Petrenko, “Enterprise cash flows: management principles and methods,” Eastern Europe: Economy, Business and Management, 2019, doi: 10.32782/easterneurope.23-88.
- Voloshina-Sidey, I. Rud, O. Portnenko, “Cash flow management at the enterprise during COVID-19,” Market Infrastructure, 2021, doi: 10.32843/infrastruct54-33.
- S. Zaryvakhina, “Cash flow management of the corporation in the conditions of instability,” Scientific Review. Economic Sciences, 10-15, 2022, doi: 10.17513/sres.1102.
- D. Atmond, V. Vyatkin, Z. Salcic, K.I.K. Wang, “A service-oriented programming approach for dynamic distributed manufacturing systems,” IEEE Transactions on Industrial Informatics, 1(16), 151-160, 2020, doi: 10.1109/TII.2019.2919153.
- Dehgnani, Z. Montazeri, A. Ehsanifar, A.R. Seifi, M.J. Ebadi, O.M. Grechko, “Planning of energy carriers based on final energy consumption using dynamic programming and particle swarm optimization,” Електротехнiка i Eлектромеханiка, 5, 62-71, 2018, doi: 10.20998/2074-272X.2018.5.10.
- Di, A. Lamperski, “Newton’s method, Bellman recursion and differential dynamic programming for unconstrained nonlinear dynamic,” Dynamic Games and Applications, 413, 87-102, 2021, doi: 10.1007/s13235-021-00399-8.
- Doerr, A. Eremeev, F. Neumann, M. Theile, C. Thyssen, “Evolutionary algorithms and dynamic programming,” Theoretical Computer Science, 43(412), 6020-6035, 2011, doi: 10.1016/j.tcs.2011.07.024.
- I. Gomoyunov, “Dynamic programming principle and Hamilton-Jacobi-Bellman equations for fractional-order systems,” Siam Journal on Control and Optimization, 6(58), 3185-3211, 2020, doi: 10.1137/19M1279368.
- Justiz, B. Bychko, S. Soler, V. Frolov, O. Malafeyev, A. Vasileva, “Application of dynamic programming to minimize energy consumption in industrial dryers,” Bulletin de L’académie International Concorde, 2, 3-20, 2021.
- S. Karaseva, “Genetic programming algorithm for the dynamic systems identification,” Young People. Society. Modern Science, Technology and Innovation, 19, 299-301, 2020.
- Land, B. Vogel-Heuser, S. Cha, “Applying dynamic programming to test case scheduling for automated production systems,” Communication in Computer and Information Science, 1262, 3-20, 2020, doi: 10.1007/978-3-030-58167-1_1.
- Struchenkov, D.A. Karpov, “High-speed dynamic programming algorithms in applied problems of a special kind,” Mathematics and Statistics, 3(8), 339-346, 2020, doi: 10.13189/ms.2020.080313.
- Yamaganov, A. Agafonov, V. Myasnikov, “An improved map matching algorithm based on dynamic programming approach,” Lecture Notes in Business Information Processing, 413, 87-102, 2021, doi: 10.1007/978-3-030-71846-6_5.
- Zhu, G. Jia, “Dynamic programming and Hamilton-Jacobi-Bellman equations on time scales,” Complexity, 7683082, 2020, doi: 10.1155/2020/7683082.
- Butt, “A conceptual framework to support digital transformation in manufacturing using an integrated business process management approach,” Designs, 4(3), 1-39, 2020, doi: 10.3390/designs4030017.
- A. Krylyvetz, A.A. Krylyvetz, “Process approach in the quality management system,” Young People. Society. Modern Science, Technology and Innovation, 19, 201-203, 2020.
- Li, G. Fang, “Process-aware accounting information system based on business process management,” Wireless Communications and Mobile Computing, 2022, 7266164, 2022, doi: 10.1155/2022/7266164.
- Olshanskiy, “Development of methods of improvement of business process management,” Technology Audit and Production Reserves, 5(4), 20-25, 2018, doi: 10.15587/2312-8372.2018.146862.
- Saragiotis, “Business process management in the port sector: a literature review,” Maritime Bussiness Review, 4(1), 49-70, 2019, doi: 10.1108/MABR-10-2018-0042.
- G. Sboeva, Y.A. Klyueva, N.L. Burdaev, M.A. Zaharchenko(2019). “Development of methodical bases for business process management optimization in clinical trials,” Journal of Advanced Pharmacy Education and Research, 9(2), 137-142, 2019.
- Tabassam, O. Hassan, E. AL-Qahtnae, N. AL-Ahmary, “Question metrics and its application to process management and improvement,” National Journal on Engineering Applications, 7(2), 52-58, 2019, doi: 10.15866/irea.v7i2.17013.
- A. Taskymbayeva, A.A. Shaikh, R.A. Salimbayeva, “Application of business process management methods in higher education institutions,” Central Asian Economic Review, 3(144), 45-55, 2022, doi: 10.52821/2789-4401-2022-3-45-55.
- S. Voskovskaya, T.A. Karpova, P.P. Rostovtseva, N.V. Guseva, A.V. Shelygov, “Development of the learning process management in the context of digitization,” Revista Inclusiones, 7(S4-5), 240-249, 2020.
- Yehorchenkova, O. Yehorchenkov, “Modeling of project portfolio management process by cart algorithm,” Advances in Intelligent Systems and Computing, 1265, 353-363, 2021, doi: 10.1007/978-3-030-58124-4_34.
- Saha, K.D. Dutta, “Nexus of financial inclusion, competition, concentration and financial stability: Cross-country empirical evidence,” Competitiveness Review, 2020, doi: 10.1108/CR-12-2019-0136.
- Y. Shakatreh, M.M.A. Orabi, B.R.T. Shammout, “The role of financial vigilance in predicting possible financial distress among foreign banks,” Journal of Management Information and Decision Science, 24(5), 1-18, 2021.
- G. Spodareva, Ya.V. Sazhnikova, “Monitoring as a way of managing financial flows at the enterprise,” Bulletin of the Ural Institute of Economics, Management and Law, 2(59), 4, 2022.
- Suhadak, R.S. Mangesti, S.R. Handayani, “GCG, financial architecture on stock return, financial performance and corporate value,” International Journal of Productivity and Performance Management, 69(9), 1813, 2019, doi: 10.1108/IJPPM-09-2017-0224.
- B. Sungatullina, E.S. Golovchenko, “The economic essence of the company’s cash flows as an object of financial management,” Accounting in Budgetary and Non-profit Organizations, 1(505), 14, 2021.
- Yujing, Z. Qinli, W. Daolin, W. Shihai, “Mining investment risk assessment for nations along the belt and road initiative,” Land, 11(8):1287, 2022, doi: 10.3390/land11081287.
- Zhang, F. Li, “Financial resilience and financial reliability for systemic risk assessment of electricity markets with high-penetration renewables,” IEEE Transactions on Power Systems, 37(3), 2312-2321, 2022, doi: 10.1109/TPWRS.2021.3115499.
- F. Zhokabine, “Cash flows in the financial resources management system of the enterprise,” Bulletin of Lugansk State University named after Vladimir Dal, 1(43), 62-66, 2021.
No related articles were found.