System-Level Test Case Design for Field Reliability Alignment in Complex Products

Adv. Sci. Technol. Eng. Syst. J. 10(6), 55–64 (2025);
 DOI: 10.25046/aj100605
Achieving targeted reliability for complex products in real-world field environments remains a persistent challenge, even when laboratory validation suggests high performance. A significant reliability gap often emerges during the initial deployment phase, typically within the first one to five years where field failure rates can be up to twice those predicted in controlled settings. Compounding this issue is the limited correlation between failure modes observed in the field and those anticipated during lab testing, with studies indicating only 50–60% alignment. These discrepancies result in unforeseen operational costs, elevated warranty claims, and reduced customer satisfaction. This paper investigates the root causes of the disconnect between laboratory predictions and field performance, proposing a comprehensive framework to improve reliability demonstration and failure mode correlation. The framework introduces a closed-loop reliability correlation system that integrates diverse data sources and feedback mechanisms to achieve up to 95% alignment between lab and field failure modes. The proposed methodology builds upon traditional DFMEA practices by incorporating Function Block Diagrams (FBD), Interface Matrix (IM), Parameter (P-) Diagrams, and field failure trend analysis. It expands the scope of reliability assessment to include actual usage conditions, patterns, and stakeholder interactions shifting from an engineer-centric view to a holistic, user-centered approach. Internal component-level data remains consistent, but the enriched context enables deeper insights into real-world performance. By embedding these multidimensional analyses into system-level test case design, the framework ensures comprehensive coverage of critical variables, noise factors, and interaction effects. This results in more representative simulations, improved predictive accuracy, and early identification of latent failure modes. Ultimately, the proposed approach bridges the gap between laboratory and field environments, enhancing reliability metrics, and enabling proactive mitigation strategies that align with operational realities.
1. Introduction
Demonstrating the targeted reliability of highly complex products in real-world field environments remains a significant challenge, even when such reliability has been successfully validated under controlled laboratory conditions. A noticeable gap often emerges during the initial deployment phase, typically within the first one to five years where the actual field reliability consistently falls short of expectations. Empirical observations across various product categories reveal that failure rates in the field can be approximately twice as high as those predicted in laboratory settings. For instance, a product designed to achieve a 1% failure rate may exhibit a field failure rate ranging from 2% to 3% during early usage.
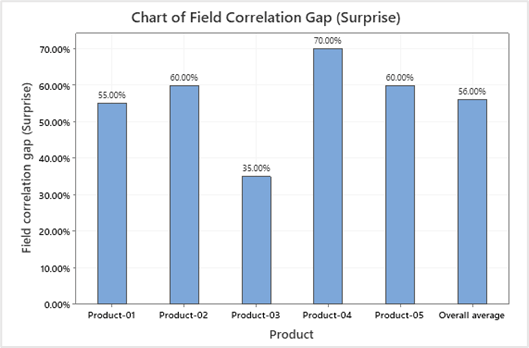
A second critical challenge lies in the correlation between failure modes observed in the field and those identified during laboratory testing. Studies indicate that this correlation typically ranges between 50% and 60%, implying that nearly half of the failures encountered in the field are previously unobserved or unanticipated. These unexpected failure modes contributed to increased operational costs, including higher warranty claims, spare parts inventory management, and diminished customer satisfaction. The field correlation gaps for various products are shown in Figure 1.
These findings collectively suggest that conventional laboratory testing methodologies are insufficient in capturing the full spectrum of failure mechanisms that manifest in real-world conditions. This paper investigates the underlying causes of this disconnect and proposes a comprehensive framework to enhance field reliability demonstration and improve failure mode correlation to a target of 95%.
The focus of this study is twofold: (1) to establish robust strategies for demonstrating reliability in field environments, and (2) to develop a closed-loop reliability correlation system. This system integrates diverse data inputs and feedback mechanisms to bridge the gap between laboratory predictions and field performance, thereby enabling more accurate reliability assessments and proactive mitigation strategies.
This methodology emphasizes system-level validation rather than component-level or subsystem-level testing, as those are prerequisite activities for comprehensive system verification. The focus is on evaluating end-to-end user interactions and real-world operational scenarios, rather than isolated component demonstrations or accelerated stress screening techniques such as HALT (Highly Accelerated Life Testing) or HASS (Highly Accelerated Stress Screening).
2. Approach and Methodology
2.1. Existing Approach
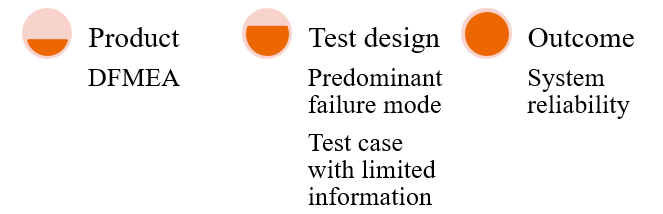
In most cases, test designers prioritize the engineering perspective to identify the dominant failure modes revealed through analytical methods, typically via Design Failure Mode and Effects Analysis (DFMEA). DFMEA systematically enumerates potential failure modes that a product may encounter throughout its lifecycle, along with associated severity and occurrence ratings. This information enables engineers to target specific failure modes during the test design phase.
This existing approach in Figure 2 is particularly effective for systems with minimal external interactions and limited interdependencies among subsystems.
A primary limitation of this methodology is its insufficient integration of existing empirical data, as well as its lack of consideration for noise factors and variable conditions encountered in real-world environments. Consequently, while the approach enables engineers to effectively demonstrate reliability within controlled laboratory settings, it falls short in accurately representing field-level performance and operational variability.
2.2. Proposed Approach
Field reliability is influenced by multiple interdependent factors, primarily supplier reliability, manufacturing process reliability, and design reliability. Among these, supplier and process-related issues typically manifest as infant mortality failures occurring within the first 0 to 2 years of field deployment. These early-life failures, although impactful, are generally not classified as reliability failures in the context of long-term product performance. Consequently, this study places greater emphasis on design reliability and its associated failure mechanisms at the system level.
Design reliability is traditionally assessed through a sequential process that begins with reliability analysis and culminates in reliability testing. The analysis phase encompasses several key activities: feasibility studies, component selection guided by design-for-reliability principles, risk assessment via Design Failure Mode and Effects Analysis (DFMEA), and reliability prediction using either Physics of Failure (PoF) models or handbook-based estimation techniques. These analytical methods primarily focus on design characterization and theoretical reliability estimation and are often insulated from the influence of real-world usage conditions and environmental interactions.
Reliability testing, on the other hand, is typically conducted at the component or sub-assembly level with the objective of validating system-level reliability. While this approach is effective for relatively simple systems, it becomes inadequate as system complexity increases. In such cases, component-level testing fails to capture the intricate interactions, noise factors, and variable conditions that influence system behavior over time. Therefore, system-level testing becomes essential not merely to validate performance, but to replicate the multifaceted conditions of the field environment and expose latent failure modes.
Designing effective system-level tests involves a multi-layered approach, beginning with sample selection and extending through detailed failure analysis. At the core of this process lies the test case, the fundamental unit of reliability testing. A test case is defined as a structured sequence of actions applied to the system under test, intended to simulate real-world operational scenarios and evaluate system behavior and reliability over time. The design of test cases is critical, as it serves as the primary mechanism for embedding field-representative conditions into laboratory testing environments.
Given these considerations, reliability testing particularly at the system level emerges as a focal point for improvement. A deeper examination reveals that the effectiveness of the entire testing framework hinges on the quality and relevance of the test cases employed. Enhancing test case design is thus pivotal to bridging the gap between laboratory predictions and field performance, and to achieving more accurate and comprehensive reliability assessments.
2.3. Methodology
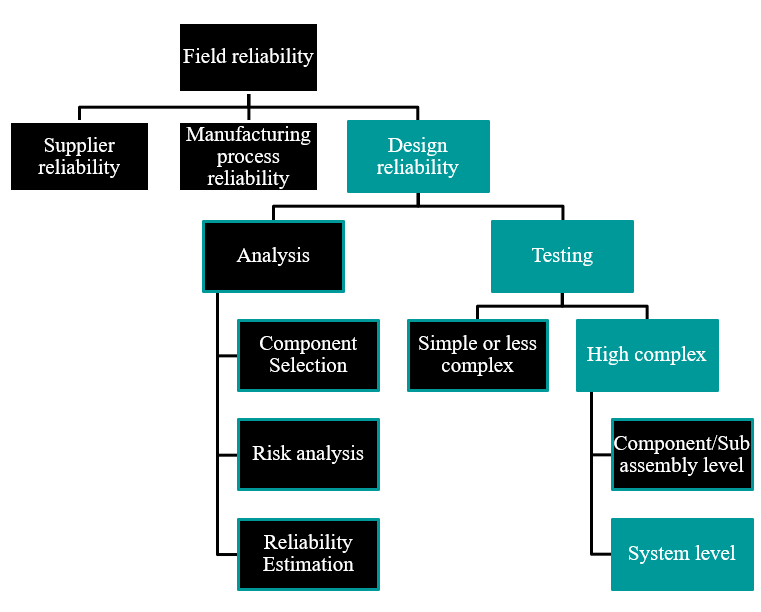
The flowchart in Figure 3 illustrates the foundational structure of field reliability by categorizing it into three primary domains: supplier reliability, manufacturing process reliability, and design reliability. While supplier and process reliability are typically associated with early-life failures which often occur within the first two years of product deployment, design reliability plays a more critical role in long-term performance. Design reliability is further divided into analysis and testing. The analysis phase includes component selection, risk analysis (such as DFMEA), and reliability estimation using models like Physics of Failure or handbook-based approaches. The testing phase is differentiated by system complexity: for simple systems, component and sub-assembly level testing may suffice, but for highly complex systems, system-level testing becomes essential. This level of testing aims to replicate real-world conditions by accounting for interactions, environmental noise, and variable factors that influence system behavior. At the heart of system-level testing is the test case, a structured sequence of actions designed to simulate field scenarios and evaluate reliability over time. The image underscores that effective test case design is pivotal for bridging the gap between laboratory predictions and actual field performance.
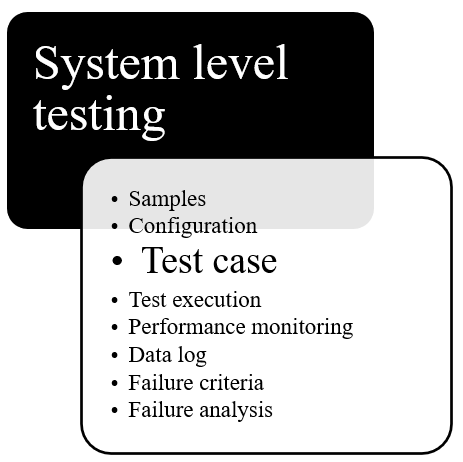
The overview of system level testing is shown in Figure 4. As highlighted in the figure, test case design is a critical and foundational element of system-level reliability testing. Its role in accurately simulating real-world field conditions makes it indispensable for capturing complex failure modes. The subsequent sections of this paper will explore test case design in greater detail, emphasizing its structure, implementation, and impact on improving reliability outcomes.
3. Test Case Design Inputs
Test case design is a structured process aimed at integrating all relevant inputs that can effectively simulate real-world failure modes observed in the field. These inputs are derived from multiple sources, including product reliability analysis, historical field performance data, internal study findings, and interaction parameters that influence system behavior under operational conditions. The overview of inputs for the test case design is shown in Figure 5.
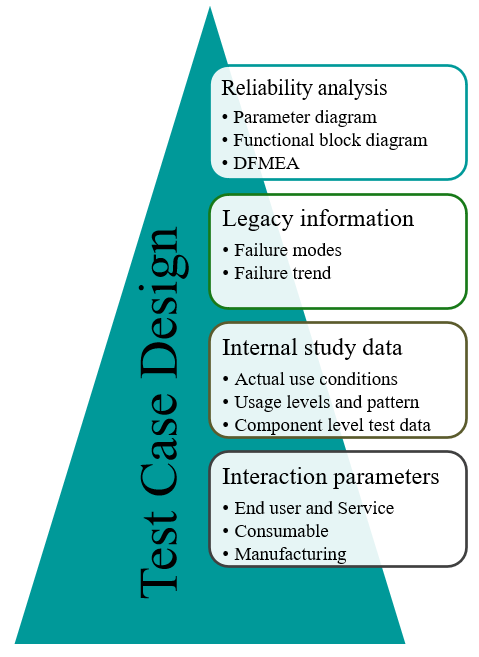
As shown in Figure 5, inputs include outputs from reliability analysis such as parameter diagrams, functional block diagrams, and Design Failure Mode and Effects Analysis (DFMEA) which help identify potential risks and failure mechanisms during the design phase. Legacy information, including historical failure modes and failure trends, provides valuable insights into recurring issues and long-term reliability challenges. Internal study data contributes further depth by capturing actual use conditions, usage levels and patterns, and component-level test results, all of which reflect how the product behaves under operational stress. Additionally, interaction parameters spanning end-user behavior, service environments, and manufacturing influences play a crucial role in shaping system performance and reliability outcomes.
By synthesizing these inputs, test case design becomes a powerful tool for replicating field conditions in laboratory settings, enabling the identification and mitigation of complex failure modes that might otherwise go undetected. More details on each input parameter will be discussed in the next section of the paper.
3.1. Reliability Analysis
3.1.1. Parameter (P-) Diagram
A major source of unexpected failures in the field stems from the underestimation of noise factors present in real-world operating environments, which contribute to approximately 28% of these surprises [1]. To address this, it is essential that test case design explicitly incorporates noise parameters and potential error states that reflect actual field conditions. One effective tool for this purpose is the Parameter Diagram (P-diagram), which helps in developing robust products that are less sensitive to external variability. The P-diagram outlines the relationship between input factors and the desired functional output, while also identifying sources of noise that may disrupt performance.
The process of generating test cases from a P-diagram involves two key steps. First, noise parameters often linked to dominant failure modes are identified and translated into actionable testing elements. These parameters typically include piece-to-piece variation, customer usage behavior, aging effects, system-level interactions, and environmental influences. Second, each of these actions is transformed into specific test cases designed to simulate the corresponding noise effects during reliability testing.
3.1.2. Functional Block Diagram (FBD)
In the context of reliability engineering, the Functional Block Diagram (FBD) serves as a foundational input for Design Failure Mode and Effects Analysis (DFMEA), where each function identified in the diagram is systematically linked to potential failure modes and their associated effects. When used in test case design, the FBD helps ensure that critical functional paths and interface interactions are captured, enabling the development of test scenarios that more accurately reflect real-world operating conditions and potential failure mechanisms.
So, these insights are then translated into targeted test actions, which form the basis of test cases. In this way, the FBD not only supports functional understanding but also strengthens the test case design process by ensuring that critical interactions and dependencies are captured and evaluated under simulated field conditions.
3.1.3. Design Failure Mode and Effects Analysis (DFMEA)
Ensuring high product reliability begins with identifying and validating risks throughout the Product Development Lifecycle (PDLC), with Design Failure Mode and Effects Analysis (DFMEA) serving as the foundational step in this process.
Incorporating DFMEA into test case design is essential for effective risk validation, as studies show that DFMEA-related factors contribute to over 24% of field reliability issues [1]. As a result, DFMEA is considered a critical input for any reliability test planning effort. It involves a systematic evaluation of potential failure modes, their root causes, associated effects, and corresponding mitigation strategies [2,3].
Translating DFMEA findings into test cases allows for the assessment of nearly all identified failure modes within a controlled lab environment. However, it is important to note that certain failure modes or causes may require dedicated testing at the component or sub-assembly level. These tests are considered prerequisites and fall outside the scope of system-level test case conversion. By integrating DFMEA into the test design process, organizations can significantly enhance the accuracy and completeness of reliability validation.
3.2. Legacy Information
3.2.1. Failure Modes
To develop effective and representative test cases, it is essential to analyze field failure data to identify predominant failure modes. This analysis provides direct insight into real-world reliability issues and highlights recurring patterns that may not be evident through design analysis alone. By extracting and categorizing failure modes from field data, engineers can prioritize the most critical risks and ensure that these are systematically incorporated into test case design. This approach strengthens the relevance of system-level testing by aligning laboratory evaluations with actual field performance, thereby improving the accuracy of reliability predictions and reducing the likelihood of unanticipated failures.
In some cases, detailed product-specific data may not be readily available for reliability analysis or test case development. When this occurs, alternative approaches must be employed to ensure comprehensive failure mode coverage. One method involves examining similar or related products to identify common failure modes and patterns that may be applicable. Another approach is to consult established reliability standards and handbooks, such as the NSWC Mechanical Handbook [4], MIL-HDBK-217F [5], and Telcordia SR-332 [6], which provide extensive failure mode data for a wide range of components and systems. These resources serve as valuable references for estimating reliability and constructing representative test cases when direct product data is limited or unavailable.
3.2.2. Failure Trends
When analyzing field failure data for a product, it is essential to evaluate key reliability metrics such as failure occurrence rates, Mean Time to Failure (MTTF), and other performance indicators to inform the development of test case designs. These metrics provide quantitative insight into the frequency and timing of failures, helping to prioritize which failure modes should be addressed in laboratory testing. By incorporating this data into the test case design process, engineers can ensure that the most critical and impactful failure scenarios are accurately represented, thereby enhancing the relevance and effectiveness of system-level reliability validation.
3.3. Internal Study Data
3.3.1. Actual Use Conditions
Actual product use conditions refer to the real-world environments, behaviors, and operational patterns under which a product is deployed and utilized by end users. These conditions encompass a wide range of variables, including usage frequency, load levels, duty cycles, environmental exposure (e.g., temperature, humidity, vibration), and user interaction styles.
Incorporating actual use conditions into test case design is essential for accurately replicating field scenarios and uncovering failure modes that may not surface under ideal or controlled laboratory settings. Aligning test parameters with observed usage data often gathered through field studies, customer feedback, or telemetry engineers can create more representative and effective reliability tests. This approach helps ensure that the product is validated not just for theoretical performance, but for its robustness in the diverse and unpredictable contexts in which it will operate.
3.3.2. Usage Levels and Pattern
Traditional engineering tests conducted at the component and subassembly levels often fail to account for customer usage patterns. These tests typically rely on standardized samples qualified for global platforms, aiming for broad compatibility across multiple product lines. While efficient, this approach frequently overlooks critical aspects of real-world usage, contributing to field reliability issues estimated to account for approximately 12% of failures [1]. To address this gap, customer usage pattern-based testing is essential. It ensures that products are evaluated under conditions that closely mirror actual operational scenarios, thereby enhancing both safety and reliability.
The process of creating test cases based on customer usage patterns as per the paper [1].
When designing test cases, it is crucial to adopt the perspective of the end user rather than that of the engineer. This shift in viewpoint helps ensure that the test cases reflect practical, everyday interactions with the product.
3.3.3. Component Level Test Data
Component test data provides critical insights into the performance, durability, and failure characteristics of individual parts within a system. This data is typically gathered through internal or supplier qualification tests, accelerated life testing, environmental stress screening, and other validation methods conducted at the component level. Incorporating component test data into system-level test case design helps ensure that known weaknesses, tolerance limits, and degradation patterns are accounted for in broader reliability evaluations.
By analyzing metrics such as failure rates, wear-out mechanisms, thermal limits, and electrical thresholds, engineers can design targeted test cases that simulate realistic stress conditions and verify whether the system can tolerate component-level variability. Additionally, component test data supports the identification of high-risk interfaces and dependencies, enabling more precise fault injection and robustness testing. This layered approach strengthens the overall reliability strategy by bridging the gap between isolated component behavior and integrated system performance.
3.4. Interaction Parameters
3.4.1. End User (Operator’s Manual)
Developing test actions based on a product’s operation manual is a key strategy to ensure that the product can be used safely and effectively by its intended users. These test cases should reflect all essential functions, user interactions, troubleshooting steps, safety procedures, and typical usage scenarios as outlined in the manual. This approach helps validate that the product performs reliably under expected conditions and aligns with user expectations.
To create test cases from an operation manual, follow steps presented in the paper [1].
By grounding test case design in documented operational guidance and adopting the user’s perspective, engineers can ensure that reliability testing reflects actual usage and uncovers potential issues that may arise during day-to-day operation.
3.4.2. Service Manual
Designing test actions based on a service manual is essential to validate that maintenance, calibration, repair, and troubleshooting procedures are effective and can be reliably executed by service personnel. This ensures that the product remains functional, safe, and serviceable throughout its lifecycle [1].
To develop such test cases, it is important to thoroughly review the service manual, focusing on the accuracy and completeness of each procedure. This includes verifying that all service tasks can be performed as described, confirming that calibration steps yield correct and consistent results, ensuring that troubleshooting methods lead to accurate fault identification, and validating that repair instructions successfully restore the product to its intended operational state. By incorporating these elements into test case design, engineers can assess the serviceability of the product and reduce the risk of post-deployment failures due to maintenance errors or incomplete procedures.
3.4.3. Consumables
Consumables refer to materials or components that are used up, replaced, or replenished during the normal operation or maintenance of a product such as filters, batteries, lubricants, inks, or cleaning agents. Their performance, compatibility, and replacement cycles can significantly influence overall product reliability. When designing test cases, it is important to account for the role of consumables by simulating their typical usage, degradation over time, and potential variability in quality or sourcing.
Test scenarios should evaluate how the product performs with both standard and suboptimal consumables, assess the impact of delayed or improper replacement, and verify that the product provides clear guidance or safeguards for consumable-related maintenance. Including consumables in reliability testing helps ensure that the product remains functional and safe under realistic operating conditions, especially in cases where end-user behavior or service practices may vary.
3.4.4. Manufacturing Process
The manufacturing process plays a critical role in product reliability and must be considered when designing test cases. Variations introduced during production such as material inconsistencies, assembly tolerances, process deviations, and operator-induced errors can significantly impact product performance and lead to field failures. To account for these risks, test case design should incorporate scenarios that simulate manufacturing-induced variability. This includes evaluating products built under different process conditions, assessing the impact of known production challenges, and validating that the product maintains its intended function across acceptable manufacturing tolerances.
Additionally, insights from process control data, quality audits, and yield trends can help identify high-risk areas that warrant focused testing. By integrating manufacturing process considerations into reliability test planning, engineers can ensure that the product is robust not only in design but also in how it is built ultimately reducing the likelihood of defects and improving field performance.
3.5. Test Case Design Process Flow
The test case design has a five-step process to convert each input parameter to final executable test cases and test matrixes as shown in Figure 6.
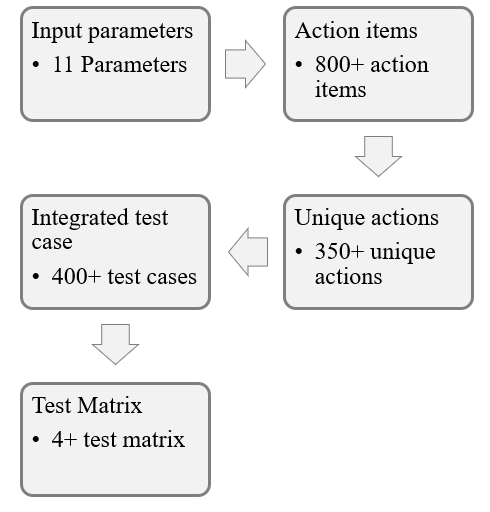
3.5.1. Input Parameters
In the first step, the engineers collect all relevant input parameters available for the product line. The approach is not limited to predefined parameters; it can include any additional inputs that help create test cases representing real-world usage conditions.
Key sources for input parameters include:
- Parameter (P-) Diagram
- Functional Block Diagram (FBD)
- Design Failure Mode and Effects Analysis (DFMEA)
- Customer Usage Patterns and Actual Use Conditions
These are some of the mandatory inputs to create better test case design.
3.5.2. Action Items
Action items serve as the first transition point from input parameters to executable test inputs. In this step, each input parameter is translated into actionable items.
For example, every line item from the DFMEA is analyzed from a testing perspective to identify potential failure modes that can be replicated and validated in a controlled lab environment.
3.5.3. Unique Actions
In this step, all action items are compared to identify uniqueness. Redundant items are removed to create an optimized list of distinct actions. This ensures that only non-overlapping actions progress to the next stage for test case development.
3.5.4. Integrating into Test Cases
Integrating unique action items into test cases involves a two-step process:
- Assigning weightage to input parameters
- Assigning weightage to individual unique actions
Weightage factors are determined by the test case designer based on the problem statement and the product development phase. Typical considerations include:
- If the test focuses on the end-user perspective, higher weightage is given to usage levels, operating conditions, and service scenarios.
- If there is limited information on factor influence, a flat model (equal weightage for all parameters and actions) can be applied.
However, analyzing the problem statement and applying an appropriate weightage model is strongly recommended for accurate and meaningful test design. The weightage model for various input parameters is shown in Table 1.
Table 1: Input Parameters and Weightage Factors
| Input Parameter | Weightage Factor | Individual Unique Actions |
| Parameter diagram (P-diagram) | 15% | Based on mode or cause and its occurrence |
| Functional Block Diagram (FBD)/Interface matrix (IM) | 30% | Based on primary function to secondary function |
| Design failure mode effective analysis (DFMEA) | 30% | Based on occurrence |
| Failure mode | 10% | Based on failure that can happen early |
| Failure trend | 8% | Based on field failures |
| Actual use conditions | 15% | Higher weightage to most used condition |
| Usage levels and pattern | 15% | Based on higher usage to lower usage |
| Component level test data | 5% | Weightage to early failure one |
| End user and service | 15% | Based on occurrence of event |
| Consumables | 5% | Based on usage pattern |
| Manufacturing | 5% | Based on failure observed |
3.5.5. Test Case and Test Matrix
Based on the integrated inputs and the required number of test cases, a test matrix is created. The matrix organizes test cases according to the weightage assigned to each input parameter.
For example:
- If the test matrix consists of 200 test cases, input parameters are distributed proportionally based on their weightage.
- Approximately 60 test cases may include DFMEA-derived inputs, while the remaining cases incorporate other parameters such as functional diagrams, usage patterns, and service conditions.
- Many test cases will include multiple input parameters to ensure comprehensive coverage and realistic simulation of usage conditions.
4. Test Case Design
The test case design methodology is particularly effective for system-level testing when employing Reliability Growth Testing (RGT). This approach emphasizes the exploration of input variations, noise factors, and complex interactions among system components. By systematically incorporating these elements, RGT enhances the likelihood of uncovering hidden failure modes and ensures comprehensive validation of system behavior under diverse conditions.
Each test case should be constructed with a minimum of two and a maximum of five distinct objectives defined as discrete input actions or conditions. This constraint balances thoroughness with efficiency. Test cases with fewer than two objectives may lack sufficient complexity to expose interaction-based failure modes, while those exceeding five objectives risk becoming overly convoluted, leading to an exponential increase in the number of test cases required. This not only prolongs the testing cycle but may also dilute the focus, making it harder to isolate and diagnose failure modes.
While multi-objective test cases are beneficial for capturing intricate system behaviors, excessive objectives can introduce noise and reduce the clarity of test outcomes. Therefore, careful calibration of test case complexity is essential to optimize fault detection without compromising test manageability.
The number of test cases and test matrix based on the inputs parameters for multi-functional printer is shown below in Table 2.
Table 2 illustrates structured progression in the system-level test design process, beginning with diverse input parameters such as DFMEA, P-Diagram, Interface Matrix, and others. Each of these inputs contributes to a set of actionable items, which are then distilled into unique actions to each action reflecting a meaningful aspect of system behavior, risk, or usage condition. Once the unique actions are defined, they serve as the foundation for generating the total test case count. These test cases are designed to validate the system against each unique action under various conditions and scenarios. Finally, the test cases are grouped into test matrices by ensuring comprehensive coverage, traceability, and efficiency in system-level validation. Example of test case inputs from the input parameters for a multi-functional printer as shown in Table 3.
Table 2: Test Case Count from Test Inputs for a Multi-Function Printer
| Input Parameters | Actionable Items Count | Unique Actions Count | Test Case Count | Test Matrix Count |
| P-Diagram | 100 | 30 | 500 to 700 | 3 to 5 contain 50 to 200 jobs range |
| FBD/Interface Matrix (IM) | 50 | 20 | ||
| DFMEA | 500 | 150 | ||
| Failure Mode | 22 | 15 | ||
| Failure Trend | 5 | 5 | ||
| Actual Use Conditions | 12 | 10 | ||
| Usage Level and Pattern | 16 | 16 | ||
| Component Level Test Data | 5 | 3 | ||
| End User and Service | 8 | 5 | ||
| Consumables | 20 | 20 | ||
| Manufacturing | 4 | 3 |
Table 3: Test Case Input Examples
| S. No | Input Parameters | Input from Input Parameters | Action Example | Test Case Input |
| P-01 | P-Diagram | Calibrate variation | Perform calibration during testing by service person | Add one or two test cases in the matrix to include this based on field usage |
| P-02 | FBD/IM | Harness connection to receptacle | Remove and reinsert connector | Test cases based on usage |
| P-03 | DFMEA | Toner spillage during replacement | Create a monitor point to view toner spillage | Test case to view and record this information |
| P-04 | Failure Mode | Two sheet feed by feeder | Test case with A3 paper | Use A3 print or copy jobs |
| P-05 | Failure Trend | Fax job failed during print job | Add concurrent jobs in a matrix | Simulate concurrent jobs condition |
| P-06 | Actual Use Conditions | School facility, Office facility, Commercial | Test case with representing these environment | School conditions are more with one page with more than 30 to 100 copies |
| P-07
|
Usage Level and Pattern | 1 page print 80% | Use more one-page print job | Create 80% print jobs with one page |
| P-08 | Component Level Test Data | Clutch failure after 50,000 cycles | Record usage condition and perform Preventive Maintenance (PM) | Include Preventive Maintenance (PM) test case |
| P-09 | End User and Service | Cancel print while printing | Give 100-page print and cancel | Add 3 jobs in 300 jobs matrix |
| P-10 | Consumables | Plain, Recycle, color papers | Use different types of consumables | Incorporate |
| P-11 | Manufacturing | Enclosed poor finishing. | Check point during installation | Create installation test case to capture this information |
The example test case from the input parameters in Table 3 is illustrated in Table 4.
Table 4: Test Case Design Example
| Parameters | Input |
| Type of job | |
| # of pages | 1 (P-07) |
| Copies | 50 |
| Image or text | Text |
| Original Size | A4 |
| Paper size | A3 (P-04) |
| Paper type | Recycle (P-10) |
| Paper tray | Tray 1 |
| Remark | Cancel job after printing 10 pages. (P09) |
This example in Table 4 covers four input parameters: P-04, P-07, P-09, and P-10. P-04 primarily addresses multi-feed issues involving A3 paper, which has been identified as a common failure mode in legacy input systems. P-07 focuses on usage levels and patterns, noting that nearly 80% of print jobs are single-page tasks. P-09 considers the end-user perspective, particularly situations where users perceive the output as incorrect and cancel the ongoing job. Lastly, P-10 evaluates consumables from the standpoint of using recycled paper.
4.1. Test Case and Test Matrix Execution Approach
Test execution will be performed using a round-robin method. Each test matrix will be executed a minimum of 3 to 5 times before moving to the next set of test cases. This ensures that all failure modes are identified, and all input parameters are tested multiple times to build confidence in the results. Recommendations for changes to the test matrix should be based on failure modes identified during testing and new learnings from each run. If a test case is not yielding any new insights, it is better to move to the next set of test cases. This saturation point typically occurs after 3 to 5 full runs of each test matrix.
5. Test Case Design Improvement Across Product with Closed Loop to Field failure and Scenarios.
This entire methodology is data-driven and relies on multiple input sources. Each input is associated with several parameters, which are continuously updated based on insights from various sources, such as: Field failure data, Internal test data, Manufacturing data, and Legacy product data.
Initially, test cases are derived from the parameters available at the start of the process. Over time, additional parameters are incorporated as new data becomes available. For future products, all learnings from predecessor products are integrated into the test case design.
When test cases span multiple products, the correlation with actual field performance increases significantly often reaching up to 95%. This iterative refinement ensures that test cases remain relevant, comprehensive, and predictive of real-world conditions.
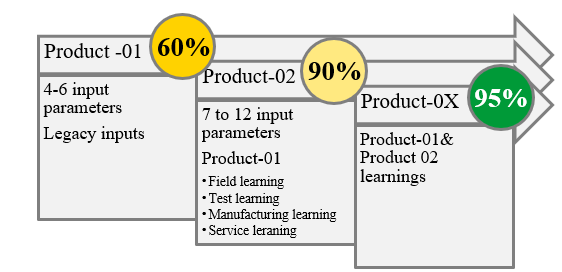
As per Figure 7, In the initial product cycle, testing with limited input parameters achieved approximately 60% correlation between lab-detected failures and field-reported failures. As the number of input parameters increased and learnings from predecessor products were incorporated, the correlation improved significantly reaching up to 95%.
These correlation values are calculated by comparing:
- Number of failures reported in the field
vs.
- Number of failures reproduced in the test environment
This iterative enhancement demonstrates the value of expanding input sources and leveraging historical data to improve predictive accuracy and test coverage.
Table 5: Field to Test Result Correlation for Product-01 with limited Input Parameters
| Failure Mode | Lab testing | Field Failure |
| Paper jam with Fault code – 153 | Yes | Yes |
| Multi-feed papers | Yes | Yes |
| Torn paper from feeder | No | Yes |
| Hole punch option not working | Yes | Yes |
| Noise from feeder | No | Yes |
| Door misalignment | Yes | No |
| Door scratch marks | No | Yes |
| Toner spillage | Yes | Yes |
| Failures identified when compared to field | 4 | 7 |
| Overall correlation % | 4/7= 57%Yes | |
Table 6: Field to Test Result Correlation for Product-02 with all Input Parameters
| Failure Mode | Lab testing | Field Failure |
| Paper jam with Fault code – 330 | Yes | Yes |
| Paper jam with Fault code – 958 | Yes | Yes |
| Scanner fault | Yes | Yes |
| User Interface Grey out | Yes | Yes |
| Toner spillage | Yes | Yes |
| Hard wrinkles on copies | Yes | Yes |
| Multi-feed papers | Yes | Yes |
| Fault code -721 | Yes | Yes |
| Fault-03 | No | Yes |
| Paper jam with Fault code – 153 | Yes | Yes |
| Paper jam with Fault code – 751 | Yes | Yes |
| No fault code paper jam | Yes | Yes |
| Failures identified when compared to field | 11 | 12 |
| Overall correlation % | 11/12= 92% | |
6. Results
The proposed method (Bolded) in Table 7 introduces a more comprehensive and user-centered approach compared to the existing method. While both rely on DFMEA, the proposed method enhances reliability analysis by incorporating FBD/IM, P-Diagram and field failure trends, offering a broader view of real-world issues. It expands legacy information beyond traditional failure modes to include actual usage conditions, patterns, and levels, enriching the data context. Internal study data remains consistent at the component level, but the proposed method adds depth by considering how components perform under real use.
Table 7: Existing Method vs Proposed Method
| Method | Reliability analysis | Legacy information | Internal study data | Interaction parameters |
| Existing method | DFMEA | Failure modes (DFMEA) | Component level test data (DFMEA) | Focused on engineer’s point of view |
| Proposed method | DFMEA
FBD/IM, P-Diagram |
Field failure mode and trends | Actual use conditions
Usage levels and patterns. Component level test data. |
End user and service.
Consumable. Manufacturing |
As per the results from Table 5 and Table 6, the data from two different product lines using the existing method and the proposed method indicates that when relevant parameters are incorporated as inputs to test case design, the correction rate increased from 57% to 92%.
If one can go deeper into each failure mode that is not identified in the lab environment, it provides more insight into what is missing in the lab setup. For example, “torn paper from feeder” could occur due to various types of paper entering the feeder types not considered during lab testing, leading to this failure appearing in the field.
Additionally, this approach creates a closed-loop system for improvement, as outlined in Section 5, ensuring continual enhancement by adding new parameters or adjusting existing ones based on information from various sources.
Most notably, interaction parameters shift from an engineer-centric view to a more holistic perspective that includes end users, service teams, consumables, and manufacturing, making the proposed method more aligned with practical, operational realities.
7. Discussion
In the context of system validation and reliability assessment, several challenges arise during the conversion of action items into executable test cases. Not all action items are directly translatable into test scenarios due to their abstract nature or lack of measurable parameters. Furthermore, certain actions demand extensive testing efforts, which can be resource-intensive and time-consuming, especially when replicating complex operational conditions. A significant limitation is the unavailability or insufficiency of input data, which hampers the ability to construct meaningful and representative test cases. This data gap can lead to incomplete coverage and reduced confidence in the test outcomes. This approach will work well for complex systems where have more interaction between systems, subsystems, and end-user.
From a disadvantage standpoint, the overall cost of testing escalates due to the need for specialized setups, prolonged test durations, and iterative validation cycles. Additionally, overly constrained test cases designed with rigid assumptions or narrow boundaries may inadvertently mask or fail to expose latent failure modes, thereby compromising the robustness of the reliability analysis. Corner cases, while essential for stress testing, can sometimes produce failures that distort reliability metrics and trend analyses, leading to misleading interpretations of system performance under typical operating conditions. Although it has some constraints, Return on Investment (ROI) remains key: the high upfront cost of testing is offset by a significant reduction in warranty costs, recalls, and reputation damage.
8. Conclusion
To enhance the robustness and relevance of system-level testing, it is essential to integrate all valuable analysis results into the test case design. The main contribution of this work is not a single tool, but an integrative framework that defines the relationships and information flow between classical reliability tools that are often used in silos. This framework transforms a collection of static analyses into a dynamic process for test design.
This approach ensures comprehensive coverage of critical variables, noise factors, and interaction effects that influence real-world performance. By embedding these multidimensional insights, the test cases become more representative of actual operating conditions, thereby improving the fidelity of simulations and predictive accuracy. Such enriched test case design facilitates strong field-to-test correlation, with potential alignment reaching up to 95%, significantly reducing discrepancies between lab-based evaluations and field behavior. Moreover, this methodology effectively bridges the gap between controlled laboratory environments and dynamic field conditions, enabling the early identification of latent failure modes and enhancing overall reliability metrics.
Conflict of Interest
The authors declare no conflict of interest.
- R. Lawrance and N. K. R. Gorla, “Test Case Design for the System Level Reliability Testing of a Complex Electro-Mechanical Product+,” 2025 Annual Reliability and Maintainability Symposium (RAMS), Destin, FL, USA, 2025, pp. 1-6, https://doi.org/10.1109/RAMS48127.2025.10935027
- International Organization for Standardization, “Medical devices – Application of risk management to medical devices”, ISO-14971, Geneva, Switzerland: ISO, 2019
- AIAG & VDA, “Failure Mode and Effects Analysis”, Southfield, MI, USA: Automotive Industry Action Group, 2019.
- Naval Surface Warfare Center, “NSWC Handbook of Reliability Prediction Procedures for Mechanical Equipment”, Bethesda, MD, USA: Naval Surface Warfare Center, May 2011.
- Department of Defense, “MIL-HDBK-217F: Reliability Prediction Procedures of Electronic Equipment”, Washington, DC, USA: Department of Defense, Dec. 1991.
- Telcordia Technologies Inc., “Telcordia SR-332: Reliability Prediction Procedure for Electronic Equipment”, Piscataway, NJ, USA: Telcordia Technologies Inc., Feb. 2016.