Evaluation of Three Evaporation Estimation Techniques In A Semi-Arid Region (Omar El Mukhtar Reservoir Sluge, Libya- As a case Study)

Adv. Sci. Technol. Eng. Syst. J. 2(2), 19–29 (2017);
 DOI: 10.25046/aj020204
In many semi-arid countries in the world like Libya, drinking water supply is dependent on reservoirs water storage. Since the evaporation rate is very high in semi-arid countries, estimates and forecasts of reservoir evaporation rate can be useful in the management of major water source. Many researchers have been investigating the suitability of estimates evaporation rates methods in many climatic settings, infrequently of which were in an arid setting. This paper presents the modeling results of evaporation from Omar El Mukhtar Reservoir, Libya. Three techniques namely (artificial neural networks (ANN), Multiple linear regression (MLR) and response surface methods (RSM) ) were developed, to assess the estimation of monthly evaporation records from 2001 to 2009; their relative performance were compared using the coefficient of determination(E), mean absolute percentage error (MAPE%), and 95% confidence interval. The key variables used to develop and validate the models were: monthly (precipitation Rf., average temperature Temp., relative humidity Rh., sunshine hours Sh., atmospheric pressure Pa. and wind speed Ws.). The encouraging results approved that the models with more inputs generally had better accuracies and the ANN model performed superior to the other models in predicting monthly Evp with high E=0.86 and low MAPE%= 13.9 and the predicted mean within the range of observed 95CI%. In summary, it is revealed in this study that the ANN and RSM models are appropriate for predicting Evp using climatic inputs in semi-arid climate.
1. Introduction
Evaporation is one of major components of the hydrologic cycle and it describes the loss of water from water bodies to the air over a long period to elucidate its relationship with annual precipitation. Estimation of evaporation rate is important in the study of hydrology, climate, agricultural water system, design and operation of irrigation systems. Many methods for estimation of evaporation losses from free water surfaces were reported and it can be divided into several categories including: (Empirical Methods, Water Budget Methods, Energy Budget Methods ,Mass-Transfer Methods and Combination Methods) [1]. Accurate and reliable measurement of evaporation for a long term has been investigated by researchers. In deceit, an observation from Class A Pan evaporimeter and contemporary correlation techniques were used, in indirect methods, the evaporation is estimated from other meteorological variables like temperature, wind speed, relative humidity and solar radiation.
Recently, the advanced soft computing techniques have been successfully applied for modeling of hydrological data due to their ability to learn complex and non-linear relations .
In their study [2], the evaporation from Batu Dam Reservoir which is located at the Selangor state, Malaysia was estimated using artificial neural networks (ANN) and climate based models (Penman and Priestley-Taylor). The models output display that ANN-4 model was the best with the coefficient of efficiency (E) of 90%.
In [3], they studied, daily evaporation prediction were prepared by Penman equation, Levenberg-Marquardt algorithm based on “Feed Forward Back Propagation Artificial Neural Networks (LMANN)”, radial basis neural networks (RBNN), generalized regression neural networks (GRNN). noticed that the results of neural network models were statistically more meaningful than the Penman equation.
At their investigation (ANN), Least Squares – Support Vector Regression (LS-SVR), Fuzzy Logic, and Adaptive Neuro-Fuzzy Inference System (ANFIS) techniques improve the accuracy of daily pan evaporation estimation in sub-tropical climates [4]. Meteorological data from the Karso watershed in India (consisting of 3801 daily records from the year 2000 to 2010) were used. Based on the comparison, it was found that the Fuzzy Logic and LS-SVR approaches can be employed successfully in modeling the daily evaporation process from the available climatic data.
In [5] the authors used the response surface method (RSM) to extend estimation of monthly pan evaporations using high-order response surface (HORS) function. A HORS function was proposed to improve the accurate predictions with various climatic data, from two stations, Antalya and Mersin, in Mediterranean Region of Turkey. The HORS predictions were compared to artificial neural networks (ANN), neuro-fuzzy (ANFIS) and fuzzy genetic (FG) methods in these stations. Comparison results indicated that HORS models performed slightly better than FG, ANN and ANFIS models.
In [6], the authors investigate the abilities of six different soft computing methods, Multi-layer perceptron (MLP), generalized regression neural network (GRNN), fuzzy genetic (FG), least square support vector machine (LSSVM), multivariate adaptive regression spline (MARS), adaptive neuro-fuzzy inference systems with grid partition (ANFIS-GP), and two regression methods, multiple linear regression (MLR) and Stephens and Stewart model (SS) in predicting monthly Ep. Long-term climatic data at eight stations in different climates, during 1961-2000 were used . The accuracies of above models ranked as: MLP, GRNN, LSSVM, FG, ANFIS-GP, MARS and MLR. Generalized models were also developed and tested with data of eight stations.
The situation in Libya is typical of semi-arid climate, with average annual rainfall of less than (100 mm )and average annual evaporation is estimated to be (2500 mm )which is much higher than the rainfall [7]. This highlights the seriousness of water losses problem from open water bodies. In the Great-Man-Made-River-Project there are many of this type of open reservoirs, such as the Omar Muktar Open Reservoir. Over 20% of the total Omar Muktar Open Reservoir’s water storage capacity, (4.7Mm3), is lost due to the evaporation phenomena.
Thus, the objectives of this study are to assess the estimates of the evaporation using three techniques against observed evaporation values for Omar Mukhtar Reservoir which is located in semi -arid region. Investigation of the capability and usability of three different soft computing methods, artificial neural networks (ANN), Multiple linear regression (MLR) and response surface methods (RSM) in modeling of the monthly evaporation(Evp.) for Omar Mukhtar open Reservoir. The meteorological data used to estimate the evaporation was acquired from the meteorological observatory included : average air temperature (Temp. C0), relative humidity (Rh.%), atmospheric pressure (Pa. Pas), wind speed (Ws. Knot), sunshine hours (sh. hr), rainfall (Rf. mm) . The evaporation from the pan was multiplied by a factor of (0.73) to get the actual evaporation. Eight years of monthly evaporation recorded from 2001 to 2009 (108 value) were used to in this study. The model performances was compared and discussed through: estimating ( Evp.) of each month using ANN, MLR, and RSM models. This will be the first study to compare the accuracy of multiple soft computing models (Evp.) estimation for open reservoir (Omar El Mukhtar) at semi-arid climates.

2. Materials And Methodology
2.1. Study Area:
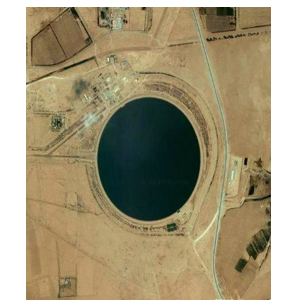
Omar El Mukhtar tank is located at a distance of (45 Km) from the south-east of the city of Benghazi. Create reservoir in the form of free rock fill dam circular shape up (9 m) and a length of (3.2 km) circumference; diameter up to (960 m) from the top as rise in the bottom of the tank from the surface level Sea about ( 55 m) and the maximum level of the run up to (63.5 m) from the surface level Sea, so that a total capacity of (4.7 Mm3) of water, and spacessurface of the reservoir is approximately (750,000 m2) see Figure 1and 2. construct the reservoir layer clay sealing parasitic in nature, and to prevent leakage of water through the rock fill dam was a protective membrane.
2.2. Study Methodology:
MLR is a technique utilized to model the linear relationship between a dependent variable and one or more independent variables. The dependent variable is sometimes additionally called the predictor. MLR is depended on least squares methods . The model is fit such that the sum of squares of differences of estimated and observed values is minimized. MLR probably the most widely used method in hydrology and climatology for developing models to reconstruct or analysis the long-term variations of climatic factors.
MINITAB software programing omits all observations that contain missing values in the response or in the predictors, from calculations of the regression equation and the ANOVA table items. By default, a y-intercept term is included in equation. Thus, MINITAB fits the model However, if the response at x = 0 is naturally zero, a model without an intercept can make sense. If so, choose to not fit an intercept, and the ß0 term will be omitted. Equation 1 provide the general formula for MLR: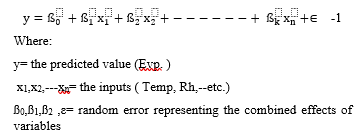
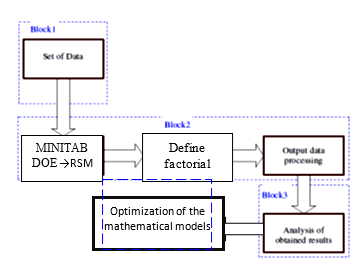
Response surface methodology (RSM) consists of a set of statistical methods that can be used to develop, improve, or optimize products. RSM typically is used in situations where several factors influence one or more performance characteristics, or responses. There are three general steps that comprise (RSM): experiment design, modeling, and optimization. Choosing the design correctly will ensure that the response surface is fit in the most efficient manner. MINITAB provides central composite and Box-Behnken designs see Figure 3 .
The empirical models were fit to the data, and polynomial models (linear or quadratic) typically were used. The Equation illustrates the general case of the full quadratic model for k =3 as an example for independent variables see Equation .2:
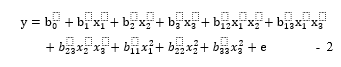
In this equation, the ten coefficients are represented by the bk and e is a random error term representing the combined effects of variables not included in the model. The interaction terms (xixj) and the quadratic terms (xi2) account for curvature in the response surface [8].
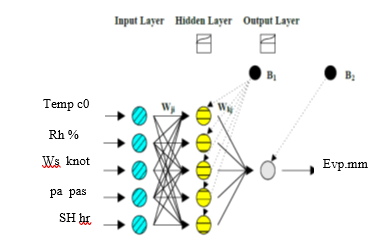
Artificial Neural Networks (ANN) , are a form of computing inspired by the functioning of the brain and nervous system, and discussed in detail in a number of hydrologic papers [9]. The feed forward ANN has been adopted in many hydrological modeling studies because of its applicability to a variety of different problems [4]. Noted that more than one hidden layer may require in feed forward networks because a three-layer network can generate arbitrarily complex decision regions. Also, the appropriate input vector to the ANN model can be identified according to the procedure of the modeler. Back propagation is the most popular algorithm used for the training of the feed forward ANN. An objective function that considers both the ANN’s structure and error, minimizes a linear combination of the resulting ANN’s squared errors, weights, and biases in order to develop a less complex model at the end of training the resulting network has good generalization qualities.
The Levenberg–Marquardt (LM) training algorithm is a trust region based method with a hyper-spherical trust region [9]. This algorithm was implemented in this study using the Neural Network Toolbox of MATLAB, an example of Developed Structure of ANN with input combination as in Figure 4.
2.3. Comparative Statistics
In this study, several statistical parameters were used to evaluate the performance of predicted models, which were given by the following relations [9]: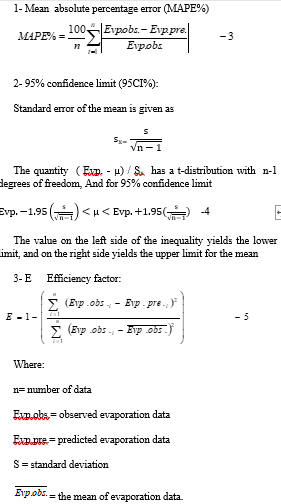
A better fit, with zero indicating MAPE% and high value of E a perfect prediction. Efficiency factor (E = 0 to 1) is calculated on the basis of the relationship between the predicted and observed mean deviations and it can show the correlation between the predicted and observed data. E is better suited to evaluate model goodness-of-fit than the R2 ( the square root of the correlation coefficient between the predicted and observed value). The probability of procedure produces an interval that contains the actual true parameter value is known as the Confidence Level and is generally chosen to be 95CI%. So the model if have a good performance well produce a results within the range of 95CI% of the mean observed evaporation data. The models are used to generate evaporation data which conserve the main statistical characteristics of the historical data. This is verified through comparing values of mean, of generated evaporation data with those of historical data .
3. Predicting Monthly Evaporations of Omar Muktar Open Reservoir
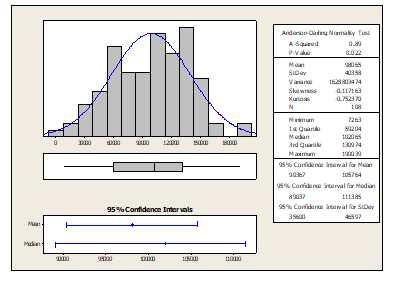
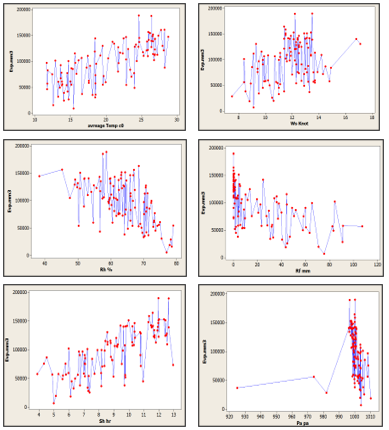
In this study, monthly climatic data at Omar Muktar Open Reservoir (is in the zone of semi-arid climate) were used for developing and testing Evp. models. Figure 5 shows the histogram distribution of the evaporation data with the basic statistical information details. The data used in this research cover 8 years (2001-2009) of monthly records of average air temperature (Temp. c0) , relative humidity (Rh.%), atmospheric pressure (Pa. pas), wind speed (Ws. knot), sunshine hours (sh. hr), rainfall (Rf. mm) pan evaporation (Evp.mm3). Figures 6,7,8, and 9 showing the variation of the evaporation to the climatic parameter using in this study . Table 1 showed the monthly of mean, standard deviation, minimum and maximum values of climatic parameters, respectively.
Table 1. The Statistical Data Information
| Variable | Mean | StDev | Minimum | Maximum |
| Temp max c0 | 25.29 | 5.791 | 15.2 | 33.8 |
| Temp min c0 | 15.541 | 4.929 | 7.1 | 24.6 |
| Rh % | 63.361 | 8.224 | 38 | 80 |
| Ws knot | 11.838 | 1.742 | 7.5 | 17.1 |
| Sh hr | 9.069 | 2.339 | 3.89 | 12.95 |
| Pa pa | 999.75 | 8.39 | 925 | 1010.3 |
| Rf mm | 20.17 | 26.56 | 0 | 107.2 |
| Evp.mm3 | 98065 | 40358 | 7263 | 190039 |
StDev, denote the standard deviation.
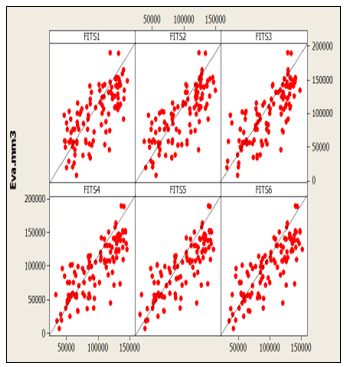
80% of the whole data was chosen for training the Evp. models and the remaining data used for testing the models. Multiple liner regression (MLR) was employed by MINITAB (Ver.16) software package to develop the (MLR) pan evaporation models. The performance including both the accuracy and agreement of the MLR methods were evaluated through different input combinations see Table 3. The comparative statistics i.e, MAPE, 95%, and E, used to illustrate the performance of proposed MLR functions and the best performance was compared with the RSM, and ANN models. Is clear from the Table 3 that the models with full weather inputs have the best accuracy.
Table 3. Error statistics for input combinations using MLR model in test and validation stage.
| Input combinations | RSM
equations |
MPE% | E | The Evp.
predicted average |
95% CI |
| Average
Temp |
37.68 | 0.56 | 98384.74 | 90367-105764 | |
| Average Temp,
Rh |
30.38 | 0.63 | 98287.13 | ||
| Average Temp,
Rh, Ws |
29.40 | 0.67 | 98006.74 | ||
|
Average Temp, Rh, Ws, Sh |
|
25.60 | 0.71 | 98264.62 | |
| Average Temp,
Rh, Ws, Sh, Pa |
|
23.30 | 0.72 | 97925.05 | |
| Average Temp,
Rh, Ws, Sh, Pa, Rf |
21.53 | 0.73 | 97794.92 |
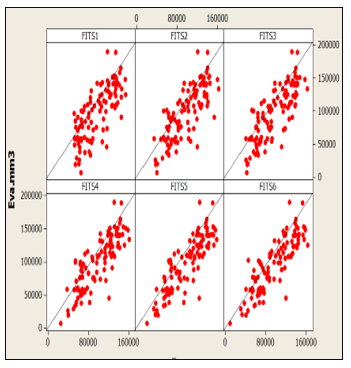
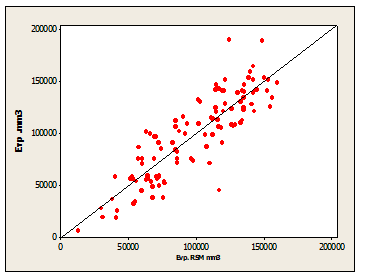
A response surface (RSM) function was proposed with simple formulation to estimate the pan evaporations using climatic input variables. The RSM function was extended on order of polynomial functions based on input variables more than two. In this approach, the polynomial functions were simply and directly calibrated based on the observed climatic data and relative of evaporation data for each input combination. RSM models were compared with each other based on input variables combination see Table 4. These result revealed that the RMS models were much simpler and could successfully use in estimating monthly pan evaporations. The full input RSM models provided results close to observed pan evaporation based on E, MAPE%, 9%CI, see Figure 8 .
Table 4. Error statistics for input combinations using RSM model in test and validation stage.
| Input combinations | RSM
equations |
MPE% | E | The Evp.
predicted average |
95% CI |
| Average Temp | 37.68 | 0.56 | 98384.74 | 90367–105764 | |
| Average Temp,
Rh |
30.38 | 0.63 | 98287.13 | ||
| Average Temp,
Rh, Ws |
29.40 | 0.67 | 98006.74 | ||
|
Average Temp, Rh, Ws, Sh |
|
25.60 | 0.71 | 98264.62 | |
| Average Temp,
Rh, Ws, Sh, Pa |
|
23.30 | 0.72 | 97925.05 | |
| Average Temp,
Rh, Ws, Sh, Pa, Rf |
21.53 | 0.73 | 97794.92 |
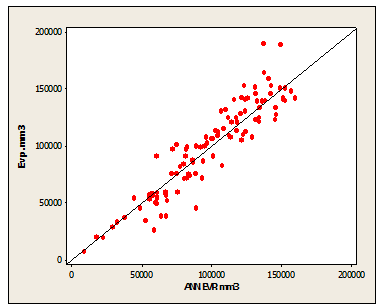
The ANN models were trained using Bayesian Regularization (BR) and Levenberg–Marquardt (LM) algorithms. In ANN models the number of neurons in the hidden layer were found by a trial and error procedure. The activation functions used for the hidden and output layers were the ‘logsig’ and ‘purelin’ functions, respectively. Table 5 showing the structure of ANN models according to the input combination, moreover the models were improved by the accuracy with respect to MAPE%,E,CI 95%. ANN(6,10,1) model indicates model having 6, 10 and 1 for the input, hidden and output, respectively and the data divided in to (86 values for model training,5 values for model validation,5 values for model testing ). Over all ANN showing best prediction for all input combination in both test and validation periods. Figure 10 showing the comparison between the predicted and observed evaporation data.
The best architecture was obtained for ANN evaporation model (ANN 6-10-1) has been selected based on minimum value of MSE and maximum value of E. The output from the best selected architecture for the ANN-6 model was validated using the testing data set (2008 to 2009). The objective of the validation process is to investigate the ability of the model to work with an independent data series that have not been used in training of the evaporation model.
In this study, models with different local input combinations were compared with each other in estimating Evp for (2001-2009). The results showed that the models with more inputs generally have better accuracies.
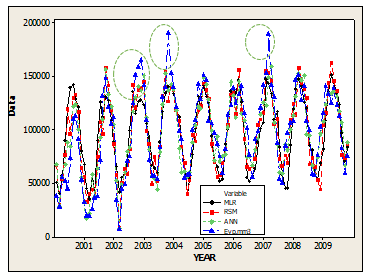
The ANN model performed superior to the other models in predicting monthly Evp at most inputs used, with respect to MAPE%, E and 95CI %. ANN methods provide the best estimations, and can be used successfully also RSM . These two new methods provide a promising new approach for evaporation estimation in semi-arid climates. The best performance results obtained presented at Table 6 also figures 10,11,12and 13.
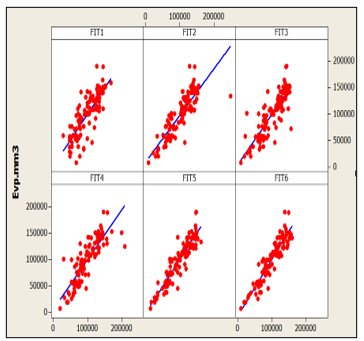
Table 5. Error statistics for input combinations using ANN models in test and validation stage.
| Input combinations | ANN Model
architecture |
MPE% | E | The Evp. predicted
average |
95% CI |
| Average Temp | ANN1 (1,10,1) | 32.85 | 0.66 | 98294.44 | 90367–105764 |
| Average Temp,
Rh |
ANN 2 (2,10,1) | 18.99 | 0.71 | 100922.04 | |
| Average Temp,
Rh, Ws |
ANN3 (3,10,1) | 19.86 | 0.70 | 99092.96 | |
| Average Temp,
Rh, Ws, Sh |
ANN 4 (4,10,1) | 22.08 | 0.71 | 97280.65 | |
| Average Temp,
Rh, Ws, Sh, Pa |
ANN5 (5,10,1) | 14.57 | 0.85 | 98217.31 | |
| Average Temp,
Rh, Ws, Sh, Pa, Rf |
ANN 6 (6,10,1) | 13.90 | 0.86 | 97350.46 |
Table 6. Error statistics for best performance of ANNs, MLR and RSM models in test and validation stage.
| The model | MPE% | E | The average predicted Evp. mm3
|
95% CI
Observed Evp mm3 |
| MLR -6 | 29.46 | 0.65 | 97758.85 | 90367—105764 |
| RSM -6 | 21.53 | 0.73 | 97794.92 |
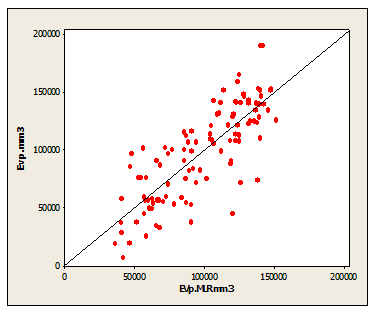
Noted that, Some of unusual observation evaporation value, all models yelled a results lower than it, also closed together, that mean there was a problem when measured these value see Figure 13 highlighted by red circle ( 2003, 2004, 2007 ).
4. Conclusion
This study investigated and compared the abilities of three different soft computing techniques, MLR, RSM, and ANN in
modeling Evp. using different climatic input combinations of (average Temp, Rh, Sh, Ws , Pa and Rf). The climatic data obtained from Omar Muktar Open Reservoir (zone of semi-arid climate) were used for training and testing Evp. models. The models with different local input combinations were compared with each other in estimating monthly Evp. The results showed that the models with more inputs generally have better accuracies and the ANN model performed superior to the other models in predicting monthly Evp with high E=0.86 and lowest MAPE=13.9% and have predicted mean within the range of observed 95CI%, also, the RSM model performed good . In summary, it was revealed in this study that the ANN and RSM models were appropriate for predicting monthly Evp using climatic inputs in semi-arid climate. The present applications can be practically adopted in the field of water resources management for accurately mapping regional distributions of evaporation and related water resource open storages.
- Ministry of Health, Labour and Welfare: A minister’s secretariat Statistical Information Department society statistics section life of the people basics investigation room, http://www.mhlw.go.jp/toukei/saikin/hw/k-tyosa/k-tyosa10/, 12/12, 2011
- National Police Agency: Life security station, Life security planning division, http://www.npa.go.jp/safetylife/seianki/H22jisatsunogaiyou.pdf,12/12, 2011
- Rutter, M: Resilience in the face of adversity, protective factors and resistance to psychiatric disorder. Br J Psychiatry 147: 598-611, 1985
- Herman, J L: Trauma and recovery, Misuzu Publishing, Tokyo, 283-294, 1999
- Hoge, E A, Austin, E D, Pollack, M H: Resilience: research evidence and conceptual considerations for posttraumatic stress disorder. Depress Anxiety, 24(2), 139-152, 2007
- Bonanno, G A: Loss, trauma, and human resilience: have we underestimated the human capacity to thrive after extremely aversive events? Am Psychol, 59(1), 20-28, 2004
- Naoi, K: Analysis of local mental health activity earthquake disaster three and a half months after the Niigata Chuetsu Earthquake and 13 months later: findings and the PTSD risk factor, Jpn Soc Psychiatry Mag, 67(4), 486, 2009
- Munakata, T: Structured Association Technique Therapy, Kaneko Bookshop, Tokyo, 35-32, 2006
- Masten, A S and Coatsworth, J D: The development of competence in favorable and unfavorable environments-lessons from research on successful children, Am Psychol, 53, 205-220, 1998
- D’Zurilla, T J and Nezu, A M: Development and preliminary evaluation of the Social Problem-Solving Inventory, Psychol Assess, 2, 159-163, 1990
- Werner, E E: Protective factors and individual resilience. Handbook of Early Childhood Intervention. Ed. By Meisel S J and Shonkoff, J P, Cambridge University Press, Cambridge, 97-116, 1990
- Wagnild, G M and Young, H M: Development and psychometric evaluation of the Resilience Scale, J Nurs Meas, 1, 165-178, 1993
- Oshio, A et al.: Construct validity of the Adolescent Resilience Scale. Psychol Rep, 93, 1217-1222, 2003
- Munakata, T: Measure the unsolved feelings that became the scientific potentiality of remembrance, transmission, the conversion of the heart, Health Couns, 3(6), 94-102, 2001
- Munakata, T: Recognition and coping action of the stress source, Mental Health Study, National Mind Nerve Center, 39, 29-40, 1993
- Kazuhiro, Y and Munakata, T: Development of the mental health-related standard for Japanese, Soc Mental Health, 3, 63-67, 1997
- Munakata, T et al.: Stress and mind health degree of the city citizen, 32, 49-68, 1986
- Zung, W W K: A Self-Rating Depression Scale. Arch Gen Psychiatry, 12, 63-70, 1973
- Fukuda, K and Kobayashi, S: Japanese edition SDS use guide, 30 Quadrillion Bunches, Kyoto, 1970
- Spielberger, C D et al: STAI manual, Palo Alto, CA, Consulting Psychologist Press, 1970
- Hidano, T et al.: New publication STAI manual, Business Education Publication, Tokyo, 1-10, 2000
- Arita, H: Where rhythm movement lets serotonin nervous system activate from basic medicine, Japanese Medical Affairs Courier, 4453, 38-42, 2009
- Sawada, et al.: Change of the secretion type immunoglobulin A out of saliva in the everyday life of the long-term medical treatment elderly person, Sports Sci, 57, 241-248, 2008
- Willemsen, G, et al.: Cellular and mucosal immune reactions to mental and cold stress: associations with gender and cardiovascular reactivity, Psychophysiol, 39, 222-228, 2002
- Fujiwara, S and Yogo, M: Stress and affective psychology organon with s-IgA as an index, Doshisha Psychol, 50, 57-81, 2003
- Evans, P et al.: Social class, sex, and age difference in mucosal immunity in a large community sample, Brain, Behav Immun, 14, 41-48, 2000
- Higuchi, N et al.: Comparative examination of the effects of the SAT-DVD learning program therapy and the Qigong (the traditional Chinese breathing exercise) therapy to alleviate stress in cancer survivors, Int J Struct Assoc Technique, 3, 61-90, 2009
- Akama, T et al.: Change of salivary secretory IgA by 42 months exercise training in elderly persons, Sports Health Sci, 2, 122-127, 2005
- Taniguchi, S: Group intervention support about mental health and resilience of the nurse, J Health Counsel, 18, 19-26, 2012
- Taniguchi, S: Middle effect of the mental health by the self-image rebuilding using the image method to a nurse, Jpn Health Med Care Behav Sci Soc Mag, 28(1), 71-81, 2013
- Yamamoto, M and Munakata, T: Examination of self-image and -9 self-reward type carrier training back issue intervention effects of the company manager, Sociol Mental Health, 17, 31-38, 2011