Selective Detrending using Baseline Drift Detection Index for Task-dependant fNIRS Signal

Adv. Sci. Technol. Eng. Syst. J. 2(3), 1147–1151 (2017);
 DOI: 10.25046/aj0203144
A functional near-infrared spectroscopy (fNIRS) can be employed to investigate brain activation by measuring the absorption of near-infrared light through the intact skull. The general linear model (GLM) as a standard model for fMRI analysis has been applied to functional near-infrared spectroscopic (fNIRS) imaging analysis as well. The GLM has drawback of failure in fNIRS signals, when they have drift globally. Wavelet based detrending technique is very popular to correct the baseline drift (BD) in fNIRS. However, this method globally distorted the total multi-channel signals even if just one channel’s signal was locally drifted. This paper suggests the selective detrending method using BD detection index to indicate BD as an objective index. The experiments show the performance of the proposed method as graphic results and objective evaluation index with current detrending algorithms.
1. Introduction
A functional near-infrared spectroscopy (fNIRS) can detect regional cerebral blood flow (rCBF) variations through the absorption changes of the near-infrared light at wavelengths between 650–950 nm [1, 2]. fNIRS has important advantages of low cost, portability, and the ability to extend research to young children and within more ecological environments [3]. fNIRS shows similar results to blood-oxygenation-level-dependent (BOLD) outputs of fMRI for same cortical regions and fNIRS also has quite similar cortical activation with fMRI from same BOLD signal [4]. fNIRS analysis has been to adapt well-established methods optimized for fMRI such as statistical parameter mapping (SPM) based on the general linear model (GLM) [5]. However, there is noises, the GLM often fails to find cortical activations. During NIRS measurements, the noises are accrued various reasons, such as subject movement, blood pressure variation, and instrumental instability. When subjects move, the fNIRS optodes may shift relative to the head and alter the coupling between the optodes and scalp, and this results in an artifact that abruptly changes, potentially inducing spikes with amplitude much larger than the true signal [6]. These issues can generate system noise, baseline drift (BD), and baseline jumping in fNIRS signals. Especially, the BD is a very important component which can generate errors of brain activation detection. In order to eliminate the BD high-pass filtering is usually used. However, the frequency response of the hemodynamic response can also be affected during high-pass filtering [8]. To overcome this problem, there were many studies that apply a wavelet-based detrending algorithm. They have good performance of detrending and adjusting baseline. However, they have a problem that cannot distinguish between an increase of fNIRS signal by blood flow and BD at single task stimuli.
This paper suggests a new selective detrending method using BD detection index. The proposed method included the BD detection method using an objective index which use an increase-to-decrease ratio of the fNIRS signal trend. According to the BD detection index, the baseline drifted channels are detected and detrended.
2. Theory and Method
2.1. General Linear Model for fNIRS
In general, most analysis of functional hemodynamic changes in neuroimaging such as fNIRS and fMRI is based on an assumption of the linear addition of hemodynamic changes. The GLM has been used as a standard analyzing method for fNIRS signal analysis, and statistical parametric mapping (SPM) [9] is widely used programs based on the GLM. The GLM describes an expression of the noisy oxy-hemoglobin signal in terms of a linear combination of L explanatory variables and each error terms:
![]()
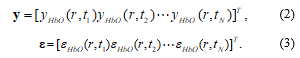
where βi denotes an unknown strength of response, and xi(t) is an explanatory variable from a model of hemodynamic responses [10]. Let y and ε denote the vector of the time series of the hemodynamic signal and noise at the location r:
 The corresponding GLM model is represented by a matrix form as follows:
![]() where y is an N-dimensional column vector, ε is error vector, and β is L-dimensional column vector that represented from unknown strengths of the response.
where y is an N-dimensional column vector, ε is error vector, and β is L-dimensional column vector that represented from unknown strengths of the response.
2.2. Modified GLM with Baseline Drift
When there exist BD of a signal, the GLM often fails in the fNIRS measurements [11]. In a novel detrending algorithm for fNIRS, the BD is included as part of the GLM:
![]() where θ is additional global BD. According to the modified Beer-Lambert law (MBLL), the change of the noisy measured optical density (OD) data is described by the following matrix formulation for fNIRS:
where θ is additional global BD. According to the modified Beer-Lambert law (MBLL), the change of the noisy measured optical density (OD) data is described by the following matrix formulation for fNIRS:
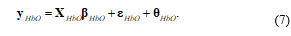
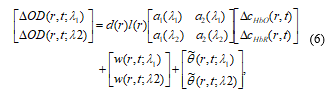 Where d(r) is differential path length factor (DPF) and l(r) is distance between the sources to detector at position r. ai (λi) is the extinction coefficient of the i’th chromophore at wavelength (λ). denotes the global trend for wavelength (λi) at the location r. Let yHbO, εHbO, and θHbO denote vectors of the oxy-hemodynamic response signal, noise signal, and global trend signal. The modified GLM is represented for fNIRS as follows:
 2.3. Proposed Selective Detrending Method
The measured oxy-hemodynamic noisy signal (ŷ) can be represented by time-channel form as follows:
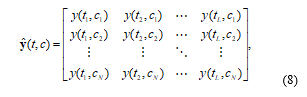 where L is length of acquisition time, c is acquisition channel, and N is number of channel from NIRS signal acquisition system.
On the other hands, wavelet transform is widely used in various signal processing because it is very efficient and powerful for frequency analysis of a signal. In this paper, the measured oxy-hemodynamic noisy signal (ŷ) is decomposed using modified wavelet transform based on Daubechies6 wavelet basis. The modified wavelet transform consist of 11 level tree and 12 sub-bands of the wavelet coefficient. The decomposed oxy-hemodynamic noisy signal (wjŷ(t,c)) is the wavelet coefficient of the j’th level at time (t) and channel (c), and it can be expressed in 3-demensional matrix as follows:
 The wavelet coefficient of the 6th level (w6ŷ) is well represented on the signal trend of hemodynamic response, and the 11th level (w11ŷ) is represented on the signal slope of the global baseline. The BD generates a difference between length of increase sections and decrease sections. Using the difference of the wavelet coefficients, we calculate a new index for the BD detection. Let γ+ is increase and γ- decrease length of the wavelet coefficient of the 6th level (w6ŷ):
 where diff[w6ŷ]+ is a positive differential value of w6ŷ, and [w6ŷ]- is negative differential value of w6ŷ. The BD index (BI)
defined as follows: 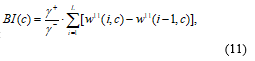
here, BI(c) objectively indicates a degree of the BD for each measured channels. And then, the detrending process is selectively performed depending on a BD threshold, and it is determined by abrupt increase changing point on sorted channel. If an index (BI) of some channels have high values, the detrending process of the fNIRS signals of the channels are selectively performed using wavelet-MDL (minimum description length) [10].
3. Experimental Result
The fNIRS data were obtained by fNIRS brain imaging system (FOIRE-3000, Shimadzu, Japan) at 10 Hz sampling frequency. All of data were approved by the Institutional Review Board (IRB) at Daegu Gyeongbuk Institute of Science & Technology (DGIST). To perform experiment of the proposed BD index, a subject who is right-handed without known neurological, physical illness participated. Fig. 1 shows the task-dependant test data 1 which is obtained from general motions of upper-limb rehabilitation in a block design (5 repetitions with 15s task and 15s rest). BD can be found in channel 6, 33, and 43 in Fig. 1 (a). Oxy-hemoglobin (HbO) signals for the selected channels are shown in Fig. 1 (b)-(d).
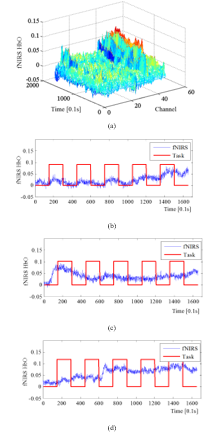 Fig.1: The signals of test data 1, (a) fNIRS signal on time-all channels, (b) the signal of channel 6, (c) the signal of channel 33, and (d) the signal of channel 43,
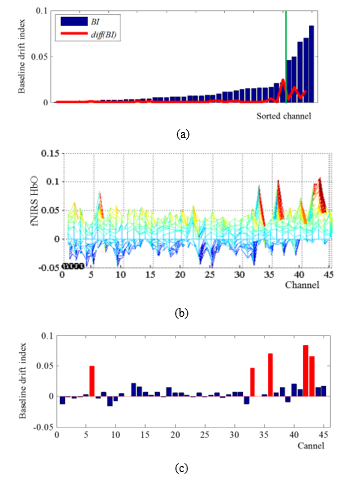 Fig.2: BD detection result from test data 1, (a) BI on sorted channel, (b) fNIRS signal on each channels, and (c) the result of BD detection.
To evaluate the proposed BI, the result of BD detection is presented in Fig. 2. The change of BI on sorted channel and a threshold of BD are shown in Fig. 2 (a). As can be seen Fig. 2 (b) and (c), the BI of channel 6, 33, 36, 42, and 43 have more high score than the threshold, and baseline drifted channels for detrending can be detected.
The obtained fNIRS signal is analysed by HRF (hemodynamic response function) smoothind and wavelet-MDL. HRF smoothing and wavelet-MDL have good performance for denoising and detrending, and the detrending of wavelet-MDL can adjust BD. However, wavelet-MDL can often distort a NIRS signal at a specific experimental environment of only single task stimuli. The graphical results of fNIRS detrending are shown in Fig 3 to compare with wavelet-MDL. In order to evaluation performance of the detrending, task-dependant test data 2 that is obtained from general walking motions in a block design (1 repetitions with 20 s task and 20 s rest)
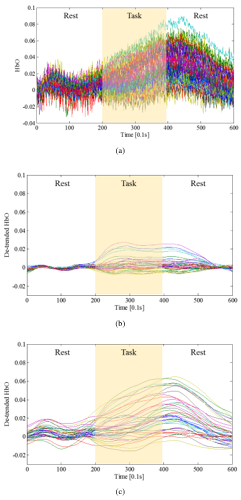 Fig.3: Detrending of test data 2, (a) the measured original fNIRS signals, (b) the result of detrended fNIRS signal using HRF smoothing and wavelet-MDL, and (c) the result of detrended using proposed method.
Fig. 3 (a) is the measured original fNIRS signals of 40 channels which measured on a whole brain. (b) shows the result of detrended fNIRS signal using HRF smoothing and wavelet-MDL on all channels, and can be confirmed that it has too much signal distortion to compare with Fig. 3 (a). However, Fig. 4 (b) shows the result of detrended fNIRS signal using proposed selective detrending method, it keeps original characteristic and hemodynamic response of fNIRS signals on Fig. 3 (a).
In order to evaluate performances of the algorithms, the contrast-to-noise ratio (CNR) is used to the fNIRS signals. If large difference of each part and small variation of one part, the CNR has high value. The CNR indicate that the higher CNR value of fNIRS signal, the better performance of the algorithm. Table 1 shows detailed CNR of real measured whole brain fNIRS signals of 40 channels that used on Fig. 3.
Table 1 The performance of fNIRS detrending obtained using CNR.
| Original | Wavelet-MDL | The proposed method | ||
| CNR (dB) | Measured noise | 0.231 | 0.128 | 0.327 |
| Improvement rate | – | 55 % | 142 % | |
As can be see Table 1, the proposed method has high CNR than both of the original fNIRS signal and the wavelet-MDL. Moreover, wavelet-MDL has low CNR than the original signal because of the signal distortion. It shows that the proposed method has a better detrending performance than conventional algorithm on the task-oriented fNIRS signals.
4. Conclusions
This paper dealt with detrending of globally drifted fNIRS signal. The baseline drift detection method was suggested to selectively extract the drifted fNIRS channels by quantifying objective indicator of baseline drift. It was determined by quantitatively manipulating wavelet coefficients based on a stability of the baseline. The proposed detrending highly performed the identification of selective drifted channels and enhancement of fNIRS singal. This method will be carried out in advance of global detrending of fNIRS signals for enhancing quality of task-dependant fNIRS signal post-processing including neuro-cortical mapping, brain signal decoding, etc. The autonomous optimal baseline index determination and following noise elimination should be further discussed.
- G. Lee, S. H. Lee, S. H. Jin, and J. An, “Baseline drift detection index using wavelet transform analysis for fNIRS signal,” in Brain-Computer Interface (BCI), 2017 5th International Winter Conference on, 2017, pp. 73-76.
- H. Santosa, M.J. Hong, S.P. Kim, and K.S. Hong, “Noise reduction in functional near-infrared spectroscopy signals by independent component analysis,” Review of Scientific Instruments, vol. 84, no. 7, 2013.
- T. Fekete, D. Rubin, J.M. Carlson, and L.R. Mujica-Parodi, “The NIRS analysis package: noise reduction and statistical inference,” PloS one, vol. 6, no. 9, 2011.
- S. Jin, S.H. Lee, G.H. Jang, Y.J. Lee, J. An, and Y.S. Lee, “Cortical activation by fNIRS and fMRI during grasping in patient with traumatic brain injury: a case study,” In Brain-Computer Interface (BCI), 2014 International Winter Workshop on IEEE, pp. 1-4, 2014.
- K.J. Friston, P. Fletcher, O. Joseph, A. Holmes, M.D. Rugg, and R. Tunner, “Event-related fMRI : characterizing differential responces,” NeuroImage, vol. 7, pp. 30–40, 1998.
- J.C. Ye, S. Tak, K.E. Jang, J. Jung, and J. Jang, “NIRS-SPM: statistical parametric mapping for near-infrared spectroscopy,” Neuroimage, vol. 44, no. 2, pp. 428-447, 2009.
- B. Abibullaev, and J. An, “Classification of frontal cortex haemodynamic responses during cognitive tasks using wavelet transforms and machine learning algorithms,” Medical engineering & physics, vol. 34, no. 10, pp. 1394-1410, 2012.
- K. J. Friston, J. Ashburner, S. Kiebel, T. Nichols, and W. Penny, Eds., Statistical Parametric Mapping: The Analysis of Functional Brain Images, Academic Press, San Diego, CA, 2006.
- K J. Friston, A P. Holmes, K.J. Worsley, J.P. Poline, C.D. Frith, and R.S.J. Frackowiak, “Statistical parametric maps in functional imaging: a general linear approach,” Hum. Brain Mapp, vol. 2, no. 4, 189-210, 1995.
- K.E. Jang, S. Tak, J. Jung, J. Jang, Y. Jeong, and J.C. Ye, “Wavelet minimum description length detrending for near-infrared spectroscopy,” Journal of biomedical optics, vol. 14, no. 3, 2013.
- M. Cope and D.T. Delpy, “System for long-term measurement of cerebral blood and tissue oxygenation on newborn infants by near infra-red transillumination,” Med. Biol. Eng. Comput, Vol. 26, pp. 289–294, 1988.