Effect of Cold Drawing Pass Schedule on Mechanical Properties and Microstructure of ST 52 during Cold Drawing of Seamless Tubes and its Influence on Springback

Adv. Sci. Technol. Eng. Syst. J. 2(3), 1202–1210 (2017);
 DOI: 10.25046/aj0203152
In-elastic recovery behavior of seamless tube material has been investigated by uniaxial tensile tests. Unloading Stress–Strain curves obtained under different passes of cold drawing process shows that the percentage of in-elastic recovery to the total recovery increased with plastic deformation. This paper is an experimental study that shows Young’s Modulus decreases with plastic strain for ST 52 material. It is found that with increase in plastic strain, Young’s Modulus reduces rapidly initially then reduces more slowly and finally settles to stable value due to increase in plastic deformation and ultimately increased residual stresses. This variation of Young’s’ Modulus is related to internal stresses, residual stresses, micro cracks, dislocations during plastic deformation. Similarly, Scan Electron Microscopy (SEM) and Micro-hardness testing reveals that mechanical properties are better in the first pass sample of multiple cold drawing passes. The results of this study reveals that 10-20% degradation occurs in Young’s Modulus for 5-7% plastic strain and better mechanical properties are achieved in the first pass sample.
1. Introduction
It is well known that the elastic strain recovery is present during loading and unloading a steel sample and it leads to a hysteresis behavior or energy loss of the material. Thus, description of the elastic behavior strongly affects the springback prediction of a forming simulation. One of the most troublesome problems facing the tubing production industry is springback in the tube making process. With the ongoing miniaturization of products, springback is a dominant effect because material behavior greatly varies in this process.This paper is an extension of work that was originally presented in 2016 IEEE International Conference on Industrial Engineering and Engineering Management (IEEM) [1].When a seamless tube is drawn from drawing bench after drawing, the springback phenomenon occurs due to the residual stresses leading to an undesired deformation. This magnitude of springback effect is nearly proportional to the Young’s Modulus and strain hardening behavior of material. This phenomenon is particularly critical for high strength steels, which have been increasingly used in the automotive industries in regard to the performance improvement and light-weight design. Generally, the springback strain is an elastic strain.
The mechanism behind springback is the release of residual stresses in a work piece after the forming process. A success of the springback prediction strongly depends on the applied materials model. Among various parameters of the model, Young’s Modulus is one of the most important factors influencing the calculation accuracy that should be considered as function of strain. It also influences the plastic-forming quality of the formed components, especially springback. Young’s Modulus actually is having correlation with plastic strain and its accurate characterization is necessary to improve springback in the cold drawing process. The purpose of the investigation described here is to study the influences of pass schedule on the mechanical properties and microstructure, since it is necessary, for the development of ultrahigh strength seamless tubes, to characterize variation of the microstructures and to clarify the mechanism how pass schedule affects the mechanical properties.
2. Literature Review
Many researchers have investigated the effect of Young’s Modulus, material behavior and microstructure on springback in different manufacturing processes.
The change of Young’s Modulus with increasing plastic strain was firstly investigated by [2]. In this research, he found that the actual springback was greater than that calculated with a constant Young’s Modulus and independent of plastic deformation. However, a constant Young’s Modulus was often used in many commercial Finite Element Methods (FEM) codes because of its simplicity. A simple analytical model was used to describe the relationship between Young’s Modulus and plastic deformation based on experimental results. Great efforts have been made to study Young’s Modulus and its effect on spring-back in the recent years [3].Researchers concluded that the correct choice of the yield criterion and consideration of the change in Young’s Modulus are essential for improving the prediction accuracy of springback in the numerical simulation [4].Young’s Modulus decreases with the increase of plastic strain during cyclic tension– compression deformation and proposed an empirical expression to describe the variation of Young’s Modulus with respect to plastic strain [5].The material response is calculated under the assumption of fully elastic deformations in the complete model [6, 7, and 8].An alternative method was explained as inverse forming, during which the loads were reversed and the tools gradually retracted. Because of more computational cost, it is least used. At the same time it is more realistic because the contact forces are present during the unloading step [9, 10, 11,12 and 13].The work reported that the major improvements in the critical properties of a double corrode panel can be achieved using variable blank holder process. Springback was significantly reduced and dent resistance increased [14].Retained austenite exits in many hardenable steels and its presence induced both positive changes in mechanical engineering properties[15].Mathematical expression describing the relation of Young’s Modulus with plastic strain was proposed and this expressions was implemented into LS-DYNA for simulation of U-Channel springback[16].The variation of Young’s Modulus during loading and unloading was considered to identify different variables affecting ratcheting simulation [17].The work reveals the influence of pre deformation on the springback of steel AHSS sheets under consideration of the Young’s Modulus change and the effect of this change as a function of plastic strength[18].An elasto-plastic model using a kinematic hardening model was made for springback analysis in sheet metal forming. The change of Young’s Modulus versus plastic strain was proposed by [19]. Strain recovery after plastic pre-strain and associated elastic and inelastic behavior during unloading and unloading of DQSK steel sheet were measured. Slope of the elastic modulus variation was different during loading and unloading step due to the reciprocal dislocation movement. The amount of springback was calculated by using the process of elastic recovery as well as established values of Young’s Modulus and poisson’s ratio. Results concluded that inelastic strain released from the formed state was major source of additional strain recovery whose magnitude depends on forming stress state [20].
In spite of ample research conducted on springback dependence on Young’s Modulus in different manufacturing processes like sheet metal bending, rolling, forming, drawing etc., still there is scope for the prediction of springback in cold drawing of seamless tubes and its dependence on Young’s Modulus.
3. Materials and Methods
Material selection process has utmost importance in engineering applications. The failures arising from bad material selection are not uncommon in many industries.
Materials:
The materials under study for dies-plugs used for cold drawing and seamless tubes are:
3.1. Die and Plug material (D3):
The material for dies and plugs is D3 (high carbon high chromium cold-work tool steel) having chemical composition as shown in Table 1.
Table 1 Chemical composition of D3
| Component | Min % | Max % |
| Carbon, C | 2 | 2.35 |
| Chromium, Cr | 11 | 13.5 |
| Manganese, Mn | 0 | 0.6 |
| Silicon, Si | 0 | 0.6 |
| Phosphorous, P | 0 | 0.03 |
| Sulphur, S | 0 | 1 |
| Tungsten, W | 0 | 1 |
| Vanadium, V | 0 | 1 |
The physical and mechanical properties for die and plug material are tabulated as shown in Table 2.
Table 2 Properties of D3
| Properties | Value |
| Physical | |
| Density (g/cc) | 7.87 |
| Mechanical | |
| Hardness (RC) | 64 |
| Modulus of elasticity (N/mm2) | 207 |
| Poisson’s ratio | 0.29 |
3.2. Tube material
The material taken in this work is an uncoated cold rolled ST 52 steel with thickness 5.0 mm. The chemical composition of the tested tube sample is shown in Table 3 and the mechanical properties of mother or hollow tube of 75 mm X 5 mm are listed below in Table 4.
Table 3 Chemical composition of ST 52
| Component | Min % | Max % |
| Carbon, C | 0.16 | 0.2 |
| Iron, Fe | – | – |
| Manganese, Mn | 1.4 | 1.6 |
| Silicon, Si | 0.3 | 0.5 |
| Phosphorous, P | 0 | 0.025 |
| Sulphur, S | 0.01 | 0.025 |
Table 4 Properties of ST 52
| Physical Properties | Value |
| Density (g/cc) | 7.87 |
| Mechanical Properties | |
| Hardness (Brinell) | 207 |
| Hardness (Rockwell B) | 94 |
| Hardness (Rockwell C) | 17 |
| Ultimate tensile strength (N/mm2) | 602 |
| Yield strength (N/mm2) | 522 |
| Elongation at break (%) | 32.6 |
| Modulus of elasticity(KN/mm2) | 210 |
| Bulk modulus(KN/mm2) | 140 |
| Poisson’s ratio | 0.3 |
| Shear modulus(KN/mm2) | 80 |
The actual chemical composition on spectrometer is shown in Table 5.
Table 5 Actual chemical composition of ST 52
| C | Mn | Si | P | S | Cr | Mo |
| 0.17 | 0.63 | 0.2 | 0.008 | 0.023 | 0.05 | 0.16 |
4. Experimentation
An experiment is a procedure carried out to support, refute or validate a hypothesis. Experimentation is carried to draw a mother or hollow tube through three passes to get the final desired dimensions.
4.1. Cold Draw Reduction
Since a high area reduction is required, multiple drawing passes are generally necessary to avoid fracture of the tubes during the drawing process. To study the effect of Young’s Modulus, reduction passes as shown in Table 6 are considered.
Table 6 Reduction passes
| Pass
Schedule |
Outer diameter (mm) | Thick-ness (mm) | Inner diameter
(mm) |
Reduction on outer diameter(%) |
| Mother tube | 75 | 5 | 65 | — |
| First pass | 68 | 5 | 58 | 9.3 |
| Second pass | 60 | 5 | 50 | 11.8 |
| Third pass | 50 | 5 | 40 |
4.2. Universal Testing Machine (Tensile Test)
Uniaxial tension specimens were cut from the as received tube in the longitudinal direction. The dimensions of each specimen were in accordance with ASTM E370 with the gauge length of 50 mm as shown in Figure 1.In order to minimize the influence of machining forces, linear cutting of the specimens was used. Uniaxial tensile test was carried out on UTM with a precise extensometer. For tensile properties, tensile specimens were loaded in UTM TUE-C-600.Load-elongation data were recorded and converted into stress-strain graphs. Yield strength, Ultimate Tensile strength, Young’s Modulus and ductility (% elongation and reduction) were determined in accordance with ASTM standard test procedures (ASTM E18, ASTM E23, ASTM E8).
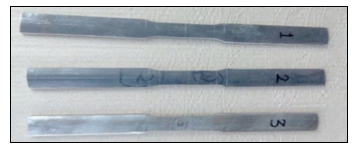 Figure 1 Test specimens for Tensile Test (Sample photograph)
4.3. Hardness Testing
Tensile test was carried out at each stage of cold draw pass to study the varying mechanical properties. The different mechanical properties measured are Yield Strength (YS), Ultimate Tensile Strength (UTS), Elongation (% E) and Hardness.
For hardness testing, the oxide layers formed during heat treatment were removed by stage-grinding and then polished. The average Brinell Hardness Number (BHN) readings were determined by taking two hardness readings at different positions on the samples, using a Brinell hardness tester. Micro hardness examination was carried out on Vickers hardness tester-MacroMann technologies with load 200 gm on scale HV 0.2 with dwell time of 20 seconds.
4.4. Microstructure Examination
Microstructure examination of all the samples were carried out in Olympus metallurgical microscope. Each sample was carefully grounded progressively on emery paper in decreasing coarseness from grit size 120, 320, 400, 600, 800.The grinding surface of the samples were polished using diamond paste. The crystalline structure of the specimens were made visible by etching using solution containing 3% nitric acid and 97% methanol on the polished surfaces. Microscopic examination of the etched surface of various specimens was undertaken using a metallurgical microscope with an inbuilt camera through which the resulting microstructure of all the samples were photographically recorded with magnification of 100 X and 500 X.
4.5. Scan Electron Microscopy (SEM)
A scanning electron microscope (SEM) is a type of electron microscope that produces images of a sample by scanning the surface with a focused beam of electrons. The electrons interact with atoms in the sample, producing various signals that contain information about the sample’s surface topography and composition. For SEM, sample preparation was carried out by polishing and etching the sample as in case of metallurgical microscope. Machine used was Field Emission – SEM Model – Sigma.
5. Results and Discussions
5.1. Tensile test:
The results obtained by tensile test on universal testing machine (UTM) are provided in Table 7 for mother or hollow tube, intermediate passes and final pass.
Table 7 Properties obtained on UTM
| Stage
|
Yield Strength(N/mm2) | Ultimate Tensile Strength
(N/mm2) |
Elongation
(%) |
YS/UTS | Strain | Young’s
Modulus (N/mm2) |
| Mother tube | 451.20 | 520.41 | 18 | 0.87 | 0.180 | 199 |
| First pass | 484.10 | 550.00 | 17 | 0.88 | 0.175 | 207 |
| Second pass | 564.20 | 620.12 | 16 | 0.91 | 0.160 | 214 |
| Third pass | 630.51 | 685.21 | 14 | 0.92 | 0.14 | 222 |
From this it is clear that mechanical properties are found increasing with the rise in degree of cold working. Also, there is an effect of pre-existing strain of tube on Young’s Modulus after cold drawing. It is found that there is inverse proportion between pre-strain and Young’s Modulus. Springback prediction and compensation are the major challenges in the modern tube manufacturing industry. In spite of plenty of developments and a certain amount of progress in the field of simulation of tube making processes, the industrial needs for accurate numerical prediction of springback are not yet being met. Springback, a phenomenon that is related to the elastic strain recovery after removal of forming loads, is physically governed by the stress state achieved at the end of forming process and by elastic response of formed parts. The elastic response of the parts is associated with the removal of forming tools. Despite all that, several times it was reported that Young’s Modulus drops with the increase in plastic pre-strain in a material which is found in this research work. Table 8 shows the same.
Table 8 Readings of pre-strain against Young’s Modulus.
| Sr. No. | Pre-strain (mm) | Young’s Modulus(N/mm2) |
| 1 | 0.160 | 222 |
| 2 | 0.175 | 214 |
| 3 | 0.180 | 207 |
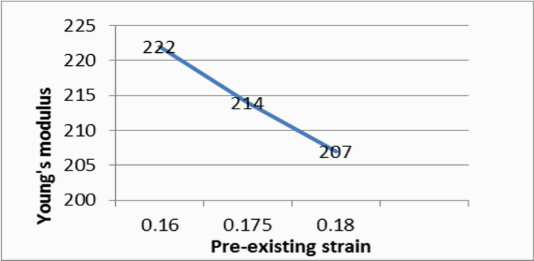 Figure 2 Graph of pre-existing strain vs. Young’s Modulus
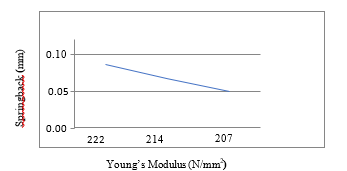
From Figure 2, it is found that degradation of Young’s Modulus was found with increase in degree of plastic pre-strain in a material. Ten readings are taken at 5 different locations (Table 9) for outer diameter of the drawn tubes with digital micrometer of 1 micron accuracy to find the springback. Springback is the deviation from targeted dimension. The results are taken to co-relate the relation of Young’s Modulus and springback in cold drawn tubes as shown in Figure 3 and Table 10.
| 0.00 |
| 0.05 |
| 0.10 |
| 222 |
| 214 |
| 207 |
| Springback (mm) |
| Young’s Modulus (N/mm2)
|
| Grain size No.: 9.75,
Grain size in µm :12.98 (a) |
Grain size No.: 7.97,
Grain size in µm : 20.30 (b) |
|||
|
||||
| Grain size No.: 9.59,
Grain size in µm : 12.66 © |
||||
Table 9 Tube outer dimensional inspection after each pass of drawing
| Tube Size (mm) | Pass | Die size (mm) | Tube outer diameter dimensions (mm) | Spring
back (mm) |
|||||
| 1 | 2 | 3 | 4 | 5 | Average | ||||
| 70 X 5 | Mother tube | — | — | — | — | — | — | — | — |
| 68 X 5 | First pass | 68 | 68.070 | 68.087 | 68.093 | 68.089 | 68.091 | 68.086 | 0.086 |
| 60 X 5 | Second pass | 60 | 60.071 | 60.060 | 60.063 | 60.071 | 60.068 | 60.067 | 0.067 |
| 50 X 5 | Third pass | 50 | 50.045 | 50.051 | 50.048 | 50.055 | 50.049 | 50.0496 | 0.050 |
Table 10 Young’s Modulus against Springback
| Sr. No. | Young’s Modulus(N/mm2) | Springback(mm) |
| 1 | 222 | 0.086 |
| 2 | 214 | 0.067 |
| 3 | 207 | 0.050 |
From the results; the degradation of Young’s Modulus is directly correlated to the degree of plastic pre-strain in tubes. Further, the actual springback is directly co-related to the degradation of Young’s Modulus. Based on the studies, the degradation of Young’s Modulus have significant effect on final elastic strain recovery and final shape of the product. Hence, a control over close dimensional tolerances can be achieved by optimizing the degradation on Young’s Modulus which can be optimized by selecting degree of pre strain in tube and reduction ratio.
Table 11 Results of micro hardness test
| Pass | Micro hardness readings
(200 mg,20 sec dwell) |
Average | ||
| Mother tube | 131 | 128 | 130 | 129.66 |
| First pass | 140 | 140 | 134 | 138.00 |
| Second pass | 184 | 185 | 184 | 184.33 |
| Third pass | 184 | 198 | 200 | 194.00 |
Table 11 shows that the hardness values increases as number of passes increases.
5.2. Microstructures and grain growth
Microstructures of the tested ST 52 steel samples were examined with Metallurgical Microscope. The specimens for optical microscopy were etched using 3% Nital. The microstructures obtained under microscope are shown in Figures 4-7.
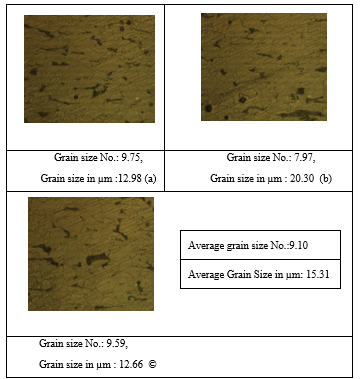 Figure 4 (a), (b), (c) Microstructures of mother tube
| Grain size No.: 9.33
Grain size in µm : 12.87 (d) |
Grain size No.: 9.62
Grain size in µm :11.51 (e) |
||
|
|||
|
Grain size No.: 9.08 Grain size in µm: 13.95 (f) |
|||
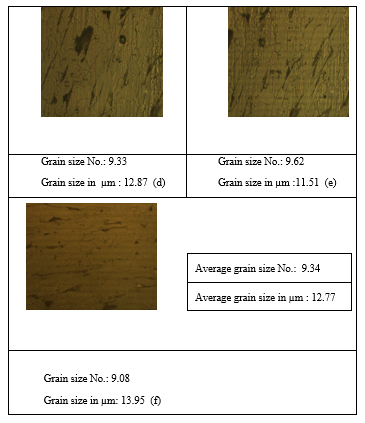 Figure 5 (d), (e), (f) Microstructures of first pass tube
| Grain size No.: 10.50,
Grain size in µm : 8.77 (g) |
Grain size No.:10.47
Grain size in µm : 8.55 (h) |
||
|
|||
| Grain size No.: 10.10
Grain size in µm : 8.90 (i) |
|||
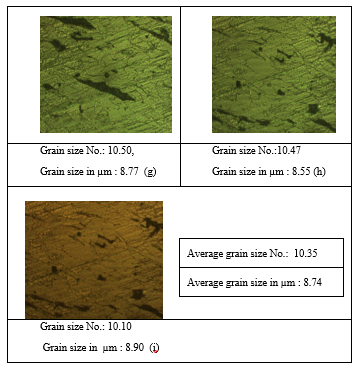 Figure 6 (g), (h), (i) Microstructures of second pass tube
| Grain size No:8.33
Grain size in µm :14.248 (j) |
Grain size No.: 8.16
Grain size in µm-18.90 (k) |
|||
|
||||
| Grain size No.: 8.61
Grain size in µm : 17.74 (l) |
||||
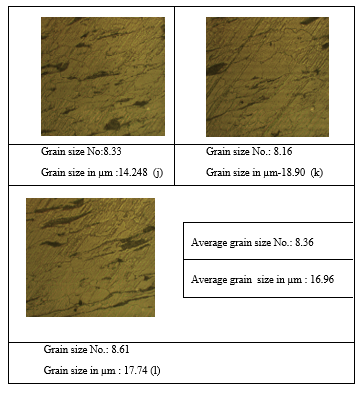 Figure 7 (j), (k), (l) Microstructures of third pass tube
From the observed microstructure it is found that grain size is decreasing with the rise in reduction. This is due to the increased deformation with simultaneous passes. Further the effect of grain deformation before cold drawing on springback cannot be neglected. Grain refinement is an effective means for improving the strength and lowering the ductile-brittle transition of structural alloys. The improvement can often be expressed in an equation of the Hall-Patch form. However, the appropriate use of grain refinement requires an understanding of the effective grain size that actually governs the mechanism of yielding or failure. Grain size has a measurable effect on most mechanical properties. At room temperature hardness, yield strength, tensile strength, fatigue strength and impact strength all increases with decreasing grain size. Machinability is also affected; rough machining favors coarse grain size while finish machining favors fine grain size. The effect of grain size is greatest on properties that are related to the early stages of deformation. Yield stress is more dependent on grain size than tensile strength. Fine-grain steels do not harden as deeply and have less tendency to crack than coarse-grain steels of similar analysis. There is also an equation expressing the relationship between grain size and yield strength.
5.3. Scan Electron Microscopy (SEM):
SEM scans a high-energy electron beam across the surface of a specimen and measures one of a number of signals resulting from the interaction between the beam and specimen.
| Hollow or mother tube 5K X | Hollow or mother tube 10K X |
| First pass 5K X | First pass 10K X |
| Second pass 5K X |
Second pass 10K X |
| Third Pass 5K X | Third pass 10K X |
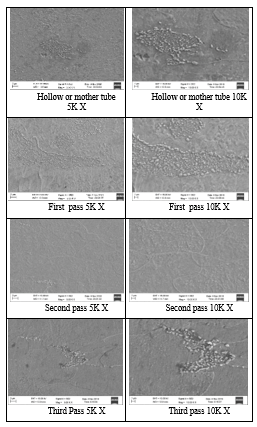 Figure 7 SEM images of all four samples
SEM microstructure shows elongated lamellar boundary structure and equiaxed grain structure. Microstructure reveals size of deformation microstructure gradually increases with increase in pass schedule. The results indicate that slight coarsening of microstructure happens at initial stage due to recovery. Few more samples are tested for mechanical properties and the results are tabulated as shown in Table 12 and Figures 8-12.
| Pass | Tensile strength
(N/mm2) |
Hardness
(BHN) |
Percentage elongation
(%) |
Percentage reduction
(%) |
Young’s Modulus
( N/mm2) |
Yield strength
(N/mm2) |
| Mother tube | 415.226 | 129.66 | 22.80 | 59.23 | 393225 | 208.774 |
| First pass | 610.530 | 136 | 8.53 | 32.89 | 248678 | 568 |
| Second pass | 555.659 | 184.66 | 10.94 | 39.78 | 165781 | 547.206 |
| Third pass | 378.219 | 194 | 37.55 | 59.53 | 131342 | 203.035 |
Table 12 Results of samples
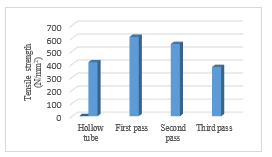 Figure 8 Tensile strength of four tube samples
Tensile strength is more in first pass sample. Greater plastic deformation induced by cold drawing introduces greater strain hardening.
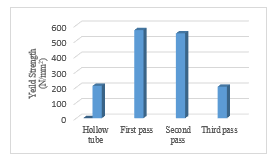 Figure 9 Yield strength of four tube samples
Yield strength is more in first pass sample as shown in Table 9.The reason is that plastic deformation occurs due to the motion of crystal lattice dislocations through the material. The result at large scales is work-hardening: as strain increases, stress needed to cause continued flow increases. Additionally, strain-to-failure decreases.
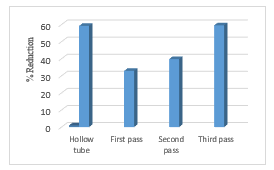 Figure 10 Percentage reduction of four tube samples
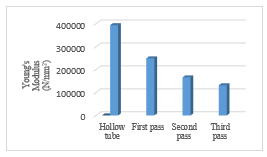 Figure 11 Young’s Modulus of four tube samples
Figure 11 shows that Young’s Modulus is found to be decreasing as the number of passes increases.
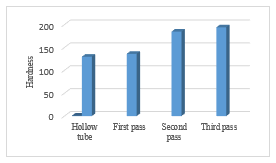 Figure 12 Hardness of four tube samples
From Figure 12, hardness is found highest in last sample due to large plastic deformation.
6. Conclusions
The influence of pass schedule on mechanical properties, microstructures and micro hardness of cold drawn seamless tubes were studied by preparing samples viz. mother or hollow, first pass, second pass and third pass. The results indicates that both mechanical properties and microstructures were altered during deformation. Based on the experimental results and discussions in the present work, following conclusions can be drawn:
- The mechanical properties of cold drawn seamless tubes are sensitive to pre-strain deformation, which was attributed to the reduction of boundary strengthening accompanied by the fragmentation of cementite lamellae which is introduced by pre-torsion.
- Plastic deformation during cold drawing not only result in the variation of the microhardness but also an inhomogeneous microstructure which is responsible for the difference in microhardness behavior between the surface layer and the center layer.
- Tensile strength, yield strength, hardness increases with plastic deformation.
- The mechanical properties can be altered by varying heat treatment schedule.
To measure effective Young’s Modulus degradation as a function of equivalent plastic strain which is for uniaxial stress case, tubes of various sizes were cold drawn with varying degree of cold working and plastic pre-strain. Further mechanical properties and Young’s Modulus were checked for those samples from varying degree of cold working and plastic pre-strain.
From the results of investigation on the effect of pass schedule on mechanical properties and microstructure of ST52 steel, the following conclusions can be made:
- Tensile strength, yield strength and hardness of ST 52 steel increased with plastic deformation. Maximum hardness is found 86-87 HRB in first pass .Maximum UTS is found in the same sample.
- Microstructure reveals ferrite + pearlite in all phases. Elongated grains observed with the increase in number of passes.SEM photographs also validated these observations with grain size evaluations.
- Micro hardness value is found maximum in final pass with value 162-165 and the grains are found highly stressed. Variation in mechanical properties (UTS, hardness) depends on % reduction in cold drawing. Also the heat treatment temperature and soaking time of stress relieving plays a vital role in determining the properties.
- Vickers hardness test may vary from surface to core. Increase in reduction sample will have high micro hardness on the surface as compared to the core. The micro hardness evaluation is phase specific. Ferrite will reveal lower hardness as compared to pearlite. Finally we can choose the processing path with varying % reduction and stress relieving temperature and soaking time to obtain the required mechanical properties as per specifications.
- Initial value of Young’s Modulus is anisotropic which depends on the material in plane direction and the percentage reduction during col drawing process.In addition to it, the variation of the Young’s Modulus during the deformation process is another important reason of usual underestimation of springback. It was found through this research that elastic Modulus of a material decreases by 10−20% during the plastic deformation reaching the saturation value after 5-7% of plastic strain.
- Karanjule,D.B.,Bhamare,S.S.,Rao,T.H.,“Variation of Elastic Modulus during cold drawing of seamless tubes and its influence on springback” in Proceedings of the 2016 IEEE IEEM, Bali, Indonesia on 4-6 December 2016 (pp.1025- 1029). https://doi.org/10.1109/IEEM.2016.7798033
- Lems,W.,“The change of Young’s Modulus after deformation at low temperature and its recovery”, Doctoral dissertation, TU Delft, Delft University of Technology.1963
- Vin,L.J.,Streppl,A.H.,and Singh,U.P.,“A process model for air bending”,Journal of Materials Processing Technology,56,48–54,1996.
- Eggertsen,P.A.,andMattiasson,K.,“On constitutive modeling for springback analysis”,International Journal of Mechanical Sciences,52(6),804-818,2010. https://doi.org/10.1016/j.ijmecsci.2010.01.008.
- Yoshida,F.,Uemori,T.,Fujiwara,K.,“Elastioplastic behavior of steel sheets under in-plane cyclic tension-compression at large strain”,International Journal of Plasticity,18,633–59,2002.https://doi.org/10.1016/S0749-6419(01)00049-3.
- Meinders,T.,Konter,A.W.A.,Meijers,S.E.,Atzema,E.H.,Kappert,H.,“A sensitivity analysis on the springback behaviour of the unconstrained bending problem”, Journal of Materials Processing Technology,9(3),365-402,2006.http://dx.doi.org/10.1063/1.2011232.
- Hu,Y.,and Du,C.,“Quasi static finite element algorithms for sheet metal stamping springback simulation”,Proceedings of NUMISHEET ,99,71-76,1999.
- Karafillis,A.P.and Boyce,M.C.,“Tooling and binder design for sheet metal forming processes compensating springback error”, International Journal of Machine Tools & Manufacture,36(4),503–526,1996.https://doi.org/10.1016/0890-6955(95)00023-2.
- Zhang,Z.T., and Hu,S.J.,“Stress and residual stress distributions in plane strain bending”,International Journal of Mechanical Sciences,40(6),533–543,1998.https://doi.org/10.1016/S0020-7403(97)00075-1
- Li K.P., Carden W.P., and Wagoner R.H.,“Simulation of springback”,International Journal of Mechanical Sciences,44(1),103–122,2002.https://doi.org/10.1016/S0020-7403(01)00083-2.
- Meinders,T.,Konter,A.W.A.,Meijers,S.E.,Atzema,E.H.,and Kappert,H.,“A sensitivity analysis on the springback behavior of the unconstrained bending problem”, International Journal of FormingProcesses,9(3),365-402,2006.http://dx.doi.org/10.1063/1.2011232.
- Papeleux,L.,and Ponthot,J.,“Finite element simulation of springback in tube drawing”,Journal of Materials Processing Technology,125-126,785–791,2002.https://doi.org/10.1016/S0924-0136(02)00393-X.
- Joannic D., and Gelin, J.C.,“Shape defects in tube making operations after springback”,The 4th Inter- national Conference and Workshop on Numerical Simulation of 3D tube making Processes,29-34, Besancon, France,1999.
- Gunnarsson,L.,and Schedin,E.,“Improving the properties of exterior body panels in automobiles using variable blank holder force”,Journal of Materials Processing Technology,114(2),168–173, 2001. https://doi.org/10.1016/S0924-0136(01)00727-0.
- Jatczak Chester F.,“Retained austenite and its measurement by X-ray diffraction” In:SAE800426, 1657–75,1980.doi.:10.4271/800426.
- Yu,H.Y.,“Variation of Elastic Modulus during plastic deformation and its influence on springback”,Materials and Design,30,846-850,2009.https://doi.org/10.1016/j.matdes.2008.05.064.
- Abdel-Karim, M.,“Effect of Elastic Modulus variation during plastic deformation on uniaxial and multi axial ratchetting simulations”,European Journal of mechanics-A/Solids,30,11-21, 2011. https://doi.org/10.1016/j.euromechsol.2010.08.002.
- Chongthairungruang, B., Uthaisangsuk, V., Suranuntchai, S.,and Jirathearanat, S.,(2012),“Experimental and numerical investigation of springback effect for advanced high strength dual phase steel”,Materials and Design,39,318-328,2012.https://doi.org/10.1016/j.matdes.2012.02.055.
- Morestin, F.,and Boivin, M.,(1996),“On the necessity of taking into account the variation in Young’s Modulus with plastic strain in elastic–plastic software”,Nuclear Engineering and Design,162,107–116, 1996. https://doi.org/10.1016/0029-5493(95)001123-4.
- Cleveland,R.,and Ghosh,A.,(2002),“Inelastic effects on springback in metals”, International Journal of Plasticity,18,769-785, 2002. https://doi.org/10.1016/S0749-6419(01)00054-7.
No related articles were found.