Three-Dimensional EEG Signal Tracking for Reproducible Monitoring of Self-Contemplating Imagination
 , Deepa Gupta 1, Abenezer Wudenhe 1, Xiaoming Du 2, L. Elliot Hong 2, Fow-Sen Choa 1
Adv. Sci. Technol. Eng. Syst. J. 2(3), 1634–1646 (2017);
 DOI: 10.25046/aj0203203
Electroencephalography (EEG) can globally monitor neural activity in millisecond scale, which is critical for identifying causality of human brain functions and mechanisms. However, to obtain accurate EEG stimulation-response relationship one usually needs to repeat multiple-ten times of stimulation-response recording to average out background signals of other irreverent brain activities, making real-time monitoring difficult to be accomplished. In this study, we explored new approaches which don’t require repeats. EEG signals were recorded from subjects doing mind tasks including image formation of motor functions or emotional subjects and mathematical calculations in mind. Time stamps in EEG recording were used to mark task completion time. Signals within 300ms or 1,000ms before task completions were analyzed. Using sLoreta 3-D tracking we found that delta-wave activities were mostly located at frontal lobe or visual cortex, isolated with each other. Theta-wave activity tended to rotate around cortex with low spatial correlation. Beta-wave behaved like inquiry types of oscillations between any two regions across cortex and was consistently correlated with each other over different areas. Alpha-wave activity looked like mixture of theta and beta activities. Together with sliding window dynamic connectivity method we confirmed beta waves play key roles in linking different brain areas together for information inquiry. Theta and low Alpha are more likely playing the role of information control, integration, and image formation. With the proposed new method we demonstrated reproducible linkages of subject behaviors with 3-D tracing characteristics along the 3 categories: emotion, math calculation, and motor functions without using event repeats.
1. Introduction
Earlier studies have shown that EEG signals may play important roles in controlling and initiating brain functions and activities [3, 4]. For example, attention usually requires a high beta wave to synchronize brain oscillators at different locations and alpha wave is used to decouple or disengage attention [4]. Furthermore, brain reticular formation area in the brainstem has been considered where consciousness and attention control initiated [5]. Considering if these descriptions are all correct, we shall likely observe some EEG signals initiated from the brain stem region when monitoring 3-D EEG signal traces.This paper is a full version of 2016 IEEE Signal Processing in Medicine and Biology Symposium (Wudenhe, Meng and Choa 2016) conference abstract. Electroencephalography (EEG) is one of the most important neural imaging modalities used for monitoring brain activities [1]. Its ability to achieve millisecond scale time resolution is critical for obtaining causal relationship. However, due to the dynamic nature of brain electrical activity, the same stimuli may generate different responses under different psychological setting. Interpreting EEG signals, extracting EEG biomarkers and correlating them to behaviors have always been challenging since the technique was discovered. Event related potential (ERP) technique has been one of the successful methods that is used to obtain reproducible brain responses to stimuli. However, ERP signals are intrinsically weak and are typically buried under signals produced by other brain activities. To extract ERP signal, one needs to average over many repeats to distinguish it from noises and background signals produced by other brain activities [2]. Furthermore, brain states are high dimensional and complex. Multiple origins or sources can recruit neural activities from different paths and influence the same behavior outcome. That puts serious restrictions on ERP experiment designs and applications for studying event based brain dynamics and causal relationship. So, even though ERP is a useful tool, its ability to study brain dynamics and applications coverage are limited. To eliminate the need of experimental repeats, in this work, we developed EEG 3-D signal tracking methods to monitor brain dynamics without event repeat. We also verify obtained results with EEG based functional connectivity and statistical studies as described in detail in the following.
To investigate brain activities in deep brain region, the sources of EEG signals need to be localized by solving inverse problems. Various techniques have been proposed, such as Low-Resolution Electromagnetic Tomography (LORETA) [6], Variable Resolution Electromagnetic Tomography (VARETA) [7], Brain Electrical Source Analysis (BESA) [8], to establish procedures for source localization. However, most of these programs cannot guarantee unique solution and are not able to accurately localize the EEG sources. One exception is the standardized LORETA (sLORETA) method, which improves the source localization accuracy by reducing spatial resolution. Pascaual-Marqui reviewed different methods of EEG localization [9], in which compared multiple mathematical models and concluded that extending the good localization properties of 2D minimum norm solution to 3D solution spaces with LORETA was the greatest challenge in the development of EEG source localization but was achieved with LORETA. With the help of LORETA, Herrmann and his colleagues investigated error processing of 39 subjects engaging the Eriksen flanker task and found significantly higher brain electrical activity in medical prefrontal areas for incorrect responses and both positive and negative error related components represented different aspects of error processing [10]. An earlier study from Mientus aimed to address whether LORETA was able to detect hypofrontality in schizophrenic patients by recording resting status EEG signals from patients and normal subjects [11]. For comparison, subjects with schizotypal personality and depressive patients were also investigated. Significant increase of delta wave activity was detected in the patients over the entire cortex, while both schizotypal subjects and depressive patients showed much less delta, theta and beta activities in the anterior cingulum. Their conclusions obtained from LORETA analysis are largely consistent with findings from related literatures. Saletu’s group reported application of LORETA in diagnosis and pharmacotherapy of depression [12], in which LORETA identifies cerebral generators responsible for the pathogenesis of depression and for the mode of action of antidepressants. LORETA was also used to verify the hypothesis that the highest temporal correlations between 3D EEG current source densities corresponds to anatomical Modules of high synaptic connectivity [13]. These researchers demonstrated that EEG temporal correlations between different brain areas were related to synaptic density as measured by diffusion spectral imaging.
In this study, we apply sLORETA techniques to obtain 3D EEG map, trace them in time and associate these traces with their corresponding behaviors. Since many of these vector traces are long jumps across over large brain regions in a very short period of time, the method provides a big picture about brain dynamics with the understanding that sLORETA has its limitation on spatial-resolution. The proposed method is a much simpler approach to monitor brain dynamics and function mechanism in the sense that no complex experimental arrangement for event repeats are required. It opens the door for real-time monitoring of brain natural responses under any desired psychological setting without worrying about sensory gating effects and how to experimentally set up event-repeats [14].
To verify our conclusions from the monitoring results we have also implemented EEG based sliding-window functional connectivity analysis. We use the technique to obtain correlation statistics and its implications are consistent with 3-D tracing monitoring results.
Correlation between two brain regions is studied by segmenting EEG data followed by calculating correlation coefficients between two electrode channels. Such schemes basically involve breaking down the EEG data into segments followed by extracting features (such as correlation in this case) that are henceforth used to find patterns in the EEG activity [15, 16, 17]. The segmentation approach (as described further in the methods section) has recently adopted by function magnetic resonance imaging (fMRI) researchers to analyze brain dynamics in terms of functional connectivity when subjects are performing tasks [18, 19]. To the best of our knowledge, the combined segmentation and sliding window analysis has not been done with EEG analysis. We describe the implementation methods and experiment details in section 2, report their results in section 3, and finally conclude our studies in section 4.
2. Methods and Experiments
In this section we first describe our experiment design and arrangement and then the methods used to analyze the recorded data with sLORETA and sliding window techniques.
2.1. Experimental setup and design
A 16-channel EEG system was used in this study for EEG signal recording. Figure 1 illustrates the channel locations on cortex map and A1 and A2 are the reference channels on the left and right side brain, respectively. Six subjects participated this study (4 males and 2 females, all aged between 18 and 30). We designed experiments to obtain EEG recordings when subjects were under the following tasks. Subjects were asked (a). to visualize images of some parts of their body, for example, the left and right hands and feet, nose, lips, etc; (b). to form images in their mind of faces of people they love most or they hate most; (c). to perform simple mathematical calculations in their mind (like 15 multiplies 18 or 23 plus 38). When images or calculation results were formed in their mind, they time-marked the moment by finger touching a static electrode at hand which provided an electrical pulse to the EEG recording as a time marker as shown in the bottom tract in Figure 2.
Through the mirror neuron system in human brain, the tasks we selected can activate 3 categories of brain activities: emotion, math calculation, and motor function without generating EEG artifacts like motor evoked potential (MEP) signals, …etc. [20]-[ 23].
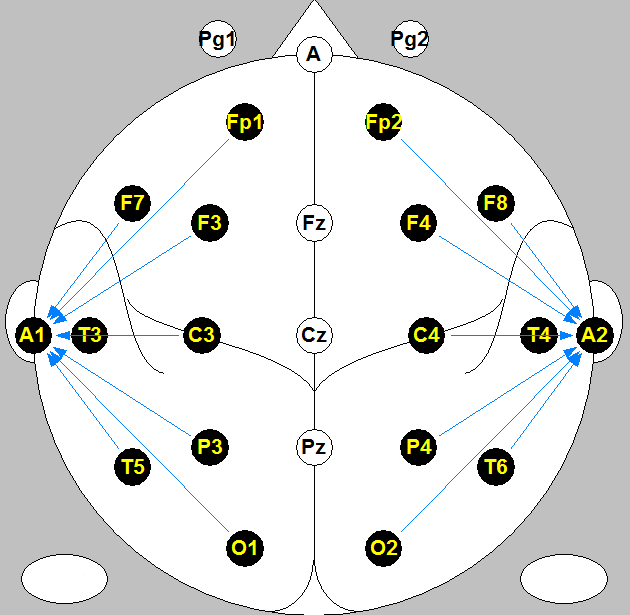 Figure: 1 16-channel EEG cortex and channel locations map
Raw EEG data was recorded by KT88, and then exported as BioSemi format for Matlab with EEGlab toolbox data processing followed by converting data into text files for sLORETA brain activity maps plotting [6]. Since the EEG system had a sampling rate of 100Hz, brain activity maps were recorded every 10ms.
2.2. Brain activity tracking by sLORETA
We processed EEG signals 300ms before the time marker since it takes that much time for human brain to process information and realize task accomplished or decision made. [24]. For example, to track dynamic trace of Delta activities during the 300ms, the filter in sLORETA was firstly set to 0-4Hz low-pass filter to extract delta waves. Then in the real-time EEG signal display in sLORETA, as shown in Figure 3, the cursor was located at the time point 300ms before the time marker (the starting point of the pulse generated in original EEG recording, for which the time was readable from KT88 EEG signals display). From this time point on, one Delta wave activity map was generated for every 10ms until the cursor reached the time marker itself. So during the analyzed 300ms, there was a series of 31 Delta wave activity maps. The same method was applied on Theta, Alpha and Beta waves by setting the filter in sLORETA to 4-8Hz, 8-13Hz and 13-30Hz, respectively.
For each sLORETA brain wave activity map, a corresponding focus point with the strongest brain activity was found (sLORETA provides this function). These focus points were connected and plotted in Matlab at a 10ms increments over the 300ms measured timespan recorded, and viewed considering both the X axis, showing left and right sides of the brain, Y axis, representing the front and back of the brain, and the Z axis representing the top and bottom of the brain. Axis distance range being set to -100 to 100 mm.
2.3. Sliding window analysis
We also analyzed functional connectivity between brain nodes (i.e. 16 EEG channels) during the above described mind imagination tasks by using the sliding window approach [18,19] for delta, theta, alpha and beta wave activity followed by standard deviation analysis as described below.
- First, EEG data of 1000ms before the marker onset indicating task completion was extracted. This data was filtered for delta, theta, alpha and beta wave followed by processing with ICA to identify components. (We take 1000ms data because the sliding window approach requires larger sample size for computing meaningful results).
- Then, data points within a time window of first 100ms for one of the wave activity were taken to calculate correlation among all pairs of electrodes for that one window. Next, the window was then shifted in time by 10ms of data points that overlaps between the successive windows. This resulted in 120 correlation values for each of the 91 windows as shown in Figure 4. Here, correlation between two electrodes is given by:
where,
= a time series data point from 1st electrode
= a time series data point from 2nd electrode
= mean of 1st electrode’s time series data
= mean of 2nd electrode’s time series data
= 10, 20, 30, … ,100ms
- Finally, we then computed standard deviation (σ) of these correlation values over the 91 windows for each pair of channels to analyze the fluctuation in their connectivity. Here, if is a matrix that contains correlation values over the 91 windows then the standard deviation is defined as:
where,
µ is the mean of and = 1,2,3,…,( = 91)
The above is done for all 120 pairs of correlated electrodes. Then, the maximum out of the 120 standard deviation values was extracted for narrowing down the analysis to most erratically correlated nodes. This was done for each wave and averaged over all experiment-tasks for that wave as plotted in Figure 5.
The above computation and analysis helps in quantification of the time-varying behavior in terms of functional connectivity and brain dynamics. From the best of our knowledge, the sliding window approach has recently adopted for fRMI data analysis to describe brain dynamics in slower scale compared with EEG signal analysis [18, 19]. Here we applied sliding-window techniques to EEG data analysis and extended the technique with maximum standard deviation analysis to help interpret EEG data. The standard deviation values indicate the degree of fluctuation that exists in the functional connectivity i.e. the correlation values. We compare the selected maximum standard deviation of all waves (Figure 5) as this enables us to test and see the correlation-consistency for each wave among their most fluctuated nodes that are erratically in and out of phase with each other. This is further discussed and analyzed in the results and discussion section.
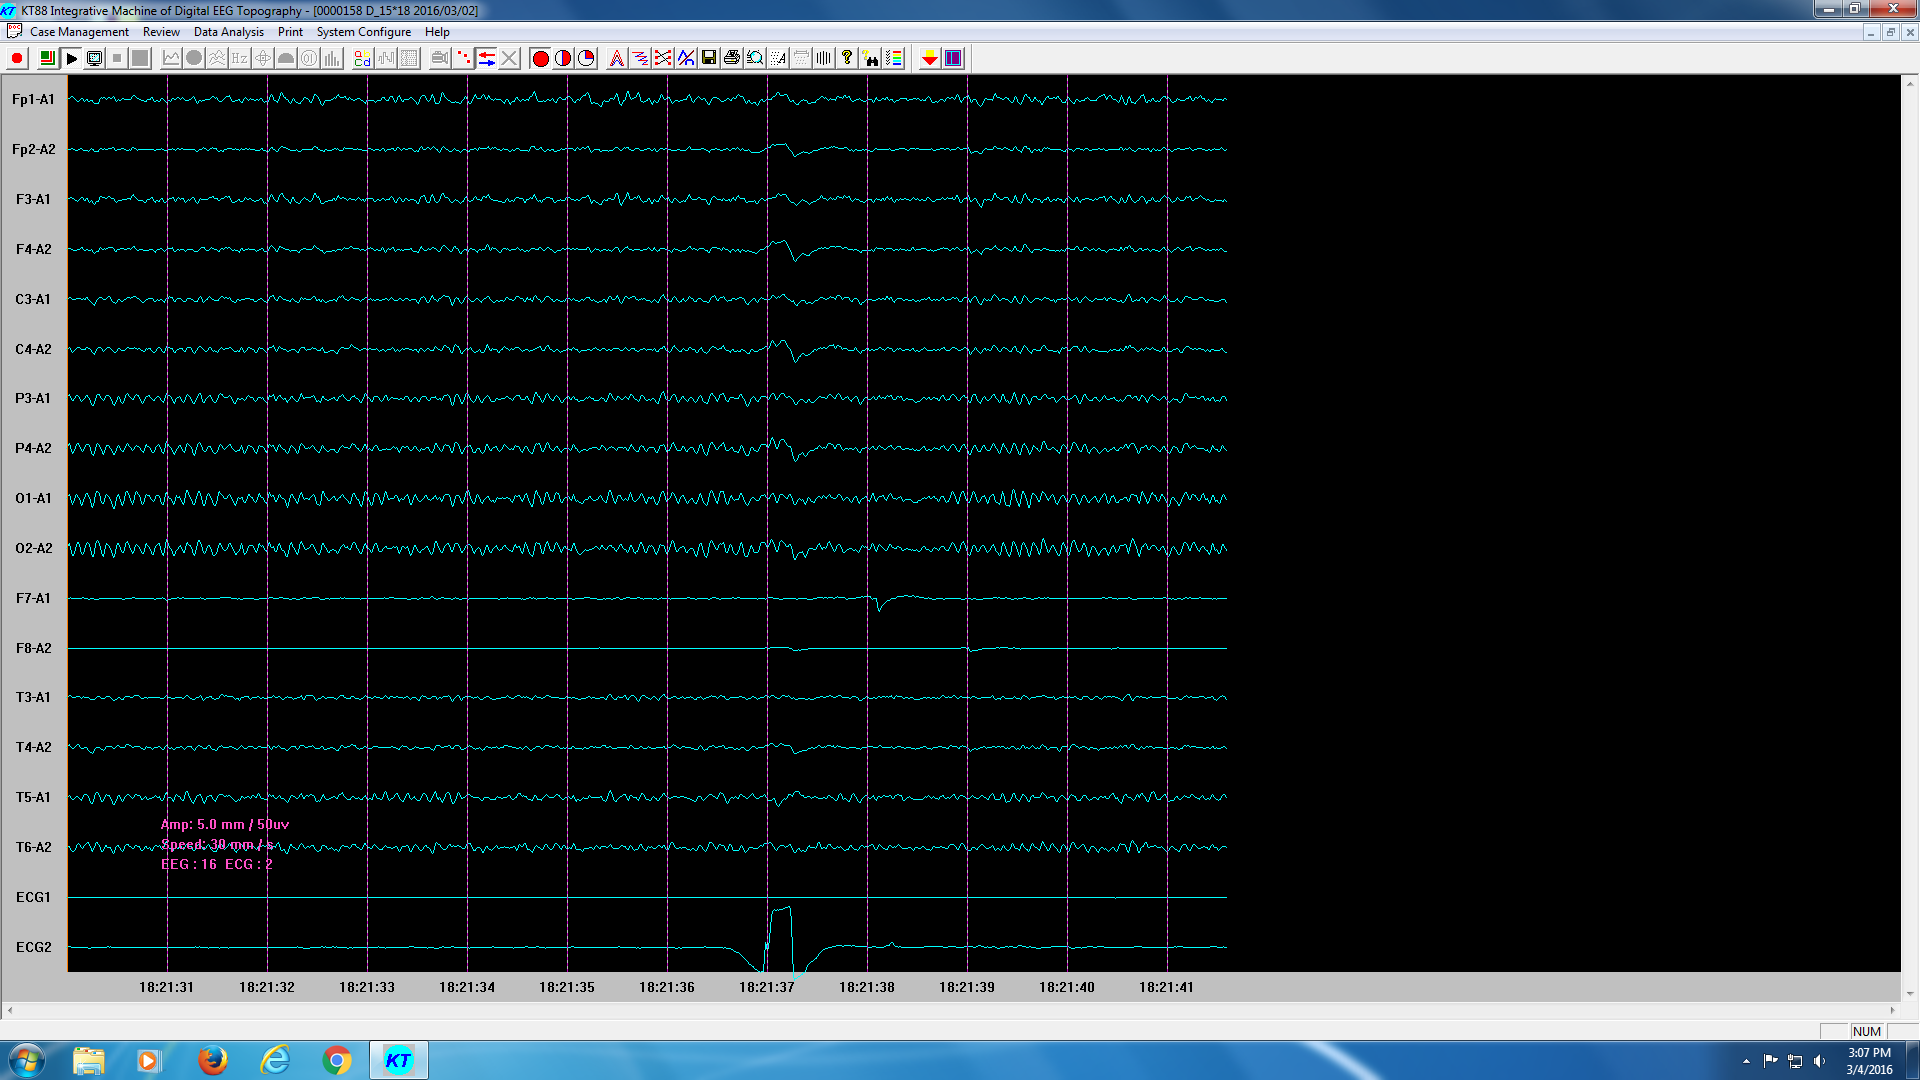 Figure 2: Example of real-time EEG signal on KT88 (The last channel was added to the EEG system as a time marker, once subjects touched the metal clip, a electrical pulse would be generated to mark the time point when images were formed in their mind.)
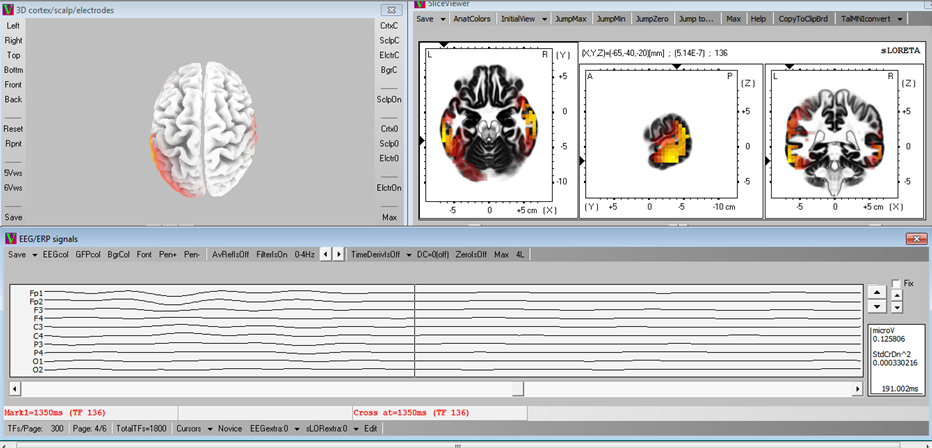 Figure 3: An example of sLORETA brain activity map (The waves under the 2D and 3D maps are EEG signal on time domain. A 0-4Hz low-pass filter was applied to analyze Delta rhythm. The maps are presenting Delta rhythm activities on the time point, where the cursor is located on the time domain signal. The 3D cortex map on the left-top corner can be rotated for different perspectives, and the 3 2D maps are the cross section views of xy, yz and zx planes in a 3D Cartesian coordinate system. They vary according to the positions of cuts, which are shown as the arrows along the x, y and z axis. By relocating these arrows, the brain activity inside the brain can be observed. Red regions represent relatively strong activities and yellow regions represent very strong activities.)
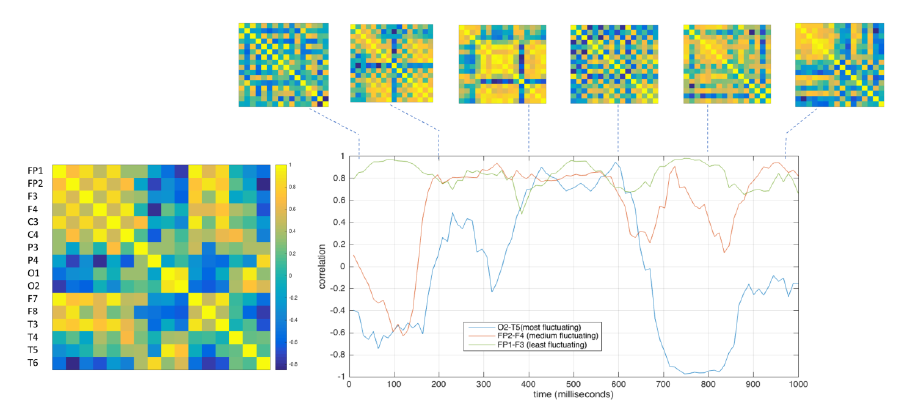 Figure 4: (left) Functional connectivity as correlation matrix between EEG channels from window of 100ms of EEG data. (right) Functional connectivity time series for connections between selected pairs of EEG channels based on maximum (O2-T5 pair in blue), medium (FP2-F4 pair in red) and least (FP1-F3 in green) deviation in their correlation values.
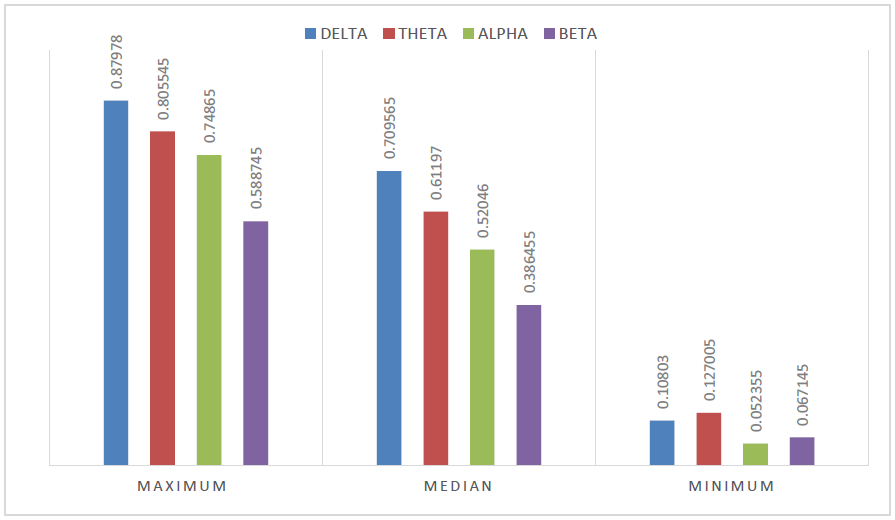 Figure 5: Mean standard deviation (σ) of correlation values that is obtained by the sliding window approach while the subject is performing imagination tasks. This is clustered as most (maximum σ), medium (median σ) and least (minimum σ) fluctuation in phase of the pair of EEG time series channels for each wave rhythm. Overall, correlation of EEG channels is the least fluctuating for Alpha and Beta wave in majority of the cases.
3. Results and Discussion
From cortex maps plotted by sLORETA we found that the Delta oscillations are not only the slowest in frequency, but also slowest in the shift or movement of activated regions within the 300ms before subjects realized image formations in their mind. For most of the time in the 300ms, Delta activities tend to arise at either frontal lobe or visual cortex. A sudden shift of activation between these regions would occur for most cases, and a duration of about 150ms to 180ms was observed between two shifts in the analyzed period. A group of plots in Figure 6 presents such Delta wave activities. We also found that the maximum and medium standard deviation of correlation (deduced from sliding window approach as described in the methods section) was highest for the delta wave. This indicates that the brain regions are not consistently correlated and less interactive with each other for the delta wave activity (Figure 5).
Cortex maps plotted by sLORETA also indicate that the Beta oscillation activities show up at frontal and visual cortex as well for most of the sampled time points, but the spatial shifts can be detected every 10ms as shown in Figure 7, which is much faster than that of the Delta oscillation. This is to say for one certain activity map in the 300ms sampled time series, the excited region is different from both 10ms before or after itself for Beta wave. Since the sampling rate of the EEG system is 100Hz, the Beta activity spatial shifts present a frequency of at least 50Hz,
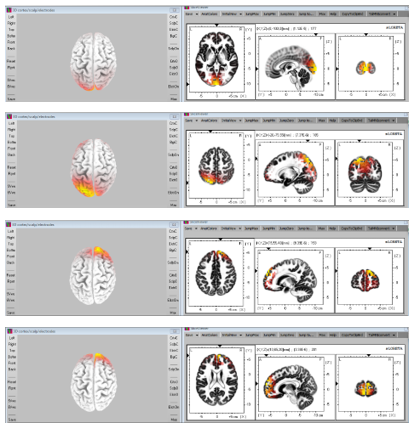 Figure 6: Delta rhythm activities (From upside to down side, the plots present Delta rhythm activities 240ms, 160ms, 80ms and 0ms before the subject realized the image formation.)
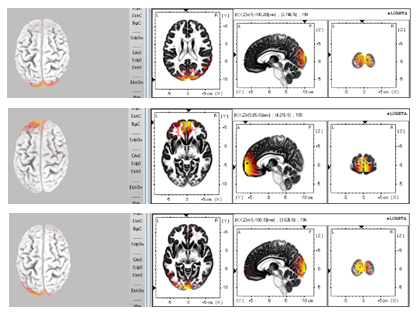 Figure 7: Performance of Beta rhythm activities (From upside to down side, the plots present Beta rhythm activities 80ms, 70ms, 60ms and 50ms before the subject realized the image formation.)
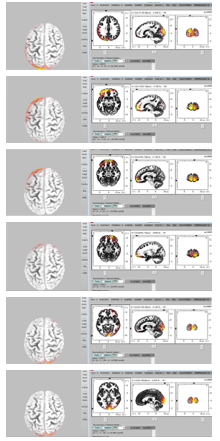 Figure 8: One cycle of Theta rhythm activity (From upside to down side, the plots present Theta rhythm activities 170ms, 160ms, 150ms, 140ms, 130ms and 120ms before the subject realized the image formation.)
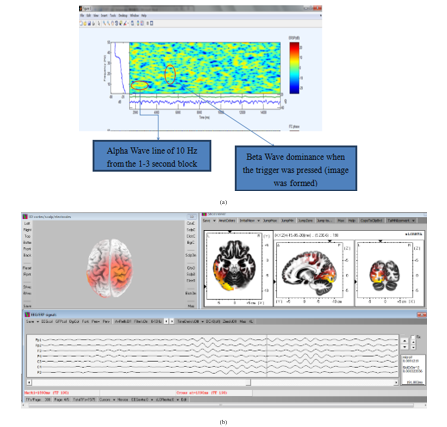 Figure 9: (a). Time-frequency plot of one entire dataset in EEGlab; (b). Mu waves show up on motor cortex during self-contemplating image formation.
which also indicates that the Beta activity’s spatial shift’s speed is at least 15 to 18 times faster than that of Delta oscillations. This signifies that the activated brain regions during Beta oscillations are relatively higher in interactivity with each other than that of Delta oscillations. The spatial shift of Beta and Delta oscillations observed from these sLORETA plots show back-and-forth tracking arrows between frontal lobe and visual cortex, which can also be regarded as certain communication between these two brain regions, more frequently for beta wave than that for delta wave activity. This gets further asserted by our standard deviation analysis of functional connectivity computed via sliding window approach as the maximum and medium (median) standard deviation is the lowest for beta wave activity among all other waves (Figure 5). Hence, mostly Beta wave activity related neuron oscillations are correlated in the most consistent manner than the other waves. This strongly suggests that beta wave activity is involved with locking neurons together thereby playing a critical utility role for information query.
To summarize, Delta wave has the highest deviation in correlation related to time evolved activity out of all other waves thereby indicating erratic or mostly in and out of phase activity between its activated brain regions whereas Beta wave activity, with least deviation, represents most consistently correlated activity. Considering the fact that all subjects were asked to generate various kinds of images in their mind, we can draw a conclusion that prefrontal lobe participate in the processing of image formation with visual cortex under both low frequencies (Delta oscillations, 0-4Hz) and Beta oscillations (13-30Hz) as seen from our sLORETA plots.
Cortex maps plotted by sLORETA indicate that Theta oscillations do not show a retention at the frontal lobe within the 300ms before the subjects generate images in their mind. However, a detectable annular movement trace can be observed, as displayed in Figure 8, which is transmitting along the edge of the cortex map from its top view. Considering the sampling rate, this trace with Theta wave was continuous during the processing of image formation unlike the sudden shifts of activated regions as seen with the Delta and Beta oscillations. This circulating movement of activated Theta rhythm’s regions would be either clockwise or counter clockwise. The cycle of annular movement varies for different subjects, as well as for different tasks of image formation for the same subject. For most datasets that we recorded from the six subjects, these cycles were between 60ms and 150ms long in duration.
Since all subjects were completing the tasks with their eyes closed while EEG signals were being recorded, Alpha waves dominated and presented a relatively higher intensity than other waves for most of the time, which can be finalized from the time-frequency plots of EEG signal on O1 channel (left side occipital region) in Figure 9(a). For some EEG datasets, the image formation in subjects’ mind also excites Mu waves, which share the same frequency range of Alpha rhythm, but are detected from the motor cortex, rather than occipital region. Figure 9(b) is an example of Mu waves on motor cortex. We believe that this domination of alpha wave and mu wave is also the reason why we see its correlation is overall consistent and not highly erratic (Figure 5). Due to the activity of Alpha waves and Mu waves, the mirror neural system must be suppressed by the corresponding executive network. A global view of Alpha rhythm activity during the analyzed 300ms presents an anomalous movement trace. However, compared with Theta and Beta rhythm, the performance characteristics of Alpha rhythm activity regions mostly falls in between them, which means that for some cases, an obvious annular movement trace along the cortex edge from a top view is observed; for the other cases, oscillations of brain activity under Alpha rhythm between frontal lobe and visual cortex are present; or even both phenomenon are detected in the same dataset at different time period.
On an overall level, we observe from connectivity analysis (Figure 5) that channel-pairs with consistent correlation, i.e. less varied correlation or minimum standard deviation in correlation, tend to remain least varied for the entire task for Alpha followed by Beta, Delta and then Theta oscillations. Whereas, for pairs of channels that are highly erratic in phase with each other, i.e. with maximum or medium standard deviation in correlation, tend to be least varied for Beta followed by Alpha, Theta and then Delta oscillations. The precise nature behind this pattern observation remains elusive. It was not clear why Alpha oscillation’s pair of nodes remain least varied for minimum standard deviation and not for maximum and median standard deviation group. Here, we quantified task-evoked correlation’s variation for each wave and we see that overall, Alpha and Beta oscillations tend to be at the lower end of variation for correlated pairs. We believe this could be for the following reason. Alpha wave is dominating as subject’s eyes were closed as seen from frequency plots in Figure 9(b) also and Beta wave appears to be involved with locking neurons and information query as described earlier in Figure 7.
Individual studies of Delta, Theta, Alpha and Beta oscillations during the 300ms period before subjects realized image formation in their mind demonstrate totally different performance of these rhythms. This also indicates that the rhythms provide different functions for the processing of self-contemplating image formation with its corresponding executive network. Self-contemplating image formation involves multiple brain regions’ activation, and these activations of brain is dynamic during the period from the formation in the mind to the time when subjects realize this image formation. The higher frequency the rhythm has, the higher the speed of spatial shifts, i.e. movement of activated brain regions, was observed.
Finally, for each EEG dataset, we generated 30 time progressive plots representing the 300ms time to trace the highest brain wave intensity positions. Figures 10 to 12 show accumulated traces of the 30 points in sequence. In Figure 10, the activity of forming an image of someone they love, which produced heavy activity towards the front cortex of the brain and some activity in the visual cortex. This persisted in multiple subjects with the Alpha brain wave. Alpha wave displayed both characteristics of wrapping around the brain, clockwise or counter clockwise motion and persisting activity in visual cortex and frontal lobe. With Figure 11, the subject is completing a simple mathematical calculation. Note that Beta wave moves at a much faster pace, seeing as it is at 13 – 30Hz. Beta displays characteristics of rapid movement between the frontal lobe and the visual cortex. The activity of a mathematical cognition does show a higher concentration in the frontal lobe. And we see a much more even distribution between the left and right brain with Beta wave, however, Alpha becomes more likely to favor the left or right side of the brain. Figure 12 displays a subject’s performance while thinking about some part of their body. The Theta wave, instead of confining towards a specific region of the brain, seems to have a wraparound pattern, either clockwise or counterclockwise. Other subjects also show a favoritism of the right side of the brain. Delta wave moved at a much slower pace, as we had anticipated since it is defined between 0 – 4Hz, concentrating a majority of its time by moving between the frontal lobe, further towards the positive Y axis, and the visual cortex, further back towards the negative Y axis. However, it travels at around 45 degree angle to the X and Y axis. The above described brainwave activity characteristics reproducibly happened to every subject under test.
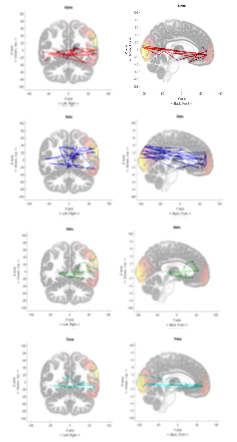 Figure 10: Performance of Alpha, Beta, Delta, and Theta wave across the brain while subject thought about the faces of the people that they loved.
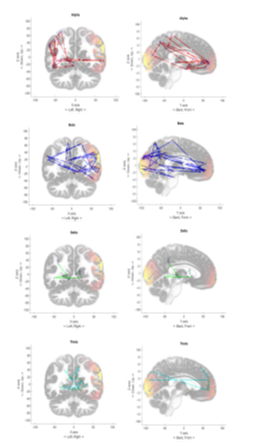 Figure 11: Performance of Alpha, Beta, Delta, and Theta wave across the brain finish some simple mathematical calculation, in this case 15*18.
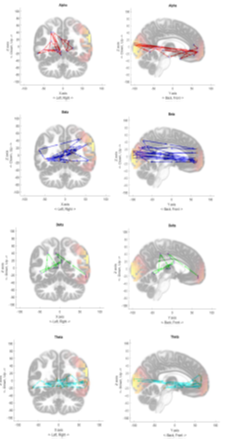 Figure 12: Performance of Alpha, Beta, Delta, and Theta wave across the brain while the subject thought about some parts of their body, in this case the left hand.
4. Conclusions
In this work we proposed a new method to monitor dynamic activities of brain functions at different frequency band without using averaging techniques like even repeats. In our example experiments, to associate subject behaviors with 3-D tracing characteristics, we found that each wave band had its own identifiable behavior that reproducibly generated notable characteristics along the 3 categories including emotion, math calculation, and motor functions. Our data analysis indicates that beta waves play key important roles in linking different brain areas together for information inquiry. Theta and low Alpha are more likely playing the role of information control, integration, and image formation. Conclusions derived from these tracing results were further confirmed with sliding window spatial correlation analysis.
- A. Wudenhe, Q. Meng, and F. S. Choa, “Three-dimensional eeg signal tracking for reproducible brain activity monitoring”. In Signal Processing in Medicine and Biology Symposium (SPMB), Philadelphia, USA, 2016.
- T. W. Picton, S. Bentin, P. Berg, E. Donchin, S. A. Hillyard, R. Johnson, G. A. Miller, W. Ritter, D. S. Ruchkin, M. D. Rugg and M. J. Taylor, “Guidelines for using human event-related potentials to study cognition: recording standards and publication criteria”. Psychophysiology, 37(2), pp.127-152, 2000.
- Q. Meng, F. S. Choa, E. Hong, Z. Wang, and M. Islam, “ Control channels in the brain and their influence on brain executive functions”. In SPIE Sensing Technology+ Applications (pp. 910716-910716). International Society for Optics and Photonics, Baltimore, USA, 2014.
- T. J. Buschman, E. L. Denovellis, C. Diogo, D. Bullock and E. K. Miller, “Synchronous oscillatory neural ensembles for rules in the prefrontal cortex”. Neuron, 76(4), pp.838-846, 2012.
- A. Damasio, Self comes to mind: Constructing the conscious brain, Vintage, 2010.
- R. D. Pascual-Marqui, “Standardized low-resolution brain electromagnetic tomography (sLORETA): technical details”. Methods Find Exp Clin Pharmacol, 24(Suppl D), pp.5-12, 2002.
- J. Bosch-Bayard, P. Valdes-Sosa, T. Virues-Alba, E. Aubert-Vazquez, E. R. John, T. Harmony, J. Riera-Diaz and N. Trujillo-Barreto, “3D statistical parametric mapping of EEG source spectra by means of variable resolution electromagnetic tomography (VARETA)”. Clinical Electroencephalography, 32(2), pp.47-61, 2001.
- W. Miltner, C. Braun, R. Johnson, G. V. Simpson, and D. S. Ruchkin, D.S, “A test of brain electrical source analysis (BESA): a simulation study”. Electroencephalography and clinical neurophysiology, 91(4), pp.295-310, 1994.
- R. D. Pascual-Marqui, “Review of methods for solving the EEG inverse problem”. International journal of bioelectromagnetism, 1(1), pp.75-86, 1999.
- M. J. Herrmann, J. Römmler, A. C. Ehlis, A. Heidrich, and A. J. Fallgatter, “Source localization (LORETA) of the error-related-negativity (ERN/Ne) and positivity (Pe)”. Cognitive brain research, 20(2), pp.294-299, 2004.
- S. Mientus, J. Gallinat, Y. Wuebben, R. D. Pascual-Marqui, C. Mulert, K. Frick, H. Dorn, W. M. Herrmann and G. Winterer, “Cortical hypoactivation during resting EEG in schizophrenics but not in depressives and schizotypal subjects as revealed by low resolution electromagnetic tomography (LORETA)”. Psychiatry Research: Neuroimaging, 116(1), pp.95-111, 2002.
- B. Saletu, P. Anderer and G. M. Saletu-Zyhlarz, “EEG topography and tomography (LORETA) in diagnosis and pharmacotherapy of depression”. Clinical EEG and neuroscience, 41(4), pp.203-210, 2010.
- R. W. Thatcher, D. M. North and C. J. Biver, “Diffusion spectral imaging modules correlate with EEG LORETA neuroimaging modules”. Human brain mapping, 33(5), pp.1062-1075, 2012.
- T. Rosburg, P. Trautner, C. E. Elger and M. Kurthen, “Attention effects on sensory gating—intracranial and scalp recordings”. Neuroimage, 48(3), pp.554-563, 2009.
- R. Agarwal, J. Gotman, D. Flanagan and B. Rosenblatt, “Automatic EEG analysis during long-term monitoring in the ICU”. Electroencephalography and clinical Neurophysiology, 107(1), pp.44-58, 1998.
- V. Krajča, S. Petránek, I. Patáková and A. Värri, “Automatic identification of significant graphoelements in multichannel EEG recordings by adaptive segmentation and fuzzy clustering”. International journal of bio-medical computing, 28(1-2), pp.71-89, 1991.
- D. Michael and J. Houchin, “Automatic EEG analysis: a segmentation procedure based on the autocorrelation function”. Electroencephalography and clinical neurophysiology, 46(2), pp.232-235, 1979.
- E. A. Allen, E. Damaraju, S. M. Plis, E. B. Erhardt, T. Eichele and V. D. Calhoun, “Tracking whole-brain connectivity dynamics in the resting state”. Cerebral cortex, 24(3), pp.663-676, 2014.
- R. M. Hutchison, T. Womelsdorf, E. A. Allen, P. A. Bandettini, V. D. Calhoun, M. Corbetta, S. Della Penna, J. H. Duyn, G. H. Glover, J. Gonzalez-Castillo and D. A. Handwerker, “Dynamic functional connectivity: promise, issues, and interpretations”. Neuroimage, 80, pp.360-378, 2013.
- V. Gallese, C. Keysers and G. Rizzolatti, “A unifying view of the basis of social cognition”. Trends in cognitive sciences, 8(9), pp.396-403, 2004.
- M. Lotze and U. Halsband, “Motor imagery”. Journal of Physiology-Paris, 99(4), pp.386-395, 2006.
- J. A. Pineda, “The functional significance of mu rhythms: translating “seeing” and “hearing” into “doing””. Brain Research Reviews, 50(1), pp.57-68, 2005.
- G. Rizzolatti and L. Craighero, “The mirror-neuron system”. Annu. Rev. Neurosci., 27, pp.169-192, 2004.
- N. Uchida, A. Kepecs and Z. F. Mainen, “Seeing at a glance, smelling in a whiff: rapid forms of perceptual decision making”. Nature reviews. Neuroscience, 7(6), p.485, 2006.