Emotional state recognition in speech signal

Adv. Sci. Technol. Eng. Syst. J. 2(3), 1654–1659 (2017);
 DOI: 10.25046/aj0203205
The matters regarding speech signal processing and analyzing in terms of emotional states recognition were presented in this paper. An experiment was conducted to perform both objective and subjective emotional states recognition tests for Polish language.
1. Introduction
The aim of the experiment was to test the effectiveness of fixed seven emotional states recognition. Tests were carried out with use of Polish language speech recordings from two acoustic databases. Samples consisted of professional actor and amateur speakers voice recordings. During studies, an objective, computer method was used composed of speech signal parameters extraction, selection of parameter vectors, and classification tests. The investigations were extended by carrying out subjective emotional state recognition tests performed by group of respondents. In various cases [1] emotional states investigations are implemented, e.g. in automated systems, analysing customer satisfaction level in telecommunication companies hotline systems. The experiments described in the paper should be regarded as pilot studies. However, their subsequent development could contribute to emergence of an automatic system, designed for Polish language, capable of recognizing emotions in speech signal.
2. Acoustic Databases Acquisition
Emotions are one of the most important elements of human life. We can define them as short and usually strong mental arousal induced under the influence of a particular stimulus, often leading to physical reaction. For example, a person in a state of anger, joy or fear usually responds by speaking louder, faster and with increased energy in the higher frequency band.
A popular way of classification is the division of emotions into basic and complex. Basic emotions are up to a dozen [2], and they result from the natural human reactions, while the complex states are to be their appropriate combinations. Despite the lack of consensus on a single set of basic emotions, there is one popular theory named “The big six” by Paul Ekman [3]. Accordingly, basic emotional states are: joy, anger, disgust, surprise, fear and sadness. They can be recognized from facial expressions, gestures and voice, even by people from different cultures, speaking different languages. The studies of emotional states in the speech, in some cases, use only 3 states [4]: positive, negative and neutral. However, due to its versatility and easy recognition “big six” was chosen for conducted experiment.
Emotional state databases contain 3 types of recordings:
- Spontaneous speech recordings.
- Forced emotional states recordings.
- Simulated emotions recordings.
Spontaneous speech databases include recordings of emotions induced in a natural way. To create this type of database usually recordings from multiple sources are used. These include conversations with emergency dispatchers [5], utterances of the participants of TV game shows, journalist relations from dramatic events and the interaction with a robot. Second type of databases include collections of enforced emotions recordings. Each emotional state in speakers voice needs to be induced. It is possible, e.g. through, presentation of movies or recordings stimulating appropriate emotions. Another, slightly more controversial method relies on putting speaker in a stressful situation. The advantage of this type of database is to obtain naturally excited emotions.
The result of this work was development of two acoustic databases (MD – amateur and TS – professional speaker). The structure of each was divided into training and testing sets. The first (MD) training set contained 543 recordings of women and 556 men. Test set consisted of 509 women recordings and 510 men. In total MD database was composed of 2118 recordings. TS base contained only one speaker recordings. Training and test sets consisted of adequately 219 and 243 recordings, in total – 462.
Table 1. Comparison of databases
| MD | TS | |
| Place of recordings | WUT recording studio | Amateur recording studio |
| Microphone | T-Bone SCT 700 – condenser | Shure SM 58 – dynamic |
| Mixer | Yamaha 03D | Behringer Eurorack mx – 802a |
| Sound Card | SoundMax Integrated Digital Audio | Sound Blaster Audigy 2 NX |
| Sampling frequency | 44.1 kHz | 44.1 kHz |
| Resolution | 16 bits | 24 bits |
| Language | Polish | Polish |
| Speakers | Amateurs – men and women | Professional actor |
| Speakers number | 6 male, 7 female | 1 male |
| Utterances | 10 sentences | 10 nearly identical sentences |
| Simulated emotions | 6 + neutral state | 6 + neutral state |
| Number of recordings | At least 1 | At least 6 |
Recording sessions for each database were carried out in different conditions as Table 1 shows. A set of 10 sentences was selected, and put in the following order (translations in brackets).
- Jutro pójdziemy do kina.
- (Tomorrow we are going to the cinema.)
- Musimy się spotkać.
- (We have to meet.)
- Najlepsze miejsca są już zajęte.
- (The best seats are already occupied.)
- Powinnaś zadzwonić wieczorem.
- (You should have called yesterday.)
- To na pewno się uda.
- (I am sure it will succeed.)
- Ona koniecznie chce wygrać.
- (She really wants to win.)
- Nie pij tyle kawy.
- (Do not drink that much coffee.)
- Zasuń za sobą krzesło.
- (Tuck in your chair.)
- Dlaczego on jeszcze nie wrócił.
- (Why has not he returned yet.)
- Niech się pan zastanowi.
- (Think about it, sir.)
Table 2. Phonems appearance frequencies in databases
| Phonem | Frequency [%] | Phonem | Frequency [%] | ||
| TS | MD | TS | MD | ||
| e | 11.67 | 12.43 | ʧ | 1.67 | 2.16 |
| a | 10 | 9.73 | d | 1.67 | 1.62 |
| o | 8.33 | 8.11 | l | 1.67 | 1.62 |
| n | 6.11 | 5.95 | w | 1.11 | 1.08 |
| j | 5.00 | 5.41 | g | 1.11 | 1.08 |
| v | 4.44 | 4.32 | ʦ | 1.11 | 1.08 |
| i | 3.89 | 3.78 | x | 1.11 | 1.08 |
| p | 3.89 | 3.78 | õ | 1.11 | 1.08 |
| u | 3.89 | 3.78 | b | 0.56 | 0.54 |
| ɲ | 3.89 | 3.78 | ʥ | 0.56 | 0.54 |
| t | 3.33 | 3.24 | c | 0.56 | 0.54 |
| s | 3.33 | 3.24 | ʣ | 0.56 | 0.54 |
| i | 2.78 | 2.70 | 0 | 0 | |
| m | 2.78 | 2.70 | ɳ | 0 | 0 |
| ɕ | 2.78 | 2.70 | Ɉ | 0 | 0 |
| z | 2.78 | 2.70 | ʤ | 0 | 0 |
| k | 2.22 | 2.16 | ʑ | 0 | 0 |
| r | 2.22 | 2.16 | f | 0 | 0 |
| ʨ | 2.22 | 2.16 | ȝ | 0 | 0 |
| ʃ | 1.67 | 2.16 | # | 0 | 0 |
Databases of simulated emotional states include recordings of either amateur or professional speakers. This type is the easiest to obtain and analyze. Recording conditions may be adjusted. The list of utterances, with suggested emotional states and number of repetitions are prepared before the recordings. Typically they contain recordings of single sentences, sometimes longer statements [5]. Usually, the content of spoken sentences is not emotionally characterized (e.g. interrogative sentences are rarely used, for possible suggestion of surprise). The biggest drawback is the difference between the natural and simulated emotions, which is impossible to determine. In addition an amateur speaker may simulate either expressively or faintly, which may also affect the results of subsequent analysis. There are many databases of simulated emotional states recorded in multiple languages e.g.. Spanish [6], German [7], Danish [8] or Polish [9].
3. Parameters and vector selection
Recognition of emotions in utterances requires parameterization of the speech signal. After parameters extraction investigated acoustic material is represented by a vector of extracted features. Unfortunately, there is no universal set of parameters allowing to achieve optimum subsequent analysis, therefore usually a large number of parameters is extracted, which then is used for determining the most representative sets of features – selection.
The following parameters were selected and extracted for further analysis:
- Pitch frequency,
- The first four formant frequencies,
- Intensity of the speech signal,
- LPC coefficients.
Parameters extraction was conducted with Praat and jAudio software. Parameters were characterized with values such as minimum, maximum, mean, median, standard deviation, range and mean absolute slope. Extracted features were exported to a text file and each sample was assigned to a specific emotional state. Parameters selection was conducted in Weka software [10] with usage of ChiSquaredAttributeEval algorithm.
4. Classification
As first trials showed algorithms using support vector machines [11-13] were the most effective, thus both SVC were selected to carry out the final tests. Table 3 presents the effectiveness of various algorithms used for database classification.
Most often training sets contain linearly inseperable data. In these situations algorithms that allow for the existence of components beyond the margin are used e.g. C-SVC. When forming the hyperplane, requirements reduction is determined with special value. Parameter C (cost) is responsible for the number of vectors inside the margin. Its value is determined experimentally in order to obtain maximum efficiency of classification process. Increasing the parameter C causes an effect similar to the linear classification. Small values allow to adjust the hyperplane to the training set.
Tests were performed for the seven cases of various TS (professional actor) and MD (amateur speakers) training and test sets combinations (Table 4).
The algorithm using -SVC classification is very similar to C-SVC. An additional parameter is coefficient with a value between <0; 1>. This parameter specifies the number of possible violations found in the case of linear classification and the number of support vectors. With increasing value the amount of vectors within the margin increases. When coefficient has a value of 0, linear classification is performed.
LibSVM library imported to Weka software enabled conducting classification processes with usage of support vector classifiers such as C-SVC and -SVC. During tests -SVC algorithm showed better effectiveness, thus further classification results were described only for this method.
Table 3. Recognition results for selected algorithms
Table 4. Test and training sets combinations
| No | Test set | Training set | Test symbol |
| 1 | MD | MD | MD>MD |
| 2 | TS | TS | TS>TS |
| 3 | MD | TS+MD | TS+MD>MD |
| 4 | TS | TS+MD | TS+MD>TS |
| 5 | MD | TS | TS>MD |
| 6 | TS | MD | MD>TS |
| 7 | TS+MD | TS+MD | TS+MD>TS+MD |
Table 5. Summary of selected parameters
5. Results presentation
Recognition efficiency results for each emotional state and all 7 test were presented in confusion matrixes, respectively Tables 6-12.
Conducted classification tests brought varied results. The lowest effectiveness was achieved for different database training and test set cases. In case of MD test and TS training set, overall effectiveness was 21.6%. Fear and surprise were recognized with the best score – above 40%. State of anger was recognized as fear 75 times out of 157 samples. The opposite situation (MD training, TS test set) improved results to 29.6%. Anger and neutral emotional states were recognized in 54.1 and 57.6% of cases.
Table 6. Confusion matrix (MD>MD)
| anger | neutral | joy | sadness | fear | disgust | surprise | Effectiveness [%] | |
| anger | 106 | 6 | 14 | 4 | 13 | 10 | 4 | 67.5 |
| neutral | 2 | 103 | 1 | 24 | 1 | 23 | 1 | 66.5 |
| joy | 15 | 8 | 91 | 0 | 10 | 12 | 11 | 61.9 |
| sadness | 1 | 26 | 3 | 99 | 2 | 18 | 0 | 66.4 |
| fear | 11 | 2 | 14 | 8 | 77 | 8 | 7 | 60.6 |
| disgust | 10 | 9 | 7 | 27 | 5 | 81 | 5 | 56.3 |
| surprise | 7 | 5 | 5 | 5 | 12 | 7 | 99 | 70.7 |
Table 7. Confusion matrix (TS>TS)
| anger | neutral | joy | sadness | fear | disgust | surprise | Effectiveness [%] | |
| anger | 33 | 0 | 3 | 0 | 1 | 0 | 0 | 89.2 |
| neutral | 0 | 28 | 0 | 0 | 2 | 2 | 1 | 84.8 |
| joy | 6 | 0 | 26 | 0 | 1 | 0 | 2 | 74.3 |
| sadness | 0 | 0 | 0 | 27 | 3 | 4 | 2 | 75.0 |
| fear | 2 | 0 | 3 | 0 | 24 | 4 | 0 | 72.7 |
| disgust | 0 | 1 | 4 | 2 | 1 | 23 | 3 | 67.6 |
| surprise | 2 | 1 | 4 | 0 | 3 | 3 | 22 | 62.9 |
Table 8. Confusion matrix (TS+MD>MD)
| anger | neutral | joy | sadness | fear | disgust | surprise | Effectiveness [%] | |
| anger | 116 | 3 | 13 | 1 | 9 | 9 | 6 | 73,9 |
| neutral | 1 | 84 | 6 | 20 | 2 | 42 | 0 | 54,2 |
| joy | 16 | 5 | 95 | 0 | 9 | 12 | 10 | 64,6 |
| sadness | 3 | 23 | 4 | 84 | 1 | 30 | 4 | 56,4 |
| fear | 11 | 2 | 21 | 3 | 77 | 4 | 9 | 60,6 |
| disgust | 13 | 6 | 12 | 15 | 1 | 87 | 10 | 60,4 |
| surprise | 8 | 3 | 8 | 5 | 10 | 8 | 98 | 70 |
Table 9. Confusion matrix (TS+MD>TS)
| anger | neutral | joy | sadness | fear | disgust | surprise | Effectiveness [%] | |
| anger | 27 | 0 | 8 | 0 | 2 | 0 | 0 | 73.0 |
| neutral | 1 | 27 | 3 | 2 | 0 | 0 | 0 | 81.8 |
| joy | 10 | 0 | 16 | 0 | 6 | 0 | 3 | 45.7 |
| sadness | 0 | 17 | 1 | 12 | 0 | 2 | 4 | 33.3 |
| fear | 6 | 5 | 7 | 6 | 6 | 3 | 0 | 18.2 |
| disgust | 1 | 12 | 11 | 2 | 1 | 3 | 4 | 8.8 |
| surprise | 1 | 3 | 5 | 4 | 4 | 3 | 15 | 42.9 |
Table 10. Confusion matrix (TS>MD)
| anger | neutral | joy | sadness | fear | disgust | surprise | Effectiveness [%] | |
| anger | 9 | 0 | 41 | 0 | 75 | 10 | 22 | 5.7 |
| neutral | 0 | 1 | 1 | 29 | 48 | 36 | 40 | 6.0 |
| joy | 13 | 2 | 38 | 1 | 37 | 26 | 30 | 25.9 |
| sadness | 0 | 2 | 14 | 36 | 23 | 19 | 55 | 24.2 |
| fear | 11 | 0 | 34 | 5 | 56 | 5 | 16 | 44.1 |
| disgust | 5 | 1 | 17 | 31 | 43 | 19 | 28 | 13.2 |
| surprise | 4 | 0 | 37 | 1 | 31 | 6 | 61 | 43.6 |
Maximum efficiency results as expected, were achieved while using training and test sets from the same databases. In case of MD database overall performance was 64.4%. The best result for single state concerned surprise – 70.7%, the worst one, disgust 56.3%. In the classification conducted on sets from the database TS total effectiveness of 75.3% was obtained. Most likely this was a result of single person recordings within database – professional actor using similar expression of emotions in each repeated sentence. All the emotions were identified with efficiency higher than 60%, achieving the best results for anger – 89.2% and neutral state – 84.8%.
Important tests were also carried out for combined training sets of both databases (TS+MD). The conducted classifications highest score (62,9%) was obtained for the test set derived from the MD database. The lowest result was (49,6%) observed in case of TS database test set. Anger state recognition results in both cases were very similar, whereas in case of neutral state for TS derived test set was higher by nearly 30%. The rest of the emotional states were recognized with greater efficiency when testing MD derived set. It should be noted that the recognition results for TS test set in case of single emotional states were varied – the respective values ranged between 8.8 and 81.8%. An experiment was also conducted on combined collection of training and test sets of both databases. The overall result was 57.4%. The results for individual emotional states recognition were similar to the ones obtained when testing MD database itself, most likely due to the impact of large number of samples from the MD database. They were not strongly diversified and the results for all emotional states exceeded 50%. Adding TS training set deteriorated 4 emotional states recognition effectiveness by approximately 10%, leaving the rest with similar results.
Table 11. Confusion matrix (MD>TS)
| anger | neutral | joy | sadness | fear | disgust | surprise | Effectiveness [%] | |
| anger | 20 | 1 | 7 | 0 | 7 | 0 | 2 | 54.1 |
| neutral | 2 | 19 | 1 | 9 | 0 | 2 | 0 | 57.6 |
| joy | 13 | 0 | 6 | 0 | 7 | 0 | 9 | 17.1 |
| sadness | 0 | 19 | 0 | 10 | 0 | 4 | 3 | 27.8 |
| fear | 8 | 4 | 5 | 1 | 2 | 13 | 0 | 6.1 |
| disgust | 3 | 14 | 9 | 2 | 0 | 2 | 4 | 5.9 |
| surprise | 3 | 1 | 5 | 6 | 4 | 3 | 13 | 37.1 |
Table 12. Confusion matrix (TS+MD>TS+MD)
| anger | neutral | joy | sadness | fear | disgust | surprise | Effectiveness [%] | |
| anger | 122 | 3 | 39 | 2 | 12 | 11 | 5 | 62.9 |
| neutral | 2 | 99 | 10 | 27 | 3 | 46 | 1 | 52.7 |
| joy | 21 | 5 | 116 | 0 | 16 | 13 | 11 | 63.7 |
| sadness | 5 | 25 | 9 | 107 | 1 | 35 | 3 | 57.8 |
| fear | 14 | 4 | 35 | 7 | 83 | 9 | 8 | 51.9 |
| disgust | 14 | 11 | 24 | 18 | 5 | 94 | 12 | 52.8 |
| surprise | 10 | 4 | 17 | 10 | 16 | 15 | 103 | 58.9 |
6. Empirical studies
Empirical studies were done in two stages. The first step involved preparing the appropriate test material from both acoustic databases. Step two involved empirical research and analysis of results.
The task of the person taking part in the experiment was to assign the proper emotional state to each sample. The selection was made from only seven states (6 basic and neutral one). Preliminary studies have shown that the test material meets the criteria of objectivity. After listening to each sound sample, the listener was supposed to determine what emotional content it was carrying. The listener answered by clicking on the appropriate emotional state button. If in doubt, the sample could be replayed. A picture representing questionnaire appearance was added below (Figure 1)
The first step was to determine the number of people to take part in the experiment so that the results could be representative. The selected group consisted of 10 people (2 female, 8 male participants). Age of group members varied between 26 and 32.
Survey was composed of two parts. The first one referred to recordings from the amateur speakers database. Table 13 presents the recognition effectiveness for each individual participant. It turns out that the accuracy of their emotional states recognition in given experiment ranged between 55 and 70 percent. These results could be the beginning of an interesting discussion connected with their interpretation. Psychological reasons were omitted in this article. They will be addressed during subsequent studies.
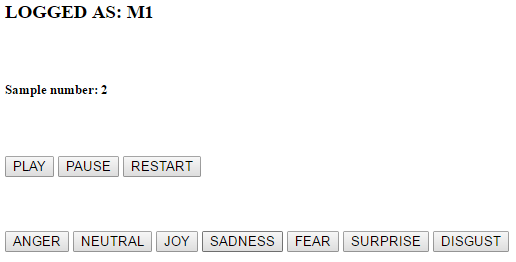 Figure 1. Questionnaire used in subjective tests
Table 13. Test participants results
| Number of samples | Participant ID | Right answers | Effectiveness [%] |
| 266 | 1 | 146 | 54,9 |
| 267 | 2 | 151 | 56,6 |
| 266 | 3 | 154 | 57,9 |
| 267 | 4 | 157 | 58,8 |
| 266 | 5 | 162 | 60,9 |
| 267 | 6 | 166 | 62,2 |
| 267 | 7 | 172 | 64,4 |
| 267 | 8 | 180 | 67,4 |
| 267 | 9 | 180 | 67,4 |
| 267 | 10 | 188 | 70,4 |
| In total | In total: | Average: | |
| 2667 | 1656 | 62,1 |
A confusion matrix was presented (Table 14), which also show the effectiveness of recognizing individual emotional states. The best recognized emotion for ameteur speakers among the participants was „surprise”, which reached almost 75 percent of the correct interpretations. The worst state to determine was “disgust”. This state was correctly identified in 40 percent of cases.
Table 14. Confusion matrix (amateurs)
| Amateur speakers database |
anger | neutral | joy | sadness | fear | disgust | surprise | Effectiveness [%] |
| anger | 236 | 39 | 14 | 8 | 14 | 38 | 10 | 65.7 |
| neutral | 5 | 257 | 3 | 62 | 7 | 32 | 1 | 70.0 |
| joy | 14 | 62 | 210 | 1 | 25 | 16 | 20 | 60.3 |
| sadness | 2 | 45 | 3 | 231 | 20 | 46 | 4 | 65.8 |
| fear | 18 | 33 | 13 | 27 | 176 | 28 | 26 | 54.8 |
| disgust | 22 | 77 | 2 | 71 | 11 | 149 | 40 | 40.0 |
| surprise | 8 | 5 | 10 | 5 | 30 | 28 | 253 | 74.6 |
In the second part of the survey, the respondents were presented with sound samples of professional actor voice (confusion matrix in Table 15). The best interpreted state was “anger” recognized correctly in all cases. The least effectiveness was achieved for fear, where efficiency was only 20%. In fact fear was even more times interpreted as anger which could indicate on quite specific, different actor expression.
Table 15. Confusion matrix (professional)
| Professional speakers database |
anger | neutral | joy | sadness | fear | disgust | surprise | effectiveness [%] |
| anger | 29 | 0 | 0 | 0 | 0 | 0 | 0 | 100 |
| neutral | 1 | 28 | 0 | 0 | 0 | 1 | 0 | 93,3 |
| joy | 1 | 1 | 29 | 0 | 0 | 0 | 0 | 93,5 |
| sadness | 2 | 8 | 0 | 12 | 2 | 6 | 0 | 40 |
| fear | 9 | 5 | 0 | 4 | 6 | 4 | 2 | 20 |
| disgust | 7 | 5 | 0 | 0 | 2 | 15 | 1 | 50 |
| surprise | 0 | 0 | 4 | 0 | 0 | 1 | 25 | 83,3 |
The differences in test results obtained from both parts of empirical studies seem to be quite obvious, given the various way of expression. Actor utterances could have been significantly different from the amateur’s in pace or dynamics of the voice. Another important fact is the use of only one speaker in comparison with 13 people (both genders) in amateur database. Table 16 shows the results of emotion recognition for each recorded speaker. Attention was drawn to the fact that some non-professional speakers have gained better interpretation results of their emotions.
Table 16. Speakers individual results
| Amateurs: | |||
| Speaker ID (M- Male, F-Female): |
Number of samples | Right answers | Effectiveness [%] |
| M4 | 198 | 96 | 48,5 |
| M7 | 171 | 89 | 52 |
| M5 | 207 | 108 | 52,2 |
| K6 | 201 | 113 | 56,2 |
| K4 | 117 | 67 | 57,3 |
| M2 | 203 | 120 | 59,1 |
| M1 | 150 | 89 | 59,3 |
| M6 | 206 | 123 | 59,7 |
| K5 | 210 | 139 | 66,2 |
| K3 | 186 | 125 | 67,2 |
| K1 | 188 | 129 | 68,6 |
| K2 | 209 | 145 | 69,4 |
| M3 | 211 | 169 | 80,1 |
| Professional: | |||
| M1 | 144 | 210 | 68,6 |
7. Empirical studies
The results obtained during the investigations both for empirical and computer methods are comparable, which could suggest that there is a possibility to create and further develop an effective automatic tool capable of recognizing emotions from speech signal. In experiment both amateur and professional speakers were used. The results show that unlikely to initial assumptions including professional speaker in investigations did not improve the recognition effectiveness – using his recordings in training sets in objective method gave good result in case of test set composed only of his own recordings. Additionally during empirical studies some amateur speakers were recognized with better effectiveness.
- L. Vidrascu, L. Devillers., Detection of real-life emotions in call centers. in Proc. Eurospeech 2005, Lizbona, 2005.
- Cowie R., Describing the Emotional States Expressed in Speech. In Proceedings of the ISCA, Belfast, 2000, pp. 11-18.
- Ekman P.: Emotion in the human face. Pergamon Press, 1972.
- Rong J., Chen Y. P., Chowdhury M., Li G., Acoustic Features Extraction for Emotion Recognition. Computer and Information Science, 2007. ICIS 2007. 6th IEEE/ACIS International Conference, 11-13 July 2007, pp. 419-424.
- Ambruš D., Collecting and Recording of an Emotional Speech Database. Technical Report, Faculty of Electrical Engineering and Computer Science, Institute of Electronics, University of Maribor.
- Montero J. M., Gutierrez-Arriola J., Colas J., Enriquez E., Pardo J. M., Analysis and modeling of emotional speech in Spanish. In Proc. ICPhS’99, pp. 957 – 960, San Francisco 1999.
- Burkhardt F., Paeschke A., Rolfes M., Sendlmeier W., Weiss B., A Database of German Emotional Speech. Proc. Interspeech 2005.
- Engberg I. S., Hansen A. V., Documentation of the Danish Emotional Speech Database. Internal AAU report, Center for Person Kommunikation, Department of Communication Technology, Institute of Electronic Systems, Aalborg University, Denmark, September 1996.
- J. Cichosz, K. Ślot, Low-Dimensional Feature Space Derivation for Emotion Recognition. ICSES 2006, Łódź, 2006.
- Witten I. H., Frank E., Data Mining: Practical machine learning tools and techniques. 2nd Edition, Morgan Kaufmann, San Francisco, 2005.
- Vapnik V. N., Statistical Learning Theory. Wiley, 1998.
- Kwon O., Chan K., Hao J., Lee T., Emotion Recognition by Speech Signals. Eurospeech, Geneva, Switzerland, Sep. 01-03, 2003.
- Zhou J., Wang G., Yang Y., Chen P., Speech emotion recognition based on rough set and SVM. Cognitive Informatics, 2006. ICCI 2006. 5th IEEE
- Cichosz J., Ślot K, Emotion Recognition in Speech Signal Using Emotion-extracting Binary Decision Trees. Affective Computing and Intelligent Interfaces – ACII 2007, Lisbon.
- Kang B., Han Ch., Lee S., Youn D., Lee Ch., Speaker Dependent Emotion Recognition Using Speech Signals. In Proc. ICSLP, 2000, pp. 383-386.
- Wang Y., Guan L, An Investigation of Speech-Based Human Emotion Recognition. Multimedia Signal Processing, 2004 IEEE 6th Workshop, 29 Sept.-1 Oct. 2004, pp. 15- 18.
- Kapala K., Krawczyk D. Brachmanski S., Tests of selected emotional states recognition., 20th. IEEE SPA Conference , Poznan, 2016.