The sector of telecommunications is experiencing a large growth and rapid change in developing applications due to the variety of technologies, to increase the number of users and to arrival services varied from the high demand of the service quality such as streaming, web navigation. In this regard, the 3rd Generation Partnership Project (3GPP) organization has greatly motivated to develop Next Generation Network (NGN). Indeed, telecom operators are forced to make a portfolio of available services more efficient to ensure customer loyalty. This article aims to propose an incorporation a layer above the quality of service (QoS) controller based on Fuzzy Logic to determine the guaranteed levels of QoS and levels of criticality. It describes a new approach of multi criticality in order to ensure the integrity in IP Multimedia Subsystem (IMS) networks. This approach is based on the recent model of integrity Totel. The proposed approach is tested and evaluated using Fuzzy Inference System to simulate levels of criticality for determining an adequate QoS level that ensures the customer’s needs. The simulation results describe the comparison between three membership function Triangle, Trapezoidal, Gaussian also describes the comparison between the methods of defuzzification to find whose gives better results and has more efficient in the aspect of chance value for levels of QoS and levels of criticality.
The sector of telecommunications is undergoing a profound and rapid change in developing applications due to convergence towards Telecom, Internet, Multimedia and continual technological innovations. The IMS architecture towards all-IP domain supporting at all services voice, video and data. Thus, according to IMS network convergence, the issue of maximizing the resource use and the continuity of QoS and Quality of Experience (QoE) for satisfying the user’s requirements has gained importance to find success or failure of applications and services. This quality shows performance metrics in terms of perspectives for the service user. Indeed, the IMS architecture is composed of several entities types of session initiation protocol (SIP) servers to process SIP signaling packets of the IMS domain: Proxy Call Session Control Function (P-CSCF), Interrogating CSCF (I-CSCF), and Serving CSCF (S-CSCF).
Thus, IMS architecture also defined entities for QoS management, which are Policy Control Rule Function (PCRF) and Policy Charging Enforcement Function (PCEF). Although, due to the high-quality IMS services, it is not possible to guarantee a QoS for IMS services at anytime, anywhere due to the increase of user numbers and to their mobility.
This paper is an extension of work originally presented in conference on Intelligent Systems Theories and Applications (SITA) [1]. The goal of this article is to propose a policy of integrity implementation that allows a security policy integrated on IMS architecture. This integration is based on Totel model. Our contribution described a new approach for multi criticality on IMS architecture to ensure the integrity and to verify the exchange between different software entities. Furthermore, to dynamically find the level of criticality of customers for offering QoS appropriated to their needs by using Fuzzy Logic for decision-making according to multi criteria such as environment, equipment and the importance of customers. This approach is introduced by simulation using Matlab.
This paper is organized as follows. In section 2, we briefly review related work. We summarize basic standards and mechanisms, integrity models, Fuzzy Logic in Section 3. The proposed contribution and discussion architecture presented in Section 4. Section 5 concludes this paper, sums up and explains the next steps.
2. Related works And Motivation
2.1. Related works
Recently, the increase in mobile usage data and the new application emergence has greatly motivated the 3GPP organization for working on the IMS network. Various studies made to enhance the QoS in IMS networks [2, 3, 4, 5, 6, 7] due to the network convergence on account to several issues including security, mobility, and QoS management. Some works, focus on detecting problems of degradation of service. Others provide methods for QoS Management [2]. Basic mechanisms for management of QoS in the IMS are presented by 3GPP specification [8, 9]. The 3GPP approaches based on the phase of provisioning services by offering stable and dynamic solutions for the resources according to the type of service. The goal of this approach is to find the needs of each service in terms of QoS requirements. Although, these approaches focus on the phase of providing service, without taking into consideration the customer type, which influenced on the overload of network [10].
In paper [11], the authors propose a technique of causal map for monitoring the resources to identify the fault cause via the technique of map causal [11]. The aims of this solution is to detect a failure by identifying the probable cause. This approach allows monitoring resources and not services flows [5].
The paper [13], propose a platform SLM&M (service Level Management & Monitoring) for services monitoring, it is based on indicators collected directly over the network. However, before deducting the requirements provisioning service to users, these indicators are analyzed using thresholds defined in the Service Level Agreement (SLA) of each client. The aim of this solution is to detect only the degradations without including the corrective actions in real-time.
In paper [2], authors propose a new approach INQA (IMS Network QoS Architecture) that is presented at SLM&M platform to supervise and monitor a service in the real-time according to key performance (KPI) and quality indicators (KQI). The aim of this solution is to project enhanced Telecom Operation Map (eTOM) in the context of IMS network by integrating entities in a multi-technologies context using web technology; more particularly service oriented architecture SOA and simple object access protocol SOAP [12].
In [14], authors discuss three types of SLA, which are SLAs Customer, SLAs Supplier/Partner, and SLAs Interns. A service provider for offering products to the customer intends SLAs Customer. This type of SLA is generally subject to a formal contract between the customer and the service provider. SLAs Supplier/Partner are intended for suppliers who are designed to ensure whether performance targets met for the service components provided by a supplier and for derived from a partial or total contractual agreement between suppliers. An agreement for all customers using the services delivered by the service provider. SLAs Interns are designed primarily to target services and working resources. They are intended to service elements or groups of service elements and are described as the agreements between organizational functions within the business operators.
Paper [13], proposes the verification of SLA using eTOM process [15] for monitoring services. The aim of this verification is to identify the appropriated QoS, which is determined in the SLA contract from the information collected by the network entities. Four steps, structures this verification: Performance Indicators Collection [13], Mapping quality indicators, Comparison between quality indicators and SLA, and Report overall service and resource. In the performance indicators collection step, a key performance indicator KPIs is identified by Packet Loss (%), Delay (ms), and Bandwidth (kb/s). Unlike indicators of performance, quality indicators are correlated to the service, these indicators are MOS-V (Mean Opinion Scores Video) [16] and MOS-A (Mean Opinion Scores Audio) [17]. The following step is a comparison between quality indicators and SLA to verify the negotiation of SLA. Lastly, a report on the resource during service provisioning and its status are created for detecting the type of SLA execution.
2.2. Motivation
In IMS network, SLA execution takes two forms: Normal SLA Execution and SLA execution with a violation. The Normal SLA Execution detects the exceeded thresholds or failure of a component and the manager intervenes. However, the SLA execution with violation restores services and QoS operation of Video service on demand (VoD).
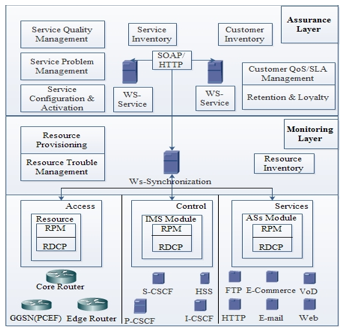
To enhance an SLA security policy and to control the exchange between different entities, the proposed approach is to integrate a layer called integrity verification communication in IMS architecture for applying integrity policy [1] in terms of criticality [1]. To achieve this goal, the Totel model of integrity is adopted to improve a new approach of multi criticality using multi-criteria for decision-making and to guarantee QoS needs according to the level of criticality of users. This proposition is integrated into INQA and SLM&M architecture as illustrated in Figure 1. It is composed of two layers: assurance and monitoring. The assurance layer is dedicated for verification process of SLA according to several entities of eTOM process. The monitoring layer is dedicated for supervising; it is composed of a set of functional processes for ordering services and other execution scenarios of a resource. It is divided into two parts: A distributed part that is a set of agents and probes that are able to recover all data in real-time. Moreover, a centralized part is dedicated to synchronization.
Figure 1: Architecture SLM&M and INQA [2]
3. Overview
An access control model intended to abstract the policy and handle its complexity, to verify the consistency of the security policy and detect possible conflicts. It is based on essential model and mechanisms, integrity policy, IMS, Fuzzy Logic, which will be outlined in this section.
3.1. Survey of integrity
Computer security in critical infrastructure is designed to control access and manipulate data by using the mechanisms of authentication, integrity, authorization, in order to protect a system against the vulnerabilities and failures. One basic element of security is integrity. It is a key for checking the trust change of data by using verification mechanisms such as integrity models. These models keep data safe and trustworthy by protecting system data from any intentional or accidental changes. For a long time in computer systems, this concept was used for three goals: to prohibit unauthorized users from making any changes to data or programs, to prohibit authorized users from making unauthorized modifications and finally to prevent internal and external consistency of data and programs [18]. Integrity models allow quantifying the integrity in term of credibility or criticality [19]. Credibility can be considered as an integrity fact, since it is defined as the character of something that can be believed, on what trust can be placed. The measure indicator of credibility is based on reliability, internal actions, and reputation. However, criticality is the characteristic of a system that does not tolerate failures and must secure its properties even through internal and external events. This sensitivity is related to system importance on the socio-economic development of a nation, and the grave consequences that could emerge from a service interruption caused by any inadvertence or malicious source [19].
3.2. Integrity Models
The models of integrity policy are:
The policy defined by Bell & Lapadula that addresses confidentiality of data systems. It is based on two properties: Simple Integrity (No read down) and Integrity* property (No Write up) [21]. For simple integrity property, the subject can only read objects at its own integrity level or above. On the other side the Integrity* property, the subject can only write objects at its own integrity level or below.
The Chinese Wall policies aim is to protect the financial system from illicit manipulation.It consists of three levels of abstraction object: Objects that contain information about only one company, Company data set (CD), and the conflict of interest (COI). CD is an object collection related to a certain company. COI is a class containing the data sets of competing companies [22].
The policy defined by Clark & Wilson is designed for commercial aims and focuses on data integrity preservation. Indeed, each data item can only change using a certified procedure, which keeps its integrity. Furthermore, it is dedicated to verifying data items and certify their integrity. This model can be interpreted as two integrity levels: data are classified into Unconstrained Data Items (UDI) and Constrained Data Items (CDI). This model defines two notions: the transactions and separation of duties. The first notion states that information may only be treated through Transformation Procedures (TPs) which support the involved data integrity. Additionally, integrity Verification Procedures (IVPs) can be verified modification integrity data. The system keeps lists of a relation between these entities which allowing UDIs into CDIs transformation according to TPs and IVPs [23]. Unlike Biba policy, two ways influenced the policy defined by Clark & Wilson: a data who gives integrity level should keep its integrity level only if it is manipulated by a procedure validated to at least the same level. Moreover, the information flow passage from a lower to the highest level is possible only if it is validated to certify that the data has a high integrity level.
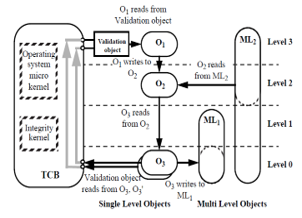
Totel model is based on the object-oriented approach. It aims to offer a usable and flexible generalization of the other models mentioned above for providing kinds for objects with defined properties. Figure 2 presents the software architecture proposed in Totel’s It is based on objects classification in order to give a strict information flow to check integrity policy and to manipulate the mechanisms of information integrity upgrade. Authors in [24, 25] defined three object types: Single Level Objects (SLOs): are single constant integrity level. This king contains information and creates flows using its internal data at different levels of integrity. Multi Level Objects (MLOs): are intended for providing more flexibility by being able to offer some services at any integrity level. They are validated to a given integrity level and can accept data from any level. They are modified dynamically and restoring it at the beginning of the next invocation. To achieve this aim, the authors prove that these objects have no memory. At each invocation, these objects will be created from scratch. Validation Object (OV): provides information with a sufficient certified integrity level to allow flow from low to high integrity level. Furthermore, it runs fault tolerance mechanisms to produce high integrity outputs. The software architecture described a Trust Computing Base (TCB), which is composed of operating system micro and kernel integrity. The goal of TCB is to control all communications in the system, prevent unauthorized rising flows by authorizing only ascending flows, and sending it to a validation object.Figure 2: Illustrations of the integrity policy rules [25]
3.3. Integrity Based IMS architecture
In IMS networks, the integrity protection is applied between user equipment (UE) and the P-CSCF for protecting the SIP signaling according to several steps: Firstly, UE and P-CSCF negotiate the integrity algorithm for the session. Secondly, these entities agree on key of security, which is based on AKA algorithm and they verify that data originates received. Finally, the replay and reflection attacks must be mitigated. The integrity algorithm defined in IMS architecture is HMAC-MD5-96 or HMAC-SHA-1-96. This algorithm should be supported by UE and the P-CSCF. The protection indicator of integrity to decide the registration is as follows: (1) REGISTER request from the UE needs to be authenticated. (2) The S-CSCF should be known about the integrity protection applied to a message. (3) The p-CSCF lies an indication in the REGISTER request to inform the S-CSCF that the message was integrity protected for verifying if the message of integrity is the same or not. (4) For all other REGISTER requests, the P-CSCF attached an indication in order to verify that was not integrity protected or ensures that there is no indication about integrity protection in the message [5].
3.4. Fuzzy Logic
Fuzzy Logic is a technique that provides mechanisms to handle nonlinear uncertainties that exist in physical systems. It introduced by Lotfi Zadeh [26]. It is applicable in several applications [27]. Fuzzy sets represent objects collection, which is characterized by a membership function. The membership function is a type variable, which uses words instead of numbers to represent its knowledge in fuzzy systems that express a conditional rules statement [28]. The linguistic variables are parameters that are used to control the system and to show their performance. It is divided into levels. Fuzzy operations are the same operations in classical sets, which are union, intersection, containment, and complement. Fuzzy rules consist of three parts antecedent, fuzzy proposition, and consequence. Fuzzy inference system (FIS) is the regrouping of fuzzy rules, the linguistic variables of membership functions and fuzzy reasoning [27]. The FIS is designed for constructing complex and nonlinear relationships between the input and output. There are many FIS used in applications such as Mamdani, Tsukamoto, and Sugeno [30]. The difference between these types of FIS is in the aggregation and defuzzification processes. The Mamdani FIS method is used in our case because it has widespread acceptance and it has the most commonly used of the three FIS [30]. To implement an FIS, four steps to follow fuzzification, rule evaluation, aggregate output, and defuzzification.
4. Contribution And Discussion
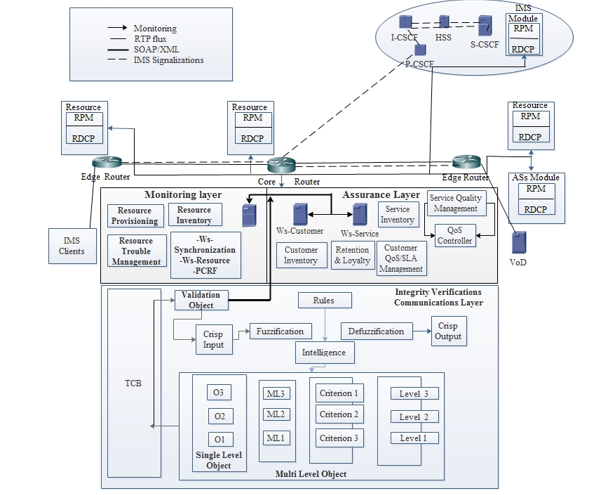
The approach of multi criticality on IMS networks aims applying of a policy of security in terms of criticality. The proposed contribution is to integrate a layer called Integrity verification communication in Test Bench [2] as shown in Figure 3. This integration is based on Totel model. Even though, in the IMS network, the entities of the controller have much knowledge of the network. Although, the administration of real-time services is a difficult task given the fluidity of the network to be ensured at any time. That is why, the contribution approach is to integrate a layer of security policy to monitor business processes [2] responsible for the implementation regarding verification and correction scenarios to ensure the integrity of the exchanged messages. Using Totel Model, for integrity policy presents an advanced innovation in terms of QoS management in IMS network compared with the other models [20, 21, 22, 23]. These models prohibit the passage flow from a lower level of criticality to the highest level of criticality. On the other hand, in IMS network; the users are mobile devices, have different preferences such as environment, equipment …
For this effect, the communications should be circulated in both ways from less critical tasks to more critical tasks. The proposed contribution is based on an object-oriented, the SLO objects described levels of QoS and the MLO objects described levels of criticality of customers. In [24], the authors have specified that the MLO allow changing their level of criticality at any invocation method to control and accept data from lower or equal level. These objects have no memory, and are created at each invocation, which influences execution duration and reduces network performance; also, the identification of the exacted values for these thresholds is very difficult. For this reason, the concept of Fuzzy logic is used to determine dynamically criticality levels for users according to several criteria: customers, equipment, and environment. This technique allows a significant gain in terms of determining appropriate QoS to the users’ levels of criticality.
4.1. Integration of fuzzy logic in the multi criticality approach
There are many main components of soft computing such as Fuzzy Logic, Neural Networks, Probabilistic reasoning [29] and Genetic algorithms [31]. The most important one is Fuzzy Logic.
Figure 3: Architecture proposed [1]It incorporates modeling, control management, forecasting and performance estimation. Also, it used on several applications. The integration of multi criticality approach, based on fuzzy logic as shown in Figure 3 has several advantages while estimating a QoS considering the increasing or decreasing levels of criticality of customers, levels of QoS services and optimizing costs. However, this approach is a key to satisfaction both QoS and QoE of customers’ needs.
4.2. Use Case of Fuzzy Logic
The simulation results are based on Matlab tools. The fuzzy logic tool allows users to create Fuzzy inference for estimating conclusions problems. To simulate a system, the system is built through the Graphical User Interface (GUI) Tools. Five GUI tools are being executed to have simulations for the input and output of our system: building, editing FIS, Membership function, Rules, and reviewing Rule and surface. The viewer Rule and surface are being used for a survey with FIS editor.
FIS Design
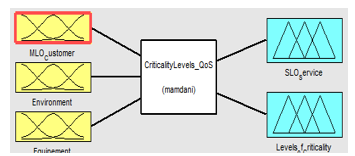
Fuzzy Logic is based on Fuzzification, rule evaluation, aggregation, and defuzzification as mentioned previously. The simulation is based on Mamdani method, which is the most frequently used method [30]. This method allows a system to work in an easy and simplified mathematical way as described in Figure 4.
For modeling the control system, the FIS design considers three parameters: Environment, Equipment, and Customer to define the chance value of SLOService and levelOfCriticality MLO. Customer input presents a degree of importance of users according to their activities in the IMS network. Equipment input presents categories of mobile use. Environment input presents areas when users placed. SLOService describes a QoS and LevelOfCriticality describes levels of criticality for the customer.
Figure 4: Fuzzy Inference System for CriticalyLevels_QoS
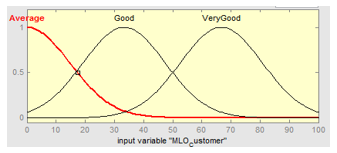
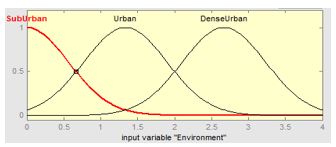
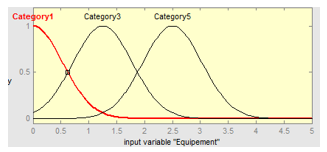
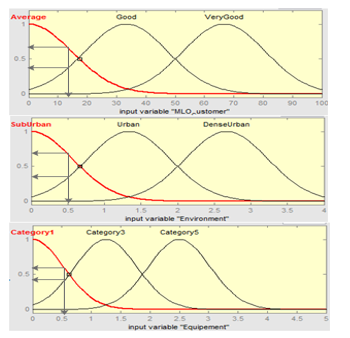
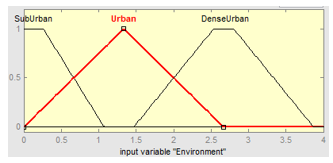
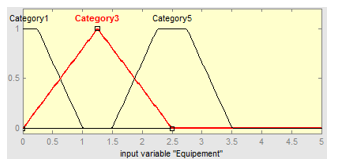
Each parameter is divided into three linguistic value levels: Average, Good, and very Good for Customer input, and Dense Urban, Urban, Suburban for Environment, and category 1, category 3, category 5 which present bit rate for Equipment. Moreover, Matlab Fuzzy Logic tools included several types of membership functions such as triangle, Trapezoidal, Gaussian, sigmoidal and S-shape. In the next step, some simulations are found to determine the important membership functions between Gaussian, trapezoidal and Triangle whose gives a good result in the aspect of chance value for SLOService and MLO.
Analysis and examples for Gaussian membership function
The variable linguistic for input parameters is presented by a Gaussian membership function as illustrated in Figure 5, Figure 6 and Figure 7.
Figure 5: Membership function for Customer input Figure 6: Membership function for Environment input
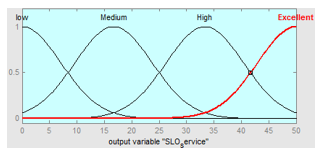
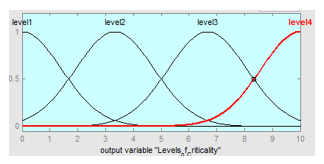
The linguistic variable for chance value is divided into four levels following as Level1, Level2, Level3, and Level4 for levels of criticality, which level1 presents low level of criticality, Medium level of criticality for level2, High level of criticality for level3 and Excellent level of criticality for level4. Low, Medium, High and Excellent for levels of QoS as shown in Figure 8 and Figure 9. These variables linguistic for output parameters are presented as well by a Gaussian membership function.
Figure 7: Membership function for Equipment input Figure 8: Membership function for SLOService output Figure 9: Membership function for LevelsOfCriticality output
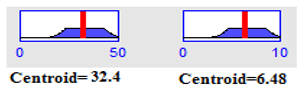
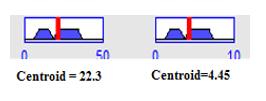
Since, three parameters are selected for input, each parameter is divided into three levels. Well, 3^3= 27 possible values as described in Table 1 which obtained for fuzzy rules IF-THEN rule. Moreover, the Mamdani system describes how to clarify and use FIS to determine the chance value for SLOService and MLO. The following four steps provide details for the calculation of the chance value: For step 1, the inputs are forwarded, which are input value as illustrated in Figure 5, Figure 6 and Figure 7 to the FIS. It is a step for fuzzification of input values. Depending on these three crisp numbers, the value of membership functions is determined, which is the intersection point of the value of our input (Customer, Environment, and Equipment) with the degree of the membership function. After, the fuzzification step, the values obtained applies to IF-THEN rules to determine a new fuzzy output set using the fuzzy operator (AND), which selects the minimum of three membership values used above to get a single number as details in Table 2 and illustrated in Figure 10, that described rules evaluation. After these steps, the process of aggregation will start. It is a process for combining rules into a single fuzzy set to represent the outputs of each rule, using operator Fuzzy Logic and in order to select the maximum of rules evaluations values. Lastly, the process of defuzzification is executed, where the value chance of SLOService is obtained, which represent a level of QoS and the level of criticality. In this step, a method centroid of the area (COG) [26] is used to calculate the implied value as shown in Figure 11.
Figure 10: Fuzzification of crisp value input Figure 11: Centroid Point for Defuzzification
Analysis and examples for trapezoidal and Triangle membership function
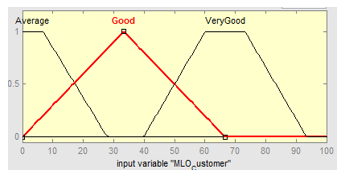
The following simulation describes a comparison between Gaussian, triangle and trapezoidal membership function. The linguistic variable for the middle level (good, Urban, category3) is presented by the triangle membership function, while the other levels are presented by Trapezoidal membership function as illustrated in Figure 12, Figure 13 and Figure 14.
Figure 12: Fuzzy set of Customer Figure 13: Fuzzy set of Environment Figure 14: Fuzzy set of Equipment
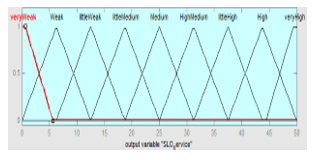
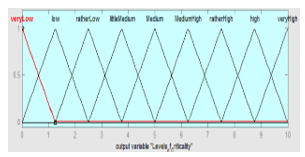
To give our incidence feature of flexibility, the linguistic variable for chance value is divided into 9 levels following as VeryLow, Low, ratherLow, LittleMedium, Medium, HighMedium, ratherHigh, High, VeryHigh for levels of criticality and veryWeak, Weak, littleLow, LittleMedium, Medium, HighMedium, littleHigh, High, VeryHigh for levels of QoS as illustrated in Figure 15 and Figure 16.
Figure 15: Fuzzy set of SLOsService Figure 16: Fuzzy set of SLOsService
According to this result, the degree that is determined by a Triangle and Trapezoidal membership functions is more specific than a membership function of Gaussian. In addition, Triangle and Trapezoidal membership functions are more useful than the other types because their degree is more easily determined. Table 3 illustrates IF-THRN rules. The following Figure 17 described a result obtained for defuzzification by triangle and trapezoidal membership function.
Figure 17: The centroid point
Table 3: Fuzzy Inference System IF-THEN rules
Rule
No
Customer
Environment
Equipment
SLO
MLO
1
Average
DenseUrban
Category5
LW
rL
2
Average
DenseUrban
Category 3
weak
Low
3
Average
DenseUrban
Category1
VW
vL
4
Average
Urban
Category5
LW
rL
5
Average
Urban
Category3
weak
Low
6
Average
Urban
Category1
VW
vL
7
Average
SubUrban
Category5
LM
rL
8
Average
SubUrban
Category3
LW
Low
9
Average
SubUrban
Category1
Weak
vL
10
Good
DenseUrban
Category5
HM
HM
11
Good
DenseUrban
Category 3
M
M
12
Good
DenseUrban
Category1
LM
LM
13
Good
Urban
Category5
HM
HM
14
Good
Urban
Category3
M
M
15
Good
Urban
Category1
LM
LM
16
Good
SubUrban
Category5
HM
HM
17
Good
SubUrban
Category3
M
M
18
Good
SubUrban
Category1
LM
LM
19
VeryGood
DenseUrban
Category5
VH
VH
20
VeryGood
DenseUrban
Category 3
High
High
21
VeryGood
DenseUrban
Category1
LH
rH
22
VeryGood
Urban
Category5
VH
VH
23
VeryGood
Urban
Category3
High
High
24
VeryGood
Urban
Category1
LH
rH
25
VeryGood
SubUrban
Category5
VH
VH
26
VeryGood
SubUrban
Category3
High
High
27
VeryGood
SubUrban
Category1
LH
rH
For SLOService QoS: Low: veryWeak(VW)-weak-LittleWeak (LW), Medium: LittleMedium (LM)-Medium (M)-HighMedium (HM), High: LittleHigh (LH)-High-HighMedium (HM). For LevelsOfCriticality MLO: Level1 (low level of criticality): veryLow (vL)-Low-ratherLow (rL), Level2-3(Medium Level of criticality): LittleMedium (LM)-Medium (M) – MediumHigh (MH), Level4 (High level of criticality): ratherHigh (rH) – high- veryHigh (vH).
Analysis and examples for different defuzzification methods:
Our analysis result takes into consideration two cases:
Case 1: Low quality of service and Low Level of Criticality.
Case 2: Excellent quality of service and High Level of Criticality.
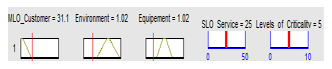
Case1: if (customer is average) and (Environment is SubUrban) and (Equipment is Category1) then (LevelofCriticality is veryLow) and (SLOService is veryWeak), which is described in Rule viewer and illustrated in Figure 18.
Figure 18: Rule Viewer for case 1
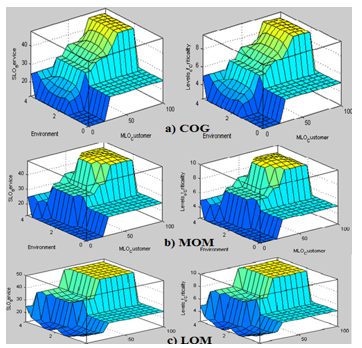
While, the values for MLO_Customer as average (31.1), Environment 1.02 and Equipment 1.02, then SLOService is 25 and Level of criticality is 5. In this case, the Level of criticality is low and the level of QoS also is Low. Therefore, the activity of users is average, the environment is suburban and the equipment is category1, which bit rate is low. Thus, the level of criticality and QoS are low. According to this result of defuzzification, the service of VoD is delivered. This value is obtained by using COG method. The proposed approach of multi criticality is based on several criteria for making decision problems. For this reason, the FIS incorporates three inputs and two outputs. In this case, a 3D surface cannot show the relations between all output criteria: SLOService and levelofCriticality. In such a case, several 3D fuzzy surfaces are illustrated in different examples in Figure 19. Each surface corresponds to one scenario and allows the sensibility of the SLO and LevelsOfCriticality output with Customer and Environment input. Three main methods of defuzzification methods such as COG (Centroid of Gravity), MOM (Mean value of maximum), and LOM (Largest value of Maximum) are simulated by using 3D surface viewer as illustrated in Figure 19. A method COG returns a maximum of aggregation solutions. MOM method takes as a solution the average of the most likely values output. In addition, LOM method returns the maximum value, which is determined from membership functions.
Table 4 defines the results of comparative for three methods of defuzzification such as COG, MOM and LOM. Rule number 9 describes case 1 that represents a low quality of service (SLO) which value of COG method is 13.6, MOM is 6.25 and LOM is 9. In addition, the value of low Level of Criticality (MLO) using COG method is 2.92, MOM is 0.25 and LOM is 0.5.
From the result above, The COG method returns the maximum chance values for providing the more stable results among the other methods (MOM and LOM), considering the variations in the set conclusion which are graphically illustrated in Figure 19. From these figures, also the same results are concluded, the COG defuzzification methods take into a consideration several values for input that represented by different color as compared to MOM and LOM method. Thus, the concluded result is that the COG method gives a better result than MOM and LOM methods.
Table 4: Output values obtained for different defuzzification method
S. No
Input
Output SLO
Output MLO
Ct
Ev
Eq
C
M
L
C
M
L
1
8.3
3.54
4.43
25
25
25
5
5
5
2
8.3
3.54
2.54
21.1
12.5
16.5
4.21
2.5
3.3
3
8.3
3.54
0.56
18.3
6.25
10.5
3.66
1.25
2.1
4
8.3
2.37
4.43
25
25
25
5
5
5
5
8.3
2.37
2.54
18.3
12.5
13
3.66
2.5
2.6
6
8.3
2.37
0.56
17
6.25
9.5
3.4
1.25
1.9
7
8.3
0.64
4.43
25
25
25
5
5
5
8
8.3
0.64
2.54
19.5
12.5
15.5
3.9
2.5
3.1
9
8.3
0.64
0.56
13.6
6.25
9
2.92
0.25
0.5
10
50
3.54
4.43
25
25
25
5
5
5
11
50
3.54
2.54
21.1
36.8
50
4.21
7.37
10
12
50
3.54
0.56
18.3
31.3
48
3.66
6.25
9.6
13
50
2.37
4.43
25
25
25
5
5
5
14
50
2.37
2.54
37.1
48.5
50
7.45
9.7
10
15
50
2.37
0.56
31.3
37.5
40.5
6.27
7.5
8.1
16
50
0.64
4.43
25
25
25
5
5
5
17
50
0.64
2.54
37
48.5
50
7.44
9.7
10
18
50
0.64
0.56
31.3
37.5
40.5
6.26
7.5
8.1
19
85
3.54
4.43
25
25
25
5
5
5
20
85
3.54
2.54
47.7
48
50
9.49
9.6
10
21
85
3.54
0.56
40.6
40.8
48
8.12
8.15
9.6
22
85
2.37
4.43
25
25
25
5
5
5
23
85
2.37
2.54
47.8
48.3
50
9.51
9.65
10
24
85
2.37
0.56
40.6
40.8
47.5
8.12
8.15
9.5
25
85
0.64
4.43
25
25
25
5
5
5
26
85
0.64
2.54
47.8
48.3
50
9.51
9.65
10
27
85
0.64
0.56
40.6
40.8
47.5
8.12
8.15
9.5
Ct (Customer), Ev (Environment), Eq (Equipment), C (COG), M (MOM), L (LOM).
Figure 19 shows that the environment and type of customer are low, thus resulting of SLO and MLO is Low, this is why the result is different for three defuzzification methods. A service VoD can be transmitted with low quality for a customer whose have a low level of criticality.
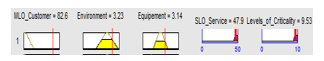
Case2: if (customer is VeryGood) and (Environment is DenseUrban) and (Equipment is Category5) then (LevelofCriticality is veryHigh) and (SLOService is veryHigh) as described in Rule viewer and illustrated in Figure 20.
Figure 19: Surface viewer with method: a) COG, b) MOM and c) LOM Figure 20: Rule Viewer for case 2
In case 2, the value of the Customer is 82.6, Environment is 3.23 and Equipment is 3.14. For SLOServices the value is 47.5 and LevelOfCriticality is 9.53. The analysis determined that the QoS is Excellent and the level of criticality is high. This means that using the parameters above, the service VoD can be transmitted with excellent quality for a customer whose have a high level of criticality. The case 2 is illustrated with rule 19 in Table 4, which describes DenseUrban environment, veryGood type of customer and high category of mobile, thus resulting in high SLO and MLO this is why the result is approximately the same for three defuzzification methods: GOC, MOM, and LOM, which are 25 for SLO output and 5 for MLO output. A service VoD can be transmitted with high quality for a customer whose have a high level of criticality.
From the above examples in case 1 and case 2, the COG defuzzification method gives better results in the aspect of SLOService and LevelsOfCriticality. This can be seen with the surface viewer and the rule viewer as presented in the above examples using different rules. In this section, the proposition aims are to design some control mechanisms, for solving problems of QoS during multimedia service transmission by using an intelligent controller, in order to determine dynamically levels of criticality of customers. This controller is analyzed by using Fuzzy Controller Language (FCL), the input of FCL is determined and the most appropriate membership functions and defuzzification method are founded for determining better crisp values in the aspect of SLOService and LevelsOfCriticality in IMS network. In addition, the methods for membership function (Gaussian, Triangle, and Trapezoidal) and methods for defuzzification: GOC, LOM, and MOM are compared. The 3D surface viewer is used for describing the comparison offered by three methods. Through these analyses, the COG method, triangle, and trapezoidal membership functions give better results in all analyzed cases.
5. Conclusion
In this paper, the proposed approach of multi-criticality is based on Fuzzy Logic to ensure integrity on IMS architecture, in order to determine levels of criticality dynamically by using multi-criteria: Environment, Equipment and Type of customer for making the decision to offer a level of QoS of VoD. It is based on Totel model. From the simulation results, the triangle and trapezoidal membership functions give better results than Gaussian membership also COG method of defuzzification is more efficient than MOM and LOM methods. Future works, will be focused on the technical approach of Totel model using technologies web SOA, make a VoD by using openIMS, and will be focused on the prediction of the indicators for storing the antecedents’ cases of degradation, furthermore another aspect of QoE will be discussed.
O. Kasmi, A. Baina, M. Bellafkih, “Multi level integrity management in critical infrastructure,” International Conference on Intelligent Systems: Theories and Applications, IEEE, 1-6, 2016.
M. Errais, M. Bellafkih, R. Daniel, “Autonomous System for network monitoring and service correction, in IMS Architecture,” International Journal of Computer Science and Applications, 12 (1), 80-93, 2015.
R. Rajavelsamy, P. Basavaraj, C. Suresh, “Efficient registration procedure for multi-domain authentication for mission critical communication services,“ Standards for Communications and Networking, IEEE, 282-287, 2015.
M. Navarro, Y. Donoso, V. Rodriguez, “An IMS architecture with QoS parameters for flexible convergent services,“ Symposium on: Computers and Communications, IEEE, 640-645, 2010.
M. Poikselka, A. Niemi, H. Khartabil, G. Mayer: The IMS: IP Multimedia Concepts and Services, John Wiley & Sons, 2013.
U. Baniel, K. C Jackson, T. Abou-Assali, M. Mercurio, D. M. Sprague, “Methods, systems, and computer readable media for policy and charging rules function (PCRF) node selection,” U.S. Patent No. 8,615,237, 2013.
3GPP TS 23.228: Service Requirements for the Internet Protocol (IP) Multimedia Core Network Subsystem (IMS), Stage 1, (Release 7), 2007.
3GPP TS 29.207 : Policy control over Go interface, (Release 6), 2011.
J. Cao, M. Ma, H. Li, Y. Zhang, Z. Luo, “A survey on security aspects for LTE and LTE-A networks,” Communications Surveys & Tutorials 16.1, IEEE , 283-302, 2014.
J. Balcerzak, T. Grzegorz, S. Stephane, “QoS monitoring model of registration procedure for IMS platform,” 16th International Conference on Telecommunications Network Strategy and Planning Symposium, IEEE, 1-6, 2014.
J. Lu, D. Christoph, K. Francine, “Distributed self-diagnosis algorithm for VoIP service over IMS network,“ International Conference on Cyber-Enabled Distributed Computing and Knowledge Discovery, IEEE, 186-191, 2015.
V.K Tiwari, K.G Amit, D. Saurabh, “Web service discovery and integration with QOS parameter using SOA based repository,“ International Conference on Advances in Computer Engineering and Applications, IEEE, 1014-1009, 2015.
M. Raouyane, M. Bellafkih, M. Errais, “SLA Management & Monitoring based-eTOM and WS-composite for IMS networks,” 4th IFIP International Conference on New Technologies, Mobility and Security, IEEE, 1-6, 2011.
Application Note to the SLA Management Handbook – Voice over IP, TMF document reference GB 934, 2005.
SERIES M: Telecommunications management network Enhanced Telecom Operations Map (eTOM) –Representative process flows, ITU-T Recommendation M.3050.
L. Anegekuh, L. Sun, E. Jammeh, I. Mkwawa, E. Ifeachor, “Content-based video quality prediction for HEVC encoded videos streamed over packet networks,“ Transactions on Multimedia, 17(8), IEEE, 1323-1334, 2015.
S. Lingfen, E. Ifeachor, C. Emmanuel “Voice Quality Prediction Models and Their Application in VoIP Networks, IEEE transaction on Multimedia, 8 ( 4), 809-820, 2006.
J. Breithaupt, S. Merkow, “Information Security Priciples of Success,” part of the certification/training series, 3-15, 2014.
A. Ameziane El Hassani, A. Abou El kalam, A. Ait Ouahman, A. Bouhoula, R. Abassi, “Integrty-OrBAC: a new model to preserve Critical Infrastructure integrity,” International Journal of Information Security, 14 (4), 367-385, 2015.
L.J. LaPadula, D.E. Bell, “Secure Computer Systems: A Mathematical Model,” Volume II (No. MTR-2547-Vol-2), MITRE CORP BEDFORD MASS, 1973.
K. Biba, “Integrity considerations for secure computer systems,” (No.MTR-3153-REV-1), MITRE CORP BEDFORD MA, 1997.
M.B. Baig, C. Fitzsimons, S. Balasubramanian, R. Sion, D. E. Porter, ”CloudFlow: Cloud-wide policy enforcement using fast VM introspection,” International Conference on Cloud Engineering, IEEE, 159-164, 2014.
K. Li, H. Feng, Y. Li, Z. Zhang, “Information flow control model and method in distribute MILS,“ International Conference on Computational Intelligence and Security, IEEE, 598-602, 2014.
E. Totel, J. Blanquart, Y.Deswarte, D. Powell, “Supporting multiple levels of criticality,” Fault-Tolerant Computing, Twenty-Eighth Annual International Symposium, IEEE, 70-79, 1998.
A. Baina, Y. Laarouchi, “MultiLevel-OrBAC: Multi-Level Integrity management in organization based access control framework,” International Conference on Multimedia Comuting and Systems, IEEE, 933-938, 2012.
B. Bouchon-Meunier “la logique floue et ses applications,“ Vie artificielle. Addistion-Wesley, 1995.
J.T .Ross “Fuzzy Logic with Engineering Applications,“ John Wiley & Sons Inc.Chichester, England, 2004.
S. Chaudhari, M. Patil, J. Bambhori, “Study and review of fuzzy inference systems for decision making and control,” American International Journal of Research in Science Technology Engineering and Mathematics, 5 (1), 88-92, 2014.
S. Montani, C. J Lakhmi, “Case-Based Reasoning Systems,” Successful Case-based Reasoning Applications, 2. Springer Berlin Heidelberg, 1-6, 2014.
V. Kamboj,A. Kaur, “Comparison of constant SUGENO-type and MAMDANI-type fuzzy inference system for load sensor,” International Journal of Soft Computing and Engineering, 3(2), 204-207, 2013.
V. Chandwani, V. Agrawal, R. Nagar, “Modeling slump of ready mix concrete using genetic algorithms assisted training of Artificial Neural Networks,“ Expert Systems with Applications, 42(2), 885-893, 2015.
Cristhian Jesus Benitez Dominguez, Fernando Ariel Britez Cantero, Luis Guillermo Moré Rodríguez, Diego Pedro Pinto-Roa, José, Domingo Colbes Sanabria, "Many-objective Placement Optimization in Virtual Network Functions", Advances in Science, Technology and Engineering Systems Journal, vol. 11, no. 3, pp. 9–39, 2026. doi: 10.25046/aj110302
Paul Miracle Udah, Ayomide Ibrahim Suleiman, Jibril Abdullahi Bala, Ahmad Abubakar Sadiq, Taliha Abiodun Folorunso, Julia Eichie, Adeyinka Peace Adedigba, Abiodun Musa Aibinu, "Development of an Intelligent Road Anomaly Detection System for Autonomous Vehicles", Advances in Science, Technology and Engineering Systems Journal, vol. 8, no. 2, pp. 1–13, 2023. doi: 10.25046/aj080201
Karol Rástočný, Juraj Ždánsky, Jozef Hrbček, "Using a safety PLC to Implement the Safety Function", Advances in Science, Technology and Engineering Systems Journal, vol. 6, no. 1, pp. 1072–1078, 2021. doi: 10.25046/aj0601119
Nour Najeeb Abdalkareem Qubbaj, Anas Abu Taleb, Walid Salameh, "LEACH Based Protocols: A Survey", Advances in Science, Technology and Engineering Systems Journal, vol. 5, no. 6, pp. 1258–1266, 2020. doi: 10.25046/aj0506150
Siddikov Isamiddin Xakimovich, Umurzakova Dilnoza Maxamadjonovna, "Fuzzy-logical Control Models of Nonlinear Dynamic Objects", Advances in Science, Technology and Engineering Systems Journal, vol. 5, no. 4, pp. 419–423, 2020. doi: 10.25046/aj050449
Alvaro Anzueto-Rios, Jose Antonio Moreno-Cadenas, Felipe Gómez-Castañeda, Sergio Garduza-Gonzalez, "Image Segmentation Using Fuzzy Inference System on YCbCr Color Model", Advances in Science, Technology and Engineering Systems Journal, vol. 2, no. 3, pp. 460–468, 2017. doi: 10.25046/aj020359

 DOI: 10.25046/aj020384