Computer Aided Classification using Support Vector Machines in Detecting Cysts of Jaws

Adv. Sci. Technol. Eng. Syst. J. 2(3), 674–677 (2017);
 DOI: 10.25046/aj020386
Jaw cyst is one of the most common pathology observed in the field of dentistry. Early detection of the cystic lesion will help the surgeons to take appropriate therapeutic measures after a thorough diagnostic procedure. One of the challenging task for surgeons is to differentiate the cysts from the other pathologies. The appearance of these pathologies on a radiograph is a complex and confusing task due to the close similarity between the cysts and tumors which is a difficult to differentiate just by its appearance. Hence to resolve this problem, a computer aided classification algorithm is needed for accurate classification of cysts. The work presents a new approach for the determination of the presence or severity of the jaw bone disease aiding the diagnosis and radiotherapy planning. This paper presents texture characterization for the dental panoramic images. The transposed images are analyzed using Gray level co-occurrence matrix(GLCM). The textural properties such as entropy, contrast, correlation, energy and homogeneity are determined for both cyst and non-cystic images. The results obtained are fed to the classification model to classify the given image into normal or abnormal images containing cyst. Support vector machines are chosen for image classification. Image dataset of 30 were used in training and validation. The image set consists of 20 abnormal images and 10 normal images used in image classification.
1. Introduction
Digital dental x-rays are the most preliminary step in imaging various dental anomalies. Dental x-rays also referred as orthopantomograph is the radiographic examination of jaws and the supporting structure across the teeths [12]. Using this equipment, the area of interest in the jaw are scanned in few seconds, often happen to be distorted by the noise and have inhomogeneous distribution, due to this, few regions are blurred making it difficult to interpret certain features from the raw images. Orthopantomography being a two dimensional imaging modality is riddled with problem of superimposition of anatomical structures. In this approach, the limitations are overcome by using specific image processing algorithm to retrieve more information from the original image.
A cyst in the jaws occurs most frequently than any other part of the body. The most frequent manifestation of jaw cysts is swelling followed by the combination of swelling and pain. The swelling associated with the cysts causes facial deformation adversely affecting the patient’s psycho-social status. A definitive diagnosis can be made by age gender and prevalence of cyst. If the cysts are not detected at an early stage, it may lead to tumors. Jawbone cysts are classified based on the odontogenic or nonodontogenic, epithelial or non-epithelial, inflammatory or developmental in origin. The distribution of jaw cysts in the ordinary population according to the diagnosis are radicular cysts, dentigerous cysts, odontogenic keratocyst(OKC), eruption cysts, nasopalatine duct and traumatic bone cysts to name a few. Diverse cysts or cysts like lesions appear in maxillofacial region. According to the study, radicular cysts (RC) and dentigerous cysts(DC) are the commonest of all the cysts [1][2].
2. Image Processing Chain
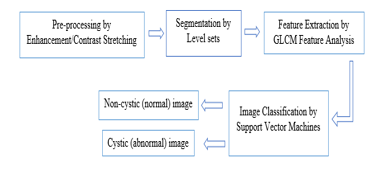
Image processing chain consists of preprocessing, segmentation, feature extraction and classification [9]. First the dental x-ray images are preprocessed based on image enhancement technique namely contrast stretching. Next, it involves segmentation of cysts and lesion using level sets method. In addition to this, certain features are extracted based on texture statistical distribution using gray level co-occurrence matrix (GLCM). In this step the texture properties such as energy correlation, contrast, entropy and homogeneity are analyzed and given as an input for classification. Image classification is made using support vector machines (SVM) to classify the presence or absence of cysts for the given image set. Figure 1 show the block diagram of the image processing system.
2.1. Preprocessing
Pre-processing represents the lowest level of abstraction at the images where both input and output are gray scale intensity images. Pre-processing deliberately reduces the information content of the image [13]. If the entropy of the images is measured, the preprocessed image typically has low information content compare to the original image. Therefore, the aim of preprocessing is to reduce the noise and improve the quality of image highlighting few important features which is necessary for further processing in segmentation and recognition tasks [4]. Image pre-processing is classified into two categories such as image enhancement and image restoration techniques. In this paper the raw dental images are scanned by digital dental x-rays are preprocessed based on one of the enhancement techniques called contrast stretching. Contrasting the image, possibly increase the brightness so that the transformed image can be better interpreted. Usually digital dental x-rays images have limited band of gray levels. So the gray level transformation corrects the brightness by setting up the two image contrast between two brightness values p1 and p2. Using the proper brightness threshold, the contrast of the image can be improved and significantly recognizing low level features which is distorted due to poor illuminance properties [3].
2.2. Segmentation by Level Sets
The main idea behind this level sets segmentation is to represent the initial contour of the object as the zero level set function which is defined by the level set function defined in the higher dimensions [12]. The level sets function is evolved using partial differential equations (PDF) [10]. This method presents many advantages in which the contour described by the extent level set function has the flexibleness to interrupt and merge naturally
during the evolution. [5].
The level set method is a curve evolution technique for detecting interfaces and shapes in the images. In level set method initially the contours are set as zero level set of higher dimensional function called as level set function. firstly, geometrical shaped contour and iterations are defined and after given number of iterations the contour spreads over the region of interest for the object boundaries to be extracted. [5].
The level set evolution function is defined as the gradient flow minimizing energy functional based on the term distance regularization and basically it has energy functional that tends to move the zero level set function to obtain the desired object boundaries and its location. This level set function(LSF) created with the signed distance profile near the zero-level set function give rise to the new technique called as distance regularized level set function(DRLSE). The numerical errors accounted induced during computation of the level sets are reduced with the effect of distance regularization term.
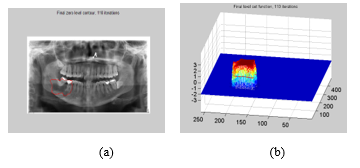
In traditional level sets methods, level sets functions create instability and causes numerical errors with the irregularities developed during its evolution. Hence to avoid such errors, a mathematical approach called initialization is used [6]. Figure 2 illustrates the segmentation of cystic region carried out by the level sets algorithm for 110 number of iterations.
2.3. Texture Analysis
Feature extraction is a method to extract the desired features and representing the data for further processing. This plays a crucial part in machine vision in understanding and describing the objects extracted after segmentation [11]. The resulting representation can be used as an input for classification techniques to classify the medical data into normal or abnormal. In this step, the features pertaining to the dental images are extracted using statistical texture analysis. Texture is represented as the spatial distribution of gray levels in the neighborhood pixels. Each pixel is characterized by its position and tonal properties referred as texture elements or texels. Thus image texture is described by the spatial relationship and its primitives. Texture constitute the repeated pattern of local deviations in the image intensity finely distinguishing the objects subjectively at the given resolution. Hence the general rule is to group this connected or similar set of pixels occurring repeatedly in the image region satisfying certain the gray level properties is assigned as textured region. Typically, texture deals with the properties representing the surface or shape of an object. In this phase the dental x-ray images are analyzed based on one of the statistical texture description using co-occurrence matrix called gray level co-occurrence matrix(GLCM) [3].
Texture is spatial quantity which is represented by the two dimensional matrix known as gray level co-occurrence matrix. The occurrence matrix gives the interdependencies of the gray level intensities to extensively analyze texture [3].
The gray level co-occurrence matrix P[ i, j] is defined as how frequently the pixels with the gray level i and j are occurring in the window separated by the distance vector[6]. Distinct features are extracted by GLCM are entropy, energy, contrast correlation and homogeneity for the dental panoramic images. This GLCM estimates the similarity measures among these co-occurrence matrices and five features are selected for this course of study which are discussed in this paper.
Entropy defines the randomness present in an image. It is a measure of disorder of an image. It is inversely proportional to the energy of GLCM. If the image is inhomogeneous, the GLCM matrix P will have small values. Hence entropy will be low if energy is high in the GLCM matrix. It is difficult to understand subjective wise as mathematically it given by![]()
Energy cost for the uniformity of the image representing second angular moment. A monochrome or homogeneous image usually has less gray level distributions hence a co-occurrence matrix, P will predominantly have high values for energy feature. In this context, Energy is, the opposite of entropy. Image exhibits its distinct energy forces acting internally and externally on the images[8]. In this sense, Energy is useful in representing orderliness. That is the reason for finding Energy in texture measures.![]()
Contrast is accounted for difference moment of the co-occurrence matrix P representing the local variations and brightness distribution in the image.![]()
Homogeneity represents inverse difference moment. This term attains the highest values when most of the GLCM elements are concentrated towards the main diagonal of the GLCM matrix P. Hence it is inversely proportional to the GLCM contrast.![]()
The correlation feature is a measure of gray-level linear dependencies in the image [7].![]()
Table 1: Feature extracted for cystic images
| Features
/Images |
Image1 | Image2 | Image3 | Image4 | Image5 |
| Energy | 0.0872 | 0.783 | 0.1 | 0.087 | 0.0987 |
| Entropy | 7.7096 | 7.5304 | 7.6366 | 7.7872 | 7.6889 |
| Contrast | 0.4477 | 0.4529 | 0.5305 | 0.5208 | 0.4895 |
| Correlation | 0.9466 | 0.9267 | 0.9208 | 0.932 | 0.9161 |
| Homogeneity | 0.8693 | 0.8824 | 0.8688 | 0.8581 | 0.8513 |
Table 1: Feature extracted for non-cystic images
| Features
/Images |
Image1 | Image2 | Image3 | Image4 | Image5 |
| Energy | 0.1173 | 0.1046 | 0.1119 | 0.0999 | 0.0991 |
| Entropy | 7.5469 | 7.4637 | 7.4786 | 7.6337 | 7.6255 |
| Contrast | 0.53 | 0.555 | 0.5686 | 0.5572 | 0.5833 |
| Correlation | 0.9216 | 0.9249 | 0.9174 | 0.9342 | 0.9307 |
| Homogeneity | 0.8729 | 0.8585 | 0.8614 | 0.8614 | 0.8601 |
2.4. Image Classification
Image classification is one of the application of medical image processing and has a great significance in the field of pattern recognition. Most of the times, the jaw bone cysts and lesions have close similarity which is hard to differentiate just viewing the images where the patient is allowed to undergo deferential diagnosis. Hence this common problem can be taken as classification problem where the main purpose of classifier is to differentiate the normal and abnormal pixels based on the texture features. Support vector machines is one of the most successful method proved for pixel classification.
Support vector classification is one of the advance approach used in statistical recognition which is computationally faster than other classifiers. SVM designs a model which group the pixels into normal and abnormal pixels yielding binary classification. In this approach, the optimal classification can be obtained by increasing the margin or the empty space between the two classes. The width of the margin is defined as the distance between the discrimination hypersurface in n-dimensional feature space and the closest training patterns which are known as support vectors. Thus support vectors specify the discrimination function in hyperplane. Earlier SVM is employed for dealing only linear classification yielding two separate classes. Later this limitation was overcome by supporting non linearity classification where combing two separate classes yielding multi class classification [3].
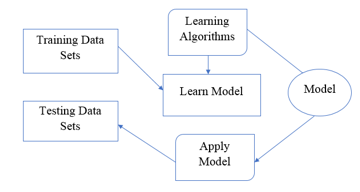
Support vector classification involves designing a model for two separable classes. Hence training is required for the classifier where the kernel function is chosen appropriately to yield better performance of the classifier [7]. A large amount of training data set is required for the learning algorithm to obtain high accuracy. Figure 3 shows the basic steps involved in generic classification algorithm.
3. Conclusion
Dental x-ray images exhibit complex nature with respect to distribution of pixel intensities. This paper presents a new algorithm for determination of texture using on co-occurrence matrix(GLCM). The selection of feature plays a vital role in any classification. Five distinct features are extracted using GLCM namely energy, contrast, entropy, correlation and homogeneity. These features are given to the classifier to classify into presence or absence of cysts for the given dental image. The classification is made by support vector machines. This yield a binary classification which group the given image set into cystic(abnormal) image or non-cystic(normal) image. Totally 30 images were used for training and testing the classifier, in which 20 images are abnormal (or cystic images) and 10 (non-cystic) images are normal. The proposed classification algorithm accounted for 68% of accuracy. Hence to improve the accuracy large dataset are used to train the network which constitute the future scope of this proposed work.
- Johnson, Nigel R., Orla M. Gannon, Neil W. Savage, and Martin D. Batstone, “Frequency of odontogenic cysts and tumors: a systematic review” Journal of investigative and clinical dentistry 5, no. 1, pp. 9-14,2014.
- Cyrus S, Micha, Chindia Mark L, Awange David O, Dimba Elizabeth, Osundwa Tom M, and Otwoma Josiah G, “Pattern of occurrence of jaw cysts and cyst-like lesions at the University of Nairobi Dental Hospital: A 10-year histopathologic audit” Open Journal of Stomatology 2012.
- Sonka, Milan, Vaclav Hlavac, and Roger Boyle. Image processing, analysis, and machine vision. Cengage Learning, 2014.
- Divya, K. Veena, Anand Jatti, P. Sabah Meharaj, and Revan Joshi. “Appending active contour model on digital panoramic dental X-rays images for segmentation of maxillofacial region.” In Conference on Biomedical Engineering and Sciences (IECBES), pp. 450-453, IEEE EMBS, 2016.
- Choong, Mei Yeen, May Chin Seng, Aroland Kiring, Soo Siang Yang, and Kenneth Tze Kin Teo. “Variational Level Set Algorithm in Image Segmentation for Foetus Ultrasound Imaging System”, IEEE International conference, 2012.
- Li, Chunming, Chenyang Xu, Changfeng Gui, and Martin D. Fox, “Distance regularized level set evolution and its application to image segmentation”, IEEE transactions on image processing 19, no. 12 pp. 3243-3254, 2010.
- Partio, Mari, Bogdan Cramariuc, Moncef Gabbouj, and Ari Visa. “Rock texture retrieval using gray level co-occurrence matrix.” In Proc. of 5th Nordic Signal Processing Symposium, vol. 75. 2002.
- Abdolvahab Ehsani, Mohd Shafry Mohd Rahim, and Alireza Norouzi. “Digital dental X-ray image segmentation and feature extraction.” Indonesian Journal of Electrical Engineering and Computer Science 11, no. 6, pp. 3109-3114,2013.
- Ayachi, Raouia, and Nahla Ben Amor. “Brain tumor segmentation using support vector machines” European Conference on Symbolic and Quantitative Approaches to Reasoning and Uncertainty, pp. 736-747. Springer Berlin Heidelberg, 2009.
- Nurtanio, Ingrid, “Classifying Cyst and Tumor Lesion Using Support Vector Machine Based on Dental Panoramic Images Texture Features” IAENG International Journal of Computer Science,vol no .40:1:4 , 2013.
- Vijayakumari, B., G. Ulaganathan, A. Banumathi, A. Farzana Shahar Banu, and M. Kayalvizhi. “Dental cyst diagnosis using texture analysis.” In Machine Vision and Image Processing (MVIP), 2012 International Conference on, pp. 117-120. IEEE, 2012.
- Veena Divya.K, Jatti, Anand, and Revan Joshi, “Image processing and parameter extraction of digital panoramic dental X-rays with ImageJ.” Innternational Conference on Computation System and Information Technology for Sustainable Solutions (CSITSS), International Conference on, pp. 450-454. IEEE, 2016.
- R. Gonzalez and R. Woods, Digital Image Processing, Prentice Hall, 3rd edition, Jan. 2008.