Building an Efficient Alert Management Model for Intrusion Detection Systems

Adv. Sci. Technol. Eng. Syst. J. 3(1), 18–24 (2018);
 DOI: 10.25046/aj030103
This paper is an extension of work originally presented in WITS-2017 CONF. We extend our previous works by improving the Risk calculation formula, and risk assessment of an alert cluster instead of every single alert. Also, we presented the initial results of the implementation of our model based on risk assessment and alerts prioritization. The idea focuses on a new approach to estimate the risk of each alert and a cluster of alerts. This approach uses indicators such as priority, reliability and asset value as decision factors to calculate alert’s risk. The objective is to determine the impact of alerts generated by Intrusion detection system (IDS) on the security status of an information system, and also improve the detection of intrusions using snort IDS by classifying the most critical alerts by their levels of risk. Thus, only alerts that present a real threat will be displayed to the security administrator. The implementation of this approach will reduce the number of false alerts and improve the performance of the IDS.
1. Introduction
This paper is an extension of work originally presented in International Conference on Wireless Technologies, Embedded and Intelligent Systems, EEE WITS-2017 [1]. Based on our work in [2], the goal is to improve the intrusion detection system (IDS) with a Risk Assessment method that can help to prioritize the generated alerts by their importance.
IDS systems generate enormous number of alerts. Often, there are duplicative events from various systems, and other alerts that could be characterized as noise (False Positive). A False Positive is normal events being classified as attacks. This is a major problem for many organizations [3,4]. An attack may in fact be happening, and the network administrator needs to be able to properly identify it, thus, he need to analyze each IDS alert manually, whether it is a false or true positive. So, it is a quite time consuming. Since the number of false positives is high, so alerts of real attacks are hidden among them. The optimal way to deal with this problem is to use an IDS solution that has the ability to prioritize alerts, calculate the risk of each one and correlate them, thereby to help the network administrator focus the efforts on detecting actual threats [5-7]. Therefore, an automated operation is needed to handle alerts and give a good perdition to the security administrator.
In this work, we propose the new Risk Assessment model as a method of prioritizing alerts according to the risk level of each one, and also evaluate the risk of a cluster of alerts. The risk is evaluated as a combination of certain parameters extracted from each alert.
This paper is organized as follows: Section 2 discusses the related work in risk assessment and alert prioritization; Section 3 presents the proposed model and the indicators that are used to support it; Section 4 discusses the implementation of the model and the experimental results to validate the proposed approach; and finally, in Section 5, we summarize the conclusions derived from this work and indicate possible future works.
2. Related Works
Intrusion detection system has an important role in the security and perseverance of active defense system against intruder attacks. They evolved from packet sniffers, used as a network troubleshooting tool to locate malfunctioning equipment and software by creating logs showing the activity of network packets [8,9]. Prior to the advent of network switches, IDS products could be connected to any port on a network hub and had a good chance of monitoring network packets on a local area network segment. Many researchers have proposed and implemented various models for IDS, but they often generate too many false positives due to their simplistic analysis [10].
Attacks are presented to a security administrator as alerts generated by IDSs. An IDS generates a large number of alerts and with this large number, security administrators are overwhelmed and it becomes difficult to manually distinguish between the real attacks and the false ones. To deal with this problem, two solutions have been proposed. The first one focuses on the monitoring device by enhancing its detection mechanism, optimizing its signatures, and choosing the right location [11]. Although this solution promises to reduce the number of alerts, it requires prior security administrator knowledge of detection mechanism. The second solution focuses on the sensor’s outputs. Several IDS alert management techniques fall into this category and include aggregation, clustering, correlation and fusion [12].
Generally, reducing the number of false positives and prioritizing the most critical attacks are the main objectives of IDS alert management approaches. Furthermore, these techniques help the security administrators in understanding the situation revealed by the IDS.
In our previous work [2] we presented a new model to handle Intrusion detection system alerts based on a stateful pattern matching algorithm. In this paper we improve that model by proposing a new method based on risk assessment and alert prioritization using parameters extracted from alerts generated by IDS.
Risk assessment is the process of identifying security risks related to a system and determining their probability of occurrence, their impact, and the safeguards that would mitigate that impact [13]. Risks can be defined as the potential that a given threat will exploit vulnerabilities of an asset or group of assets to cause loss or damage to the assets. The main objective of risk assessment is to define appropriate controls for reducing or eliminating those risks.
Researchers have been proposed many approaches to prioritize alerts. In [13], the authors proposed a model that estimates the risk index for every single alert based upon indicators and input obtained from asset environments and attributes within the alerts themselves. The model uses a combination of two decision factors: impact on asset and likelihood of threat and vulnerability.
In [14], the authors proposed a method that evaluates IDS alerts based on a number of criteria. They used a Fuzzy Logic Inference mechanism in order to score alerts and developed a rescoring technique that enabled them to rescore alerts to show the early steps of the attackers, and applied their approach to the alerts generated by scanning DARPA 2000 LLDOS 1.0 dataset and they successfully prioritized the most critical alerts along with their preparation steps.
In [15], the authors applied a fuzzy system approach in accessing relative potential risks by associating potential vulnerabilities like the National Vulnerability Database (NVD) and Common Vulnerabilities and Exposures (CVE) with computer network assets.
In [16], the authors estimated risks by associating three criteria: computer network assets, attacks and vulnerabilities.
In [17], the authors proposed a model called “M-Correlator”, an alert ranking system based on the likelihood of attacks to succeed, the value of targeted assets and the amount of interest in the type of attack.
All discussed approaches have the ability to priorities alerts, but they also have limitations, especially in the technical aspects of the methods adopted. They used multiple factors to estimate the risk, but do not consider different weightings based upon the importance of different decision factors.
3. The proposed Model
3.1. Overview
In [1] and [2] we have proposed the New System Alert Management for IDSs based on a stateful pattern matching algorithm, which can classify alerts by their importance and reduce number of false positives considerably. In order to improve our system, we propose in this paper more efficient method to prioritize alerts generated by IDSs by evaluating each risk. We assess the risk as a composition of indicators extracted from alerts itself and target assets, and then apply these results of the risk assessment to filter alerts produced by the IDS as High Risk, Medium Risk or Low Risk.
In our proposed system (Figure 1), we’ve used binary traffics files of KDD’99 which is used in our previous work. Snort [18] is used to produce alerts of KDD’99 dataset network traffics. Snort is an open source signature based IDS which gets KDD’99 online traffic and then generates alert log files; these files are entered into our proposed system as the inputs. A pattern matching algorithm is used to filter alerts and classify them to different form.
3.2. System architecture
Our approach encompasses three phases for processing events: Pre-processing phase, Collection phase and Post- processing phase. Each phase provides a level of abstraction to the following one. Figure 1 shows the three abovementioned units.
Pre-processing Phase: In this phase Snort analyzes KDD’99 binary traffic and generates alert files. These alert files are entered in our proposed model as Inputs.
Collection phase: We call this phase also “aggregation and normalization phase”, For all data are received from Snort at one location. Aggregation aims at unify alerts in a single format on just one location. Normalization requires a parser familiar with the types and formats of generated alert from Snort after processing them. Snort list files contain information about all packets in KDD’99 dataset [19]. Using this method, we will be able to observe all alerts in the same format.
Post-processing phase: In this phase, once we have all the data in one place, we can implement mechanisms that will improve detection sensitivity and reliability.
In our model, we use three post-processing methods:
- Classification and Filtering: In this unit we extract the needed information, such as: Date, IP source, IP Destination, Attack name, etc., and we store them into a database. This information is extracted by parsing the alert file using Perl and regular expression as we will see in section 4.
- Risk assessment: Each alert is evaluated in relation to its attack type, and the target host. Several parameters make it possible to qualify the level of danger (Risk) of an alert. It is important to understand their significance in order to be able to manage correctly the alarms according to their level of importance (Table 1).
- Prioritization: We prioritize alerts received automatically after calculating the Risk. The priority of an alert depends on the architecture and inventory of the organization’s devices. Prioritization is one of the most important steps in filtering alerts received from the Snort output. It means the evaluation of an alert’s importance in relation to the organization’s environment.
To calculate the Risk, we use the parameters described in Table 1. Each parameter has a value. For the Alert Priority and Alert Reliability, these values are stored in a MariaDB database. For device values, the security administrator must add all the organization’s devices, including Servers, Firewalls, Switches, Access Points, Network Printers, etc., and must assign to each equipment a value between 1 and 5 according to the value and the criticality of the device. On the other hand, the other parameters are related to each type or classification of attack by Snort, these values are stored… in a MariaDB database for later use.
We calculate the risk using the three previous indicators by the following formula (3.7).
| Alert Priority (P) = {1-5} | (3.1) |
| Device Value (D) = {1-5} | (3.2) |
| Alert Reliability (R) = {1-10} | (3.3)
|
The risk should be between 1 and 10 as we will see in Table 2, so the X value and obtained by calculating the Risk using the Maximum Value of each parameter, for example:
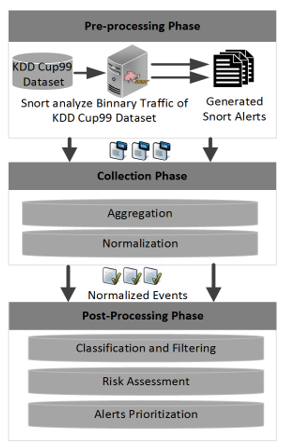 Figure 1: Proposed alert management system using real-time risk assessment and alert prioritization
Table 1. Description of parameters to assess the Risk of Alerts
| Parameter | Description |
| Priority | Priority defines the order in which the action should be taken. A classification type rule assigns default priority that may be overridden with a priority rule [18]. In our model, we categorized priority into three types:
This should be Low = 1-2; Medium = 2-3; High = 4-5 These values are associated with each classification type of Snort IDS, and is stored into a MariaDB Database. |
| The value of the Destination Device associated with the event | This is a value to define the importance of a machine on the network. A DNS or Web server are more valuable resources for an organization than a network printer. As we will see later, these specifications will be taken into account when calculating the risk of each alert. This value must be between 1 and 5 (1
= machine less important, 5 = very important machine). This value is stored into a MariaDB Database for each device of the organization. |
| The likelihood that the event will occur
Reliability |
In terms of the risk, this parameter could be called “Reliability”. This is defined for each independent event; an event may be a set of many alerts. The term reliability can be translated by the reliability that an event is not a false positive. The value of this parameter is between 1 and 10 (equivalent to 1% = this is a false positive and 100% = it is not a false positive). This value is stored into a MariaDB Database and it is associated with an independent type of event (Alert Classification [18]). |
Max(P)=5, Max(D)=5 and Max(R)=10
The proposed model estimates the Risk for each alert. As we see in Table 1, the model uses a combination of three decision parameters.
Using the Risk Assessment, the Total Risk of an attack can be calculated according to the alert rate. Latter is calculated using formula (3.8) presented in [2], the Total Risk of an Attack (TRA) is used to evaluate the Risk of an attack type in a Meta-Alerts. Meta-Alerts can be generated for the clusters that contain all relevant information whereas the amount of data (i.e. alerts), for example all alerts to a specific host with the same attack type, or all alerts from the same source to the same destination and with the same attack type, etc., thus, the TRA is calculated using formula (3.9).
The resulting value can be mapped to the following Risk Categories, Table 2:
Table 2. Risk Assessment Categories
| Risk Value | Signification |
| 1-4 | Low |
| 5-7 | Medium |
| 8-10 | High |
3.3. Proposed Algorithm
The Algorithm can be explained as follows:
| Algorithm: Filtering, classifying and prioritizing alerts
according to the Risk Level |
|
Input: Snort Log File (Generated by analyzing KDD’99 Dataset) Output : Alerts with high Risk
1. Initializes the program 2. Processes the configuration and log files 3. While the number of alerts in log file is not reached 4. Extracts and records details of each alert into database 5. Correlate and classify alerts into many classes (attacks types) 6. Calculate the Alert Rate 7. For each alert in log file 8. Calculate the Risk of alert using (3.7) 9. End For 10. For each Meta-alert in log file 11. Calculate the Total Risk on an Attack TRA of Meta-Alerts using (3.9) 12. End For 13. Prioritize Alerts according to the Risk Assessment 14. Generate alarms if the Risk ≥ 70 % 15. End While |
A basic flowchart diagram for the proposed algorithm is shown below (Figure 2):
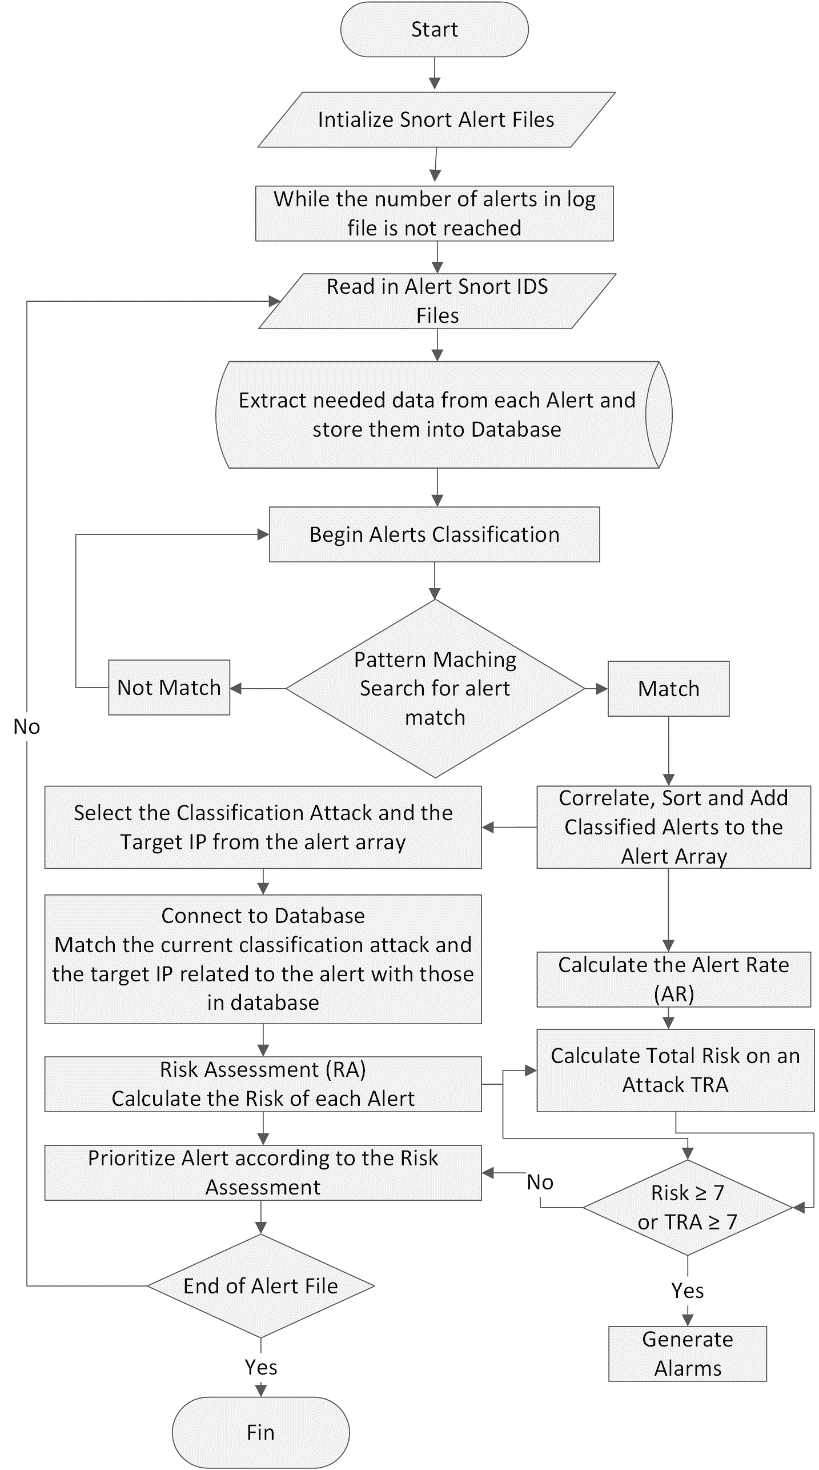 Figure 2: Flowchart of the proposed approach
4. Implementation and results
In order to test the effectiveness of our proposed model, we had it implemented and tested against the KDD’99 dataset. We also used Snort to scan the binary traffic of the dataset. Alerts generated by Snort were analyzed by our model using a pattern matching algorithm. To examine each alert, we wrote a Perl program using regular expression that parse the alerts and extract specific parameters such as source IP, destination IP, attack name, priority etc… Finally, we use the formula (3.7) to assess the Risk of each alert and (3.9) to evaluate the Total Risk of attacks.
The example of alert below is just one sample of many alerts that we can find in one alert file. In this alert we can find many useful data, such as the Attack Name, Attack Classification, Target IP, Destination IP etc., to extract this useful information we use the Pattern matching rule below using Regular Expression (RE).
An example of alert to deal:
[**] [3:19187:7] PROTOCOL-DNS TMG Firewall Client long host entry exploit attempt [**]
[Classification: Attempted User Privilege Gain] [Priority: 5] 03/19-16:01:43.762260 10.0.0.254:53 -> 172.16.2.11:1575 UDP TTL:64 TOS:0x0 ID:0 IpLen:20 DgmLen:201 DF Len: 173
These variables are stored into a MariaDB Database, thereby we can calculate the Risk for each generated Alert using these parameters and the formula (3.7), after that, using (3.9) we estimate the TRA.
Tables 3 and 4 below presents our experiment results using the output of Snort IDS and KDD’99 Dataset (with 99503 Alerts) that contains different 34 attempted attacks, 1056 Source IP, 485 Destination IP.
The Associated Pattern Matching rule:
^(?P<delimeter1>\[\*\*\])\s(?P<SigID_Rev>\[[0-9:]+\])\s(?P<Attack_Name>[^\”]+)\s+(?P<delimeter2>\[\*\*\])\s\[Classification\:(?P<Attack_Class>[^\]]*)\]\s\[Priority\:(?P<Attack_Priority>[^\]]*)\]\s+(?P<Date>\d+\/\d+\-\d+\:\d+\:\d+)\.\d+\s(?P<SrcIP>\d{1,3}\.\d{1,3}\.\d{1,3}\.\d{1,3})\:(?P<SrcPORT>\d+)\s\->\s(?P<DstIP>\d{1,3}\.\d{1,3}\.\d{1,3}\.\d{1,3})\:(?P<DstPORT>\d+)\s(?P<Protocol>\w+)\s+[^\]]*.*$
Extracting Data to variables:
Attack_Name = PROTOCOL-DNS TMG Firewall Client long host entry exploit attempt
Attack_Class = Attempted User Privilege Gain
Attack_Priority =
SrcIP = 10.0.0.254
DstIP = 172.16.2.11
DstPORT=53
Protocol= UDP
Tables 3. Classifying alerts by Detection Rate
| Attack Name | Nr. of Events | Alert Rate % |
| (http_inspect) NO CONTENT-LENGTH OR+E3:E19 TRANSFER-ENCODING IN HTTP RESPONSE | 45600 | 45.82 % |
| (http_inspect) INVALID CONTENT-LENGTH OR CHUNK SIZE | 30524 | 30.67 % |
| (spp_sdf) SDF Combination Alert | 12356 | 12.41 % |
| Consecutive TCP small segments exceeding threshold | 7052 | 7.08 % |
| (http_inspect) UNESCAPED SPACE IN HTTP URI | 1159 | 1.16 % |
| (http_inspect) LONG HEADER | 809 | 0.81 % |
| (http_inspect) SIMPLE REQUEST | 640 | 0.64 % |
| ET CHAT IRC PRIVMSG command | 425 | 0.42 % |
| ET CHAT IRC PING command | 276 | 0.28 % |
| ET CHAT IRC PONG response | 127 | 0.12 % |
| ET CHAT IRC USER command | 101 | 0.10 % |
| ET CHAT IRC NICK command | 99 | 0.10 % |
| ET CHAT IRC JOIN command | 84 | 0.08 % |
| ET POLICY Outbound Multiple Non-SMTP Server Emails | 74 | 0.07 % |
| Reset outside window | 35 | 0.03 % |
| (http_inspect) UNKNOWN METHOD | 29 | 0.03 % |
| (ftp_telnet) FTP bounce attempt | 16 | 0.01 % |
| ET SCAN Potential SSH Scan OUTBOUND | 15 | 0.01 % |
| (http_inspect) NO CONTENT-LENGTH OR+E3:E19 TRANSFER-ENCODING IN HTTP RESPONSE | 12 | 0.01 % |
| (http_inspect) INVALID CONTENT-LENGTH OR CHUNK SIZE | 11 | 0.01 % |
| (spp_sdf) SDF Combination Alert | 11 | 0.01 % |
| Consecutive TCP small segments exceeding threshold | 11 | 0.01 % |
| (http_inspect) UNESCAPED SPACE IN HTTP URI | 8 | 0.01 % |
| (http_inspect) LONG HEADER | 6 | 0.00 % |
| (http_inspect) SIMPLE REQUEST | 5 | 0.00 % |
| ET CHAT IRC PRIVMSG command | 5 | 0.00 % |
| ET CHAT IRC PING command | 3 | 0.00 % |
| ET CHAT IRC PONG response | 3 | 0.00 % |
| ET CHAT IRC USER command | 3 | 0.00 % |
| ET CHAT IRC NICK command | 2 | 0.00 % |
| ET CHAT IRC JOIN command | 2 | 0.00 % |
Our platform for the experiment are described as follows:
- Processor: Intel (R) Core (TM) i7-6500U CPU @ 2.50GHZ59 GHZ.
- Memory: 4 GB
- System (OS): Linux Ubuntu Server 16.04 64-bit
Table 3 present the classification of alerts according to the alert Rate; Alert Rate is measured by calculating the number of alert for each attack [2].
Table 4 shows the process of evaluating the risk of alerts. After classifying them into three categories, the security administrator will see just alerts with medium and high risk. The rest with low risk can be considered as false positives, this is related to the values of the target hosts and the reliability and priority of the attack. As we can see in Table 4, the risk is evaluated for each alert. For example, in the first row in the table, we notice that the attack “(http_inspect) NO CONTENT-LENGTH OR+E3:E19 TRANSFER-ENCODING IN HTTP RESPONSE”, has been generated 45600 times to the target “192.168.11.52”. The RA is 10 which is High. It is evaluated using the three parameters related to the alert: the priority, the reliability and the device target value. In other ways, the Total Risk of an Attack is evaluated according to the number of events of each attack in relation to the Alert Rate of this Attack.
The specific and complex characteristics of the network system environment make the implementation of Intrusion Detection System more difficult with the multitude of alerts and the huge number of false positives. Therefore, the new approach for detection and analysis of malicious activities is needed in order to check the effectiveness of the current security controls that protect information data.
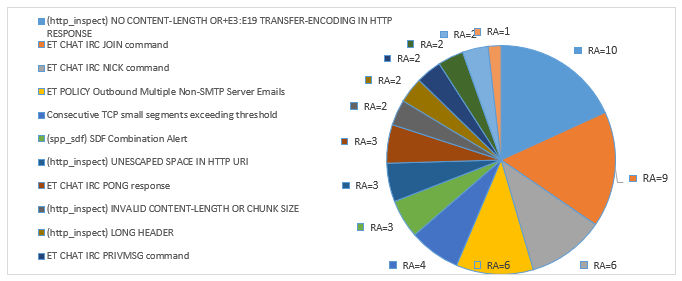 Figure 3: Alerts prioritization after risk assessment
Table 4. Risk Assessment according to the alert and target host parameters
| No. of events | To Target | Attack Name | P | R | D | RA | RA
Ranking |
AR % | TRA % |
|
45600 |
192.168.11.52 |
(http_inspect) NO CONTENT-LENGTH OR+E3:E19 TRANSFER-ENCODING IN HTTP RESPONSE |
5 |
10 |
5 |
10 |
High |
45.82 % |
4.6% |
| 30524 | 192.168.2.12 | (http_inspect) INVALID CONTENT-LENGTH OR CHUNK SIZE | 3 | 5 | 4 | 2 | Low | 30.67 % | 0.6% |
| 12356 | 192.168.11.5 | (spp_sdf) SDF Combination Alert | 3 | 5 | 5 | 3 | Low | 12.41 % | 0.4% |
| 7052 | 172.16.2.56 | Consecutive TCP small segments exceeding threshold | 3 | 7 | 5 | 4 | Low | 7.08 % | 0.3% |
| 1159 | 192.168.2.100 | (http_inspect) UNESCAPED SPACE IN HTTP URI | 3 | 7 | 3 | 3 | Low | 1.16 % | 0.03% |
| 809 | 172.16.16.123 | (http_inspect) LONG HEADER | 3 | 5 | 3 | 2 | Low | 0.81 % | 0.01% |
| 640 | 172.16.16.52 | (http_inspect) SIMPLE REQUEST | 3 | 5 | 2 | 1 | Low | 0.64 % | 0.06% |
| 425 | 192.168.11.101 | ET CHAT IRC PRIVMSG command | 3 | 5 | 4 | 2 | Low | 0.42 % | 0.008% |
| 276 | 192.168.2.58 | ET CHAT IRC PING command | 3 | 5 | 4 | 2 | Low | 0.28 % | 0.005% |
| 127 | 10.10.101.2 | ET CHAT IRC PONG response | 3 | 7 | 4 | 3 | Low | 0.12 % | 0.003% |
| 101 | 10.222.1.1 | ET CHAT IRC USER command | 3 | 5 | 4 | 2 | Low | 0.10 % | 0.002% |
| 99 | 10.22.1.231 | ET CHAT IRC NICK command | 5 | 8 | 5 | 6 | Medium | 0.10 % | 0.006% |
| 84 | 172.16.2.112 | ET CHAT IRC JOIN command | 5 | 9 | 5 | 9 | High | 0.08 % | 0.007% |
| 74 | 172.16.16.52 | ET POLICY Outbound Multiple Non-SMTP Server Emails | 5 | 8 | 4 | 6 | Medium | 0.07 % | 0.004% |
In this work we demonstrated how the implementation of risk assessment reduces the number of false positive. With such an approach, the security network administrator will see just the alerts with a medium and high-risk level that presents a real threat to the organization. The rest of alerts will be considered as a false positive and will not be sent as alarms. Thus, the network security administrator can check the effectiveness of the current security controls that protect the organization’s assets (Figure 3). In the next step of this work, we will set up a knowledge base for all the false positives to be compared further and to see if they are indeed.
5. Conclusion and future works
A novel approach that evaluates intrusion detection system alerts using a new risk assessment and alert prioritization is presented. We proposed a model that recognizes and analyzes malicious actions by calculating the risk related to attack pattern and qualify the level of dangerousness of each attack, thus prioritizing alerts generated by IDS. The implementation has demonstrated the efficiency of our approach in both decreasing the huge number of false positives that can reach over 95 % of alerts in the usual cases with a normal IDS, using our model we can control the rate of false positives; thus, we increase the effectiveness of the IDS system.
In the next step of this work, we will focus on the implementation of our approach with other IDSs. Moreover, we will improve our model by using advanced functions as well as more sophisticated algorithms such as machine learning algorithms to classify the attacks according to their dangerousness.
Conflict of Interest
The authors declare no conflict of interest.
- M. Chakir, M.Moughit, Y.I. Khamlichi, “An efficient method for evaluating alerts of Intrusion Detection Systems” in 2017 International Conference on Wireless Technologies, Embedded and Intelligent Systems (WITS), 2017. Pages: 1 – 6, https://doi.org/10.1109/WITS.2017.7934678
- M. Chakir, Y.I. Khamlichi, M.Moughit, “Handling alerts for intrusion detection system using stateful pattern matching” in 2016 4th IEEE International Colloquium on Information Science and Technology (CiSt), 2016, Pages: 139 – 144, https://doi.org/10.1109/CIST.2016.7805031
- Ahmed, A.N. Mahmoud,J. Hu, “A survey of network anomaly detection techniques”, 2016. J. Netw. Comput. Appl. 60, 19– 31.
- Moustafa, J. Slay, ” The evaluation of network anomaly detection systems: statistical analysis of the unsw-nb15 data set and the comparison with the kdd99 data set”, Perspect. 25 (1 –3), 18– 31. 2016. Inf. Secur. J.: a Glob.
- Shameli-Sendi, M. Chariet, A. Hamou-lhadj, “Taxonomy of Intrusion Risk Assessment and Response System”, ELSEVIER Volume 45, , Pages 1–16. September 2014.
- M. Bhuyan, D.K. Bhattacharyya, JK. Kalita, “An effective unsupervised network anomaly detection method” In International conference on advances in computing, communications and informatics, no. 1; p. 533–9. 2012.
- Wang, Z. Zhang, and Y. Kadobayashi,” Exploring attack graph for cost- benefit security hardening: A probabilistic approach,” Computers & Security, vol. 32, pp. 158-169, 2013.
- Zhang, Z., Ho, P. and He, L. “Measuring ID S-estimated attack impacts for rational incident response: A decision theoretic approach”, Computers & Security , Vol. 28 No. 7, pp. 605-614, 2009.
- Scarfone and P. Mell: Guide to Intrusion Detection and Prevention Systems. Technical report, NIST: National Institute of Standards and Technology, U.S. Department of Com-merce, 2007.
- Hung-Jen Liao, Ch.-H. Richard Lin, Y.-Ch. Lin, K.-Y. Tung,”Intrusion detection system: A comprehensive review”, Journal of Network and Computer Applications 36, pp: 16–24. 2013.
- B. Anuar, H. Sallehudin, A. Gani, and O. Zakaria,” Identifying False Alarm for Network Intrusion Detection System Using Hybrid Data Mining and Decision Tree,” Malaysian Journal of Computer Science, ISSN 0127- 9084, pp. 110-115. 2008.
- Debar, A. Wespi, “Aggregation and correlation of intrusion-detection alerts” , Recent Advances in Intrusion Detection, 2001.
- B. Anuar, H. Sallehudin, A. Gani, and O. Zakaria,” A risk index model for security incident prioritisation” Proceedings of the 9th Australian Information Security Management Conference, Edith Cowan University, Perth Western Australia, 5th -7th December, 2011.
- Alsubhi, K., Al-Shaer, E. and Boutaba, R. “Alert prioritization in intrusion detection systems”, Proceedings of the IEEE Network Operations and Management Symposium, Salvador, Brazil, pp. 33-40, 2008.
- Dondo, M.G., “A vulnerability prioritization system using a fuzzy risk analysis approach”, Proceedings of the 23rd International Informa tion Security Conference, Milano, Italy, pp. 525-539, 2008.
- Lee, B. Chung, H. Kim, Y. Lee, C. Park, and H. Yoon,” Real-time analysis of intrusion detection alerts via correlation,” Computers & Security, vol. 25, no. 3, pp. 169-183, 2006.
- A. Porras, M.W. Fong, and A. Valdes, “A Mission-Impact-Based Approach to INFOSEC Alarm Correlation, Proceedings of the 5th International Symposium on Recent Advances in Intrusion Detection (RAID 2002)” 95–114, 2002.
- The Snort Project, Snort user’s manual https://www.snort.org/downloads, 2017.
- KDD Cup ’99 dataset, http://kdd.ics.uci.edu/databases/kddcup99/kddcup99.html.