Influence of supply frequency on dissipation factor measurement and stator insulation diagnosis

Adv. Sci. Technol. Eng. Syst. J. 3(1), 155–159 (2018);
 DOI: 10.25046/aj030119
This paper is an extension of work originally presented in EIC-2017. It deals with influence of the supply frequency for dissipation factor measurements, mainly for tests under power frequency and low frequency. After a theoretical reminder, we present some experiments on single coils and stators of high voltage motors. Finally, we discuss the results and the desirability of choosing one or the other of these methods.
1. Introduction
Dissipation factor, or tan d, is currently used for the insulation diagnostics. While the tan d measurements are mainly performed at power frequency, some methods based on the frequency steps [1] and very low frequency have been developed. The methods using very low frequency have some advantages in term of portability, power requirement, etc. but it is interesting to see the impact of the frequency on the quality of measurement and, subsequently, of the diagnostic.
This paper presents the influence of the supply frequency on tangent delta measurement. The paragraph II reminds the theoretical bases. The paragraph III presents some experiments, firstly on single coil and secondly on a stator of high voltage motor. Test are performed at 0.1 Hz and 50 Hz. The analysis of the result presents some difference, especially on the sensitivity at relaxation phenomena. These differences are discussed, and we can define some interests on insulation diagnostic.
2. Theory reminder
Dielectric losses are currently measured and used for electrical machines diagnostics. To perform the dielectric loss
measurement, the stator is considered as a capacitor and the theory supporting these measurements is based on the complex permittivity. Of course, this capacitor is imperfect.
It is schematized by the capacitance with a resistance in parallel, both in series with a resistance and an inductance, in our case, we can neglect Ls (fig. 1).
The real part of impedance is due to the series and parallel resistances Rs and Rp. Rs becomes important at high frequency when Rp has a dominating effect essentially at low frequency.
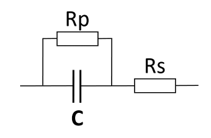 Fig. 1: Real capacitor model (without Ls) Fig. 1: Real capacitor model (without Ls) |
Rp is the picture of the losses due to the dielectric polarization, the dielectric resistance, leakage current and also charge redistribution phenomena. All these phenomena are involved at low frequency especially at industrial frequencies and lower. De facto we currently use the model within resistance in parallel which excludes Rs (1).
![]() Due to the phenomena of relaxation and losses, the insulating materials permittivity is complex (2)
Due to the phenomena of relaxation and losses, the insulating materials permittivity is complex (2)
![]() In this arrangement, is the component which defines the capacitive current (3) and is the component which defines the current IRp corresponding at the active losses in phase with the voltage (4).
In this arrangement, is the component which defines the capacitive current (3) and is the component which defines the current IRp corresponding at the active losses in phase with the voltage (4).
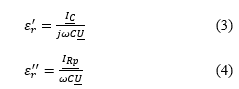 The tangent delta, or dissipation factor is defined as (5):
![]()
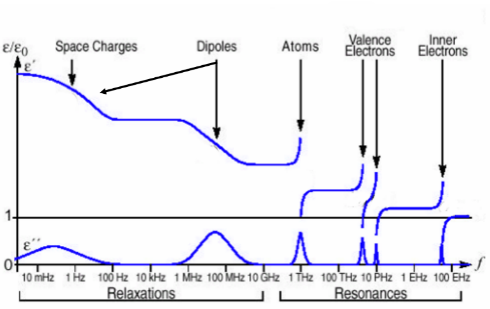 Fig. 2: effect of resonance and relaxation on permittivity (source [2]) Fig. 2: effect of resonance and relaxation on permittivity (source [2]) |
Of course, we can see that the tangent delta is inversely proportional to the frequency. But the main interest of the low frequency is the physics of the material. The polarization and relaxation phenomena involved in dissipation of the insulation have different origins and each of them approximately can be linked to frequency (fig. 2) as presented in [2].
The electronic and ionic polarization have a high frequency level (around 1015 Hz for electronic polarization) this type of polarization is not interesting for the machine diagnostic in first approach. On the other hand, the relaxation phenomena linked to dipoles, space charges and interface charges are very interesting.
These relaxation phenomena enable us to check precisely details like pollution and polymerization, which are visible at lower frequencies (less than 1 Hz) by tan δ analysis.
Furthermore, the temperature influence is a particularly important factor as presented on figure 3 and figure 4 [3] and explained in [4].
It could be an advantage but also a risk because a variation on the temperature has a bigger impact at low frequency (less than 1 Hz) than at industrial frequency.
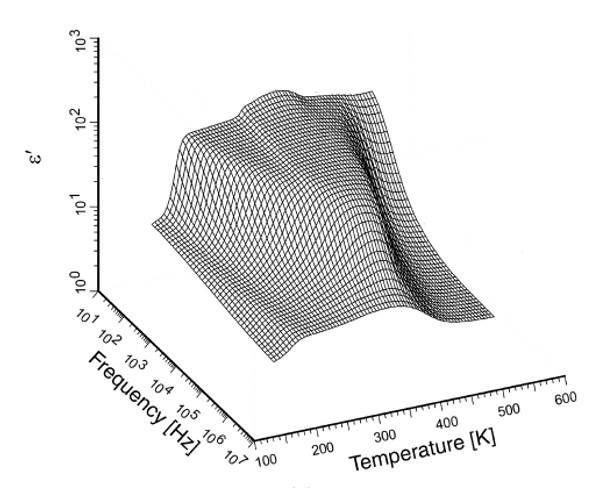 Fig. 3: Typical real part of the permittivity of porous glass versus frequency and temperature (source [3])
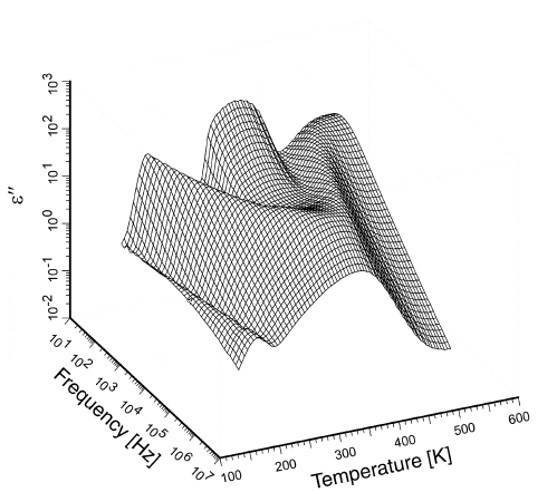 Fig. 4: Typical imaginary part of the permittivity of porous glass versus frequency and temperature (source [3])
3. Experimental studies
IEEE 433 recommends performing very low frequency tests at 0.1 Hz [5] and the monitoring present on the market uses this frequency. Therefore, the tests are performed at frequency of 0.1 Hz and 50 Hz, in accordance to IEEE 433 [5] and to IEC 60034-27-3 [6].
3.1. Experiments on coils
Tan δ measurements were performed on sample coils (7 kV rated) in steps of 1 kV from 1 kV to 9 kV. Measurements were performed successively at 0.1 Hz and 50 Hz.
These tests show higher tan δ values with a 0.1 Hz frequency supply than with a 50 Hz supply (fig. 5). Therefore, these measurements confirm some explanations of the theoretical reminder and they are also in accordance to the related literature and different diagnostic methods proposed in [1].
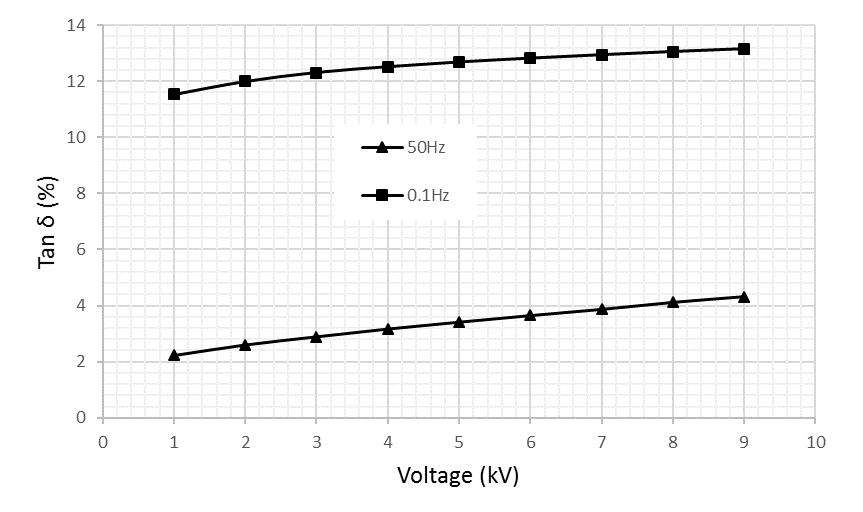 Fig. 5: tan δ versus voltage on single Coil Fig. 5: tan δ versus voltage on single Coil |
The difference of levels can be explained by a dielectric relaxation, which means a lowering of the dielectric losses with frequency, therefore 0.1 Hz is more sensitive than 50 Hz.
The underlying physical mechanism is usually related to the polymerization degree of the impregnating resin and interfacial polarization [4].
The voltage dependence of the losses of the sample is very similar for both frequencies. At this step, we could consider that the frequency just influences the level of tan d. In fact, the influence is also on the behavior of the tan d versus voltage.
3.2. Experiments on Stator
Measurements were performed on a 1.5 MW, 11 kV motor in accordance to IEC 60034-27-3 [6] and customer requirements (fig. 06).
Capacitance measurements at 50 Hz and 0.1 Hz have a similar behavior (fig. 08), on the other hand, the tan δ has a different shape at 50 Hz and 0.1 Hz (fig. 07)
As for a simple coil, the tan δ is higher at 0.1 Hz than at 50 Hz but of different shape (fig. 07). The measurement at 0.1 Hz shows a voltage dependence which is not present at 50 Hz.
This nonlinear voltage dependences of rotating machine insulation properties typically stem from partial discharges and currents in endwinding corona protection.
Evidence of the structural influence on the dielectric properties is shown in [4] as mechanical losses and dielectric losses largely coincide. This indicates that the 0.1 HZ test method can provide information about insulation quality, e.g. brittleness, shrinkage and risk of resin cracking caused by post-polymerization
Partial discharges analysis, and especially PRPD, can complete the tan δ information. Of course, the tan d and PRPD must be performed at the same frequency. The paragraph II confirms the theoretical reminder presented in paragraph I. Especially on complete stators, tan δ measurement allow to see some more phenomena at 0.1 Hz, being undetectable at 50 Hz.
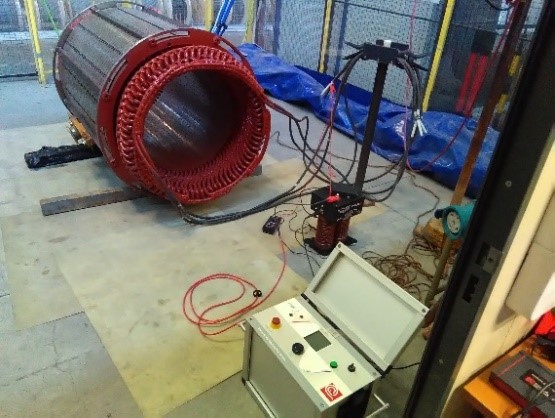 Fig. 6: VLF supply and measurement instrumentation on 11 kV Stator
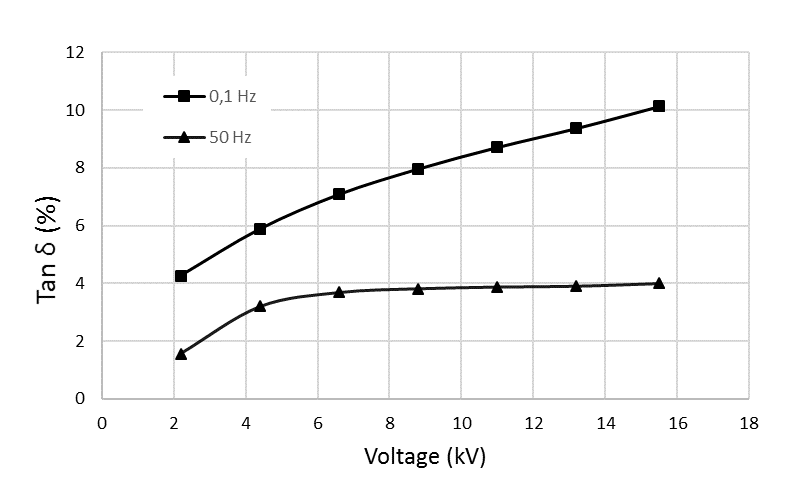 Fig. 7: tan δ versus voltage on 11 kV Stator
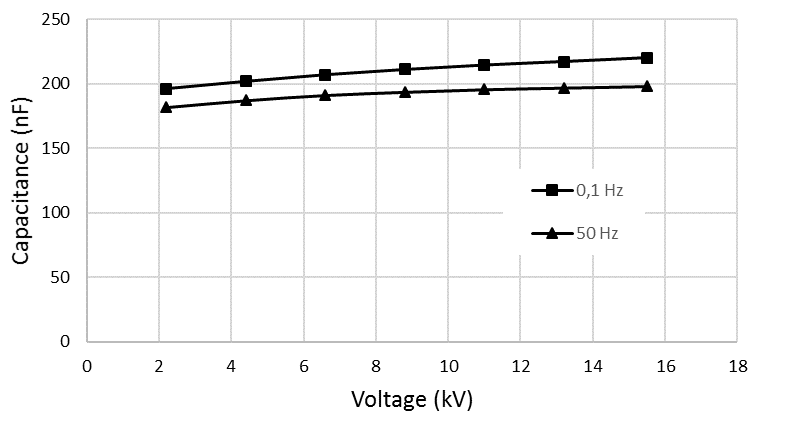 Fig. 8: capacitance versus voltage on 11 kV Stator
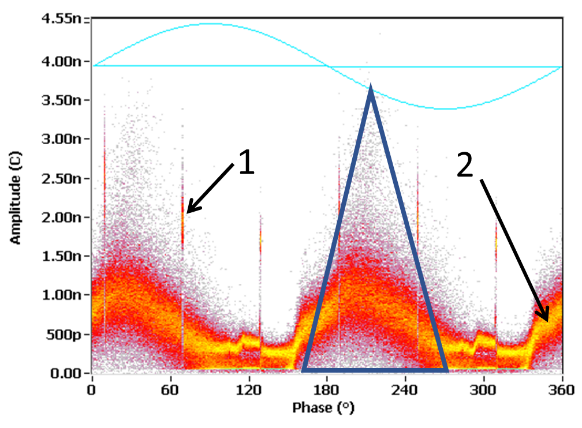 Fig. 9: PRPD at 50 Hz on 11 kV Stator (1) is commutation noise and (2) is saturation noise
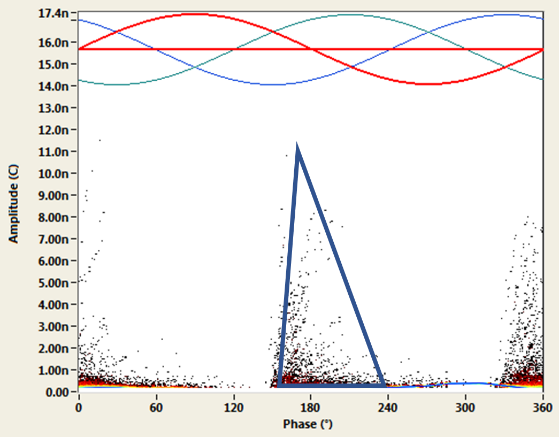 Fig. 10: PRPD at 0.1 Hz on 11 kV Stator
4. Extension to the Stator Insulation Diagnostic
In fact, the measurements at 0.1 Hz should be most efficient to the diagnostic phenomena linked to the complete insulation system [9]. Furthermore, the low frequency usage is not new. For example, measurements for CIGRE [10] was performed at 1Hz in 1990 in order to:
- do not have distortion of sinus wave (which is not perfect when it is provided by transformer at supply frequency)
- reduce the pulse pile-up
- have a cleaner PD pattern
- the higher sensitivity to the structural properties of the composite material allows to more sensitively follow the resin post-polymerization
However, the low frequency usage was costly in the beginning of the 90th, which is not the case anymore and this off-line monitoring procedure can be easily implemented and could be interesting to complement on-line monitoring which is de facto happening at power frequency.
5. Conclusion
tan δ measurement. It reminds the theoretical bases before present two different cases: a coil and a stator. Measurement were performed on two frequencies: 50 Hz (power frequency) and 0.1 Hz.
If similar diagnostic results together with partial discharge measurements, different defects can be detected or identified at lower power frequency.
The low frequency measurements present some advantages. Especially the dielectric losses react more sensitive to structural changes.
However, while diagnostics can be improved using low frequencies, criteria must still be developed if the low frequency method should be used for acceptance testing. Indeed, most of the tan δ criteria are established for power frequency tests and we have to perform further research in order to define reliable acceptance criteria.
On the practical side, the instruments used by the authors have proven easily transportable, insensitive to noise and have very low power requirements in comparison to power frequency devices. So, that we feel, not only the enhanced diagnostic potential but also cost consideration, which justify more research efforts in that field.
- Christof Sumereder, Michael Muhr, Michael Marketz, Christian Rupp, Michael Kruger “Unconventionnal Diagnostic Methods for Testing Generator Stator Windings” IEEE Electrical Insulation Magazine , Vol. 25 No. 5, sept. 2009.
- K. Jonscher “Dielectric relaxation in solids” Chelsea Dielectric Press, London, 1983.
- Feldmann, Y.A. Gusev, M.A. Vasilyeva ‘Dielectric phenomena in complex systems” Tutorial Kazan Federal University, 2012.
- Fruth, G. Liptak, “Dielectric Properties of Mica Epoxy Composites Subjected to Thermal and Thermoelectrical Aging”, Proc. 6th Int. Symp. High Voltage Engineering, New Orleans, 1989, paper 21.02
- IEEE 433-2009 : “IEEE Recommended Practice for Insulation Testing of AC Electric Machinery with High Voltage at Very Low Frequency”.
- IEC 60034-27-3 “Rotating electrical machines – Part 27-3: Dielectric dissipation factor measurement on stator winding insulation of rotating electrical machine” 2015.
- Caironi “Contribution to the on-line forecast maintenance of electric machines by the analysis of signals related to physical phenomena relating thereto.” PhD thesis, Université de Lorraine, France, 2002.
- Caironi, L. Durantay, D. Brie, A. Rezzoug “Interest & utility of Time-frequency and Time scale Transforms in the Partial Discharges Analysis” in proc. ISEI’2002, Boston USA.
- Nathaniel Taylor “Dielectric response and partial discharge measurements on stator insulation at varied low frequency”, PhD thesis Stokholm, Sweden, 2010.
- Fruth, J. Fuhr “Partial discharges recognition – A Tool for diagnosis and Monitoring Ageing” In proc CIGRE’1990 Paris, France.