Analysis of Outdoor and Indoor Propagation at 15 GHz and Millimeter Wave Frequencies in Microcellular Environment

Adv. Sci. Technol. Eng. Syst. J. 3(1), 160–167 (2018);
 DOI: 10.25046/aj030120
The main target of this article is to perform the multidimensional analysis of multipath propagation in an indoor and outdoor environment at higher frequencies i.e. 15 GHz, 28 GHz and 60 GHz, using “sAGA” a 3D ray tracing tool. A real world outdoor Line of Sight (LOS) microcellular environment from the Yokusuka city of Japan is considered for the analysis. The simulation data acquired from the 3D ray tracing tool includes the received signal strength, power angular spectrum and the power delay profile. The different propagation mechanisms were closely analyzed. The simulation results show the difference of propagation in indoor and outdoor environment at higher frequencies and draw a special attention on the impact of diffuse scattering at 28 GHz and 60 GHz. In a simple outdoor microcellular environment with a valid LOS link between the transmitter and a receiver, the mean received signal at 28 GHz and 60 GHz was found around 5.7 dB and 13 dB inferior in comparison with signal level at 15 GHz. Whereas the difference in received signal levels at higher frequencies were further extended in an indoor environment due to higher building penetration loss. However, the propagation and penetration loss at higher frequency can be compensated by using the antenna with narrow beamwidth and larger gain
1. Introduction
This article is an extension of research work originally presented at International Wireless Communication and Mobile Computing (IWCMC’17) conference [1]. In reference [1], studies were made at 15 GHz only, and only outdoor propagation was studied. However, in this article the radio propagation at millimeter wave frequencies i.e. 60 GHz is additionally studied. Furthermore, the research work of this article also includes indoor propagation analysis, which was not done earlier in [1].
Nowadays, the Fifth Generation (5G) of the mobile communication system is being actively discussed in both industry and academia [2-4]. Currently, various advanced wireless access technologies including High Speed Packet Access (HSPA), Long Term Evolution (LTE), and LTE-Advanced (LTE-A) are in operation. However, the ultimate solution for the ultra high capacity requirement of the future system is expected to be provided by the 5G. It is strongly believed that the higher frequency bands will play a vital role in meeting the capacity targets of the next generation of the cellular networks. The frequency bands between 700 MHz to 4 GHz are currently used by the mobile operators for radio transmission, and are already over loaded with current mobile technologies. Higher frequency bands offer wider spectrum. On the other hand, the higher path loss is also attributed with the higher frequency of operation [5]. The R&D organizations are extensively putting their effort for investigating the utilization of higher frequency bands for mobile communications [6]. The utilization of advanced antenna technologies such as Massive MIMO (MMIMO) and beamforming help in extending the coverage at higher frequencies.
It is important to understand the radio propagation characteristics in order to properly design and to efficiently optimize the system. Classical coverage prediction models do- not provide the insight information about the channel (environment). However, the deterministic ray tracing models provide the multidimensional characteristics of the radio propagation environment [7]. Multipath propagation is a complex phenomenon and involves several propagation mechanisms e.g. specular reflection, diffraction from the corners, transmission, diffraction from the rooftops, and diffused scattering [8]. Ray tracing is a promising technique for finding the possible paths between the transmitter and receiver.
At reference [9], the NTT DOCOMO provides the field measurement results of 5G radio system operating at the frequency of 15 GHz in an outdoor and indoor microcellular environment. One of the core targets of this article is to provide the simulation result for the scenario considered in [9], so that a comparison between the measured and simulated data can be made. For this purpose, the sAGA ray tracing tool based on Image Theory (IT) algorithm is utilized for the simulations. The radio propagation properties such as received signal strength, Power Angular Spectrum (PAS), and Power Delay Profile (PDP) at higher frequencies are also provided in this article. The simulation results presented in this article highlight the difference of propagation at different considered frequencies i.e. 15 GHz, 28 GHz and 60 GHz, and also highlight the difference of propagation in an outdoor and indoor environment.
2. System Model and Environment
2.1. System Configuration
The Fifth Generation (5G) of the mobile communication system based on Time Division Duplex (TDD) operating at 15 GHz frequency is considered at reference [9]. The 5G communication system consists of four contiguous Component Carriers (CCs), and each CC is assumed to have 100 MHz bandwidth. Carrier Aggregation (CA) is employed to combine four component carriers. The transmission power per component carrier is set to 27.3 dBm, which makes a total transmission power of the transmitter equals 33.32 dBm for 400 MHz bandwidth. The base station is installed with a directional antenna at the height of 8 m. The transmitter is located on the wall of the building. The base station antenna has a horizontal Half Power Beamwidth (HPBW) of 90 and a vertical HPBW of 10.5 and has a maximum antenna gain of about 14.5 dBi. A mechanical downtilt of 13.5 is used to restrict the propagation in small cell environment. Whereas at the receiver end the MS is assumed to have an omni directional antenna with 0 dBi gain. As, the target of this paper was to provide the simulation results for the system and environment considered in [9], therefore the same set of parameters and environment are assumed in this paper.
2.2. Simulation Platform
The “sAGA” a MATLAB based three-dimensional ray tracing tool is used for the simulations. The sAGA tool is indigenously developed by the authors of this paper. Unlike other quasi 3D ray tracing tool, sAGA performs full three dimensional ray tracing. Multipath propagation involves several mechanisms of interactions e.g. reflection, diffraction, transmission, and scattering. The sAGA ray tracing tool uses Image Theory (IT) to find all the possible reflected, diffracted, ground reflected, and rooftop diffracted paths with the given number of reflections and diffractions [10-12]. In case of reflected paths, the loss in energy due to specular reflection is given by the reflection co-efficient and depends upon the incident and the reflected angle of path and material permittivity. Whereas for the diffracted paths the diffraction loss is given by Berg’s recursive model [13]. The energy is scattered in the wide range of directions and the impact of scattering becomes significant at higher frequencies. Therefore, a concentric circle approach given at [14] is used to generate the scattering points on the walls of the building. Ray tracing requires detailed information about the simulation environment and provides accurate results. Three dimensional ray tracing requires 3D map of the simulation environment. The computational complexity of the ray tracing algorithm increases with the increase in the number of supported reflections and diffractions.
A. Simulation Environment
For simulations, a small area from the Yokusuka city of Japan is selected. The Google map view of the targeted area is shown in Figure 1. For outdoor microcellular environment simulation, the parking area of NTT DOCOMO R&D center in Japan is considered, and for indoor simulation the office building is considered in this article.
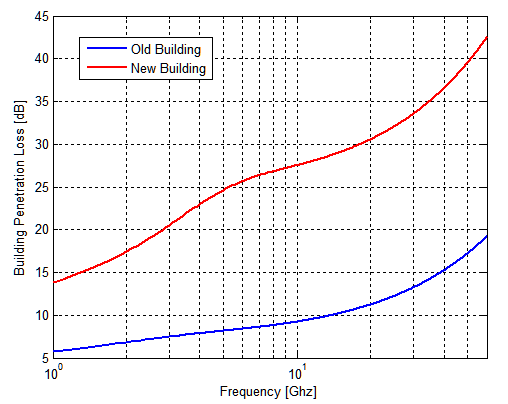
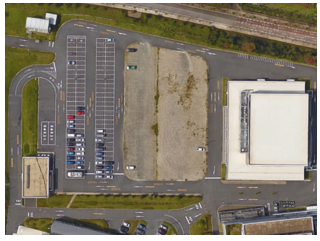 Figure 1. Google map view of targeted area.
Figure 2 illustrates the two dimensional simplified map of the considered area. The simplified map model consists of just five buildings. For outdoor coverage simulations, it is assumed that the MS is mounted on a vehicle at a height of 3.1 m. The MS is driven at the speed of 10 km/h along eight different routes (A1-A8) as shown in Figure 2. For indoor coverage simulations, two paths A9 and A10 are considered. The path A9 is close to the exterior wall of the building, and path A10 is 7 m away from the exterior wall of the building. The location of the transmitter is marked with the blue spot. The transmitter antenna has the azimuth angle of 90 (facing towards North). All the outdoor and indoor simulation routes have a clear LOS with the transmitter. Two outdoor location points are marked as Pt1 and Pt2, and one indoor location point is marked as Pt3 in Figure 2. These static points are selected for Power Angular Spectrum (PAS) analysis.
For PAS simulations, a directive antenna with 14 HPBW in the horizontal domain and 10.5 HPBW in the vertical domain with 20 dBi maximum gain is used. It is assumed that a directive antenna on a receiver side at a height of 1.65 m is rotated by 360 in the azimuth plane with a step size of 4 . For ray tracing, the reflected path with the maximum three reflections, and diffracted path with single diffraction were found. The scatterers are spread over the surface of the walls of the building. The general system simulation parameters are summarized in Table I.
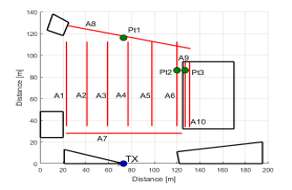 Figure 2. Illustration of simulation area and simulation routes.
Table I. General system simulation parameters for route simulations.
| Parameters | Unit | Value |
| Frequency | GHz | 15/28/60 |
| Single carrier component (CC) bandwidth | MHz | 100 |
| System bandwidth (4 CCs) | MHz | 400 |
| Transmission power per CC | dBm | 27.3 |
| Total transmission power | dBm | 33.32 |
| Transmitter height | m | 8 |
| Antenna downtilt | 13.5 | |
| MS height | m | 3.1 |
| Reflections | 3 | |
| Diffractions | 1 | |
| Diffuse scattering | Enabled |
2.3. Building Penetration Loss (BPL)
The signal experiences a penetration loss while penetrating from the outdoor environment to the indoor environment. Outdoor to indoor penetration loss is generally termed as Building Penetration Loss (BPL). The building penetration loss is the function of frequency and depends heavily on the material characteristics of the building; therefore the BPL can be significantly different for different material types at different frequencies. Generally, the old houses are composed of plane standard glass windows and concrete wall, while the Infrared Reflective (IRR) glass windows are commonly used in the new modern energy saving houses. In reference [15], the old buildings are assumed to have 30 % of the standard glass windows and 70 % of the concrete wall. Similarly, the assumption for new modern building type corresponds to the 70 % of the IRR glass windows and 30 % of the concrete wall.
A simple model structure has been proposed in [15] to model a single material frequency dependent penetration loss. The penetration loss for different material types is provided at [16-20].
The penetration loss for the concrete wall as a function of frequency is modeled as![]()
As the buildings are composite of windows and concrete wall, the building penetration loss for old buildings and new buildings is modeled as shown in (5) and (6), respectively [21].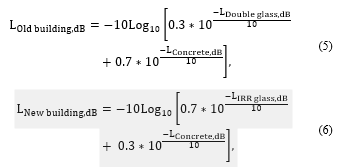
The building penetration loss as a function of frequency for different building types is shown in Figure 3.
Figure 3. Building penetration loss as a function of frequency.
2.4. Indoor Propagation Loss
In an indoor environment, generally the indoor walls are made up of standard glass alternatively plaster. In [15], two different indoor wall loss models are presented as a function of the frequency assuming an average wall distance of 4 m. The Indoor Loss Model 1 assumes an indoor wall of standard glass, whereas Indoor Loss Model 2 is based on the measurements performed in [16]. Two indoor wall loss models are modeled as shown in (7) and (8). Indoor loss as a function of frequency for two different indoor wall loss models, expressed as dB/m is shown in Figure 4.
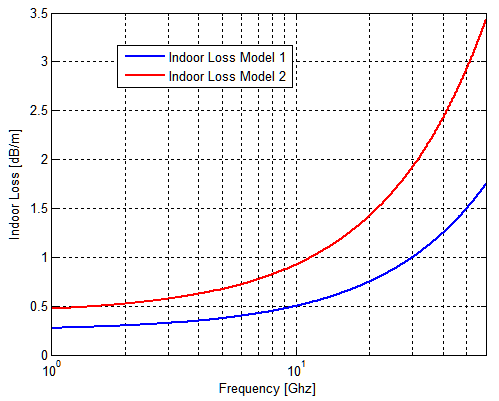 Figure 4. Indoor loss models as a function of frequency.
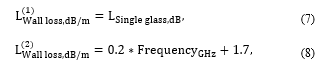
3. Simulation Results and Discussions
Figure 5 shows the received signal strength in dBm for eight outdoor and 2 indoor simulation routes. Figure 5(a), Figure 5(b) and Figure 5(c) shows the received signal strength along the paths at 15 GHz, 28 GHz and 60 GHz, respectively. It can be seen in Figure 5(a) that the maximum received signal strength of around -38 dBm is found in front of the BS antenna in the direction of the main lobe. However, the signal strength starts to degrade as the receiver starts to move away from the transmitter, and deviate from the direction of the main lobe of an antenna. The considered area for simulation was an open environment; therefore the LOS path always existed between the transmitter and receiver. Whereas there are signal fades along the routes due to the constructive and destructive addition of multipaths. The route A1 and A6, and path A2 and A5 are symmetrical and are at almost equal distance from the transmitter. It is interesting to see that the signal strength along the route A6 is better compared with A1 due to more reflected and scattered multipaths from the wall of the nearby building. As soon as the MS crossed the building in route A6, the signal degradation due to the absence of a reflected path is witnessed. The mean received signal level of path A6 is -57.01 dBm at 15 GHz. For indoor paths, old building type is considered. Path A9 is adjacent to path A6. However, due to building penetration loss the mean received signal level for path A9 is -69.78 dBm assuming old building type. The mean received signal level is further drops to -75.12 dBm in case of new building type which consists of IRR glass. Path A10 is located more deep inside the building, and due to additional indoor wall loss the signal strength degrades more rapidly in an indoor environment. The difference between the received signal level at 15 GHz and two other higher frequencies is clearly evident. However, the path loss at higher frequency can be compensated by using the antenna with higher gain.
Table II presents the mean received signal level for the different simulation routes at 15 GHz, 28 GHz and 60 GHz. Considering the outdoor simulation routes, the mean path loss difference of around 5.7 dB and 13 dB was found between 15 GHz and 28 GHz transmission, and between 15 GHz and 60 GHz transmission, respectively. Similarly, for indoor simulation paths the mean path loss difference is around 10.57 dB and 27.82 dB between 15 GHz and 28 GHz transmission, and 15 GHz and 60 GHz transmission, respectively. As stated earlier, that the simulation routes A1 and A6 are symmetrical, however due to the presence of nearby wall for route A6 the mean received signal strength is around 1.25 dB and 1.43 dB better than A1 at 15 GHz and 28 GHz, respectively. Building penetration loss is the function of frequency and therefore the signal experiences higher penetration loss at higher frequencies. A significant difference was found between the received signal level of indoor user located in an old and new building type.
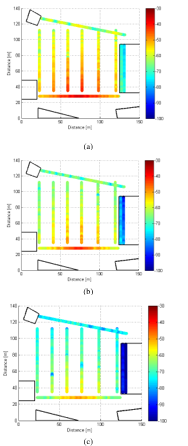 Figure 5. Received signal strength along the simulation route at, (a) 15 GHz, (b) 28 GHz, and (c) 60 GHz.
Table II. Mean RX level.
| Simulation route | Mean RX level (dBm) | ||
| 15 GHz
(dBm) |
28 GHz
(dBm) |
60 GHz | |
| A1 | -58.26 | -64.16 | -70.15 |
| A2 | -54.96 | -60.61 | -68.57 |
| A3 | -53.23 | -58.46 | -65.45 |
| A4 | -52.37 | -58.32 | -66.45 |
| A5 | -53.92 | -60.88 | -66.79 |
| A6 | -57.01 | -62.73 | -70.98 |
| A7 | -45.54 | -51.49 | -59.51 |
| A8 | -63.09 | -67.17 | -74.90 |
| A9 (Old building) | -69.78 | -78.54 | -91.65 |
| A10 (Old building) | -75.12 | -86.20 | -104.4 |
| A9 (New building) | -88.61 | -98.66 | -114.97 |
| A10 (New building) | -93.94 | -106.33 | -127.73 |
Figure 6(a) and Figure 6(b) show the cluster of rays at 15 GHz reaching the outdoor location Pt1 and Pt2, respectively.
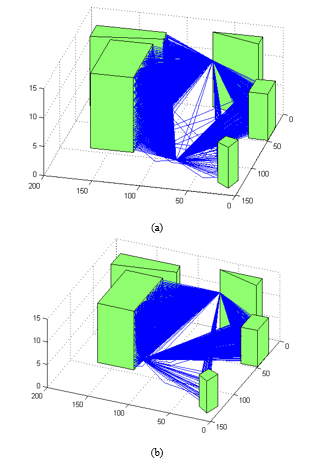 Figure 6. Multipath rays at 15 GHz from TX to (a) Pt1, and (b) Pt2.
The cluster of rays shown in Figure 6 includes wall reflected, ground reflected, diffracted and scattered paths. The impact of diffused scattering is clearly evident, and a considerable amount of energy at receiver points is coming through a large number of scattered paths. In Figure 6(a), the Pt1 is located in the middle of the simulation environment; therefore the walls of the building have clear visibility to the Pt1. Whereas, Pt2 is located closed to the wall of the nearby building, and the building on the right side of the TX does not have visibility to Pt2. Therefore, it can be seen in Figure 6(b) that there is no scattered path from the building on the right side of the transmitter.
Figure 7(a), Figure 7(b) and Figure 7(c) shows the normalized power angular spectrum for location Pt1, Pt2, and Pt3 at 15 GHz, 28 GHz, and 60 GHz, respectively. The PAS shown in Figure 7 confirms that in the LOS condition the major contribution to the total received power comes through the LOS path, and through the specular reflected paths. However, at 28 GHz and 60 GHz the impact of diffused scattering is more significant than 15 GHz. An indoor environment has more scattering components due to nearby walls. It can be seen in Figure 7 that phenomenon of scattering has more significance at higher frequencies specifically in an indoor environment. The Pt1 is located at an azimuth angle of 90 , and therefore at Pt1 the strongest LOS path has a Direction of Arrival (DoA) of -90 as shown in Figure 7. The next strongest path is the reflected path with -44 of DoA.
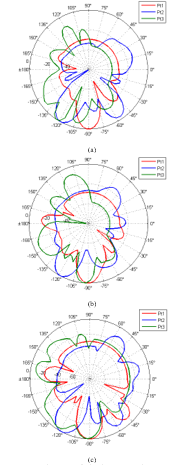 Figure 7. Power angular spectrum for location Pt1, Pt2 and Pt3, (a) at 15 GHz, and (b) at 28 GHz.
The LOS path has a 3D path length of 116 m; whereas the reflected path has a path length of 156 m i.e. 40 m longer than the LOS path. Therefore, the strength of the reflected path is almost 17 dB and 22 dB less compared with the LOS path at 15 GHz and
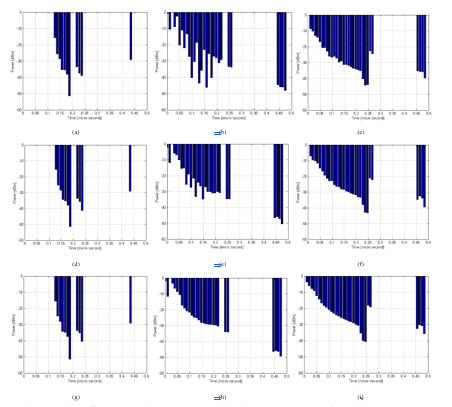 Figure 8. Power delay profile, (a) Pt1 (15GHz), (b) Pt2 (15GHz), (c) Pt3 (15GHz), (d) Pt1 (28GHz), (e) Pt2 (28GHz), (f) Pt3 (28GHz), (g) Pt1 (60GHz),
(h) Pt2 (60GHz), and (i) Pt3 (60GHz).
28 GHz, respectively. However, at 60 GHz due to the presence of a large number of scattering components the composite strength of received signal components at -44 of DoA is almost 10 dB less compared with LOS direction. The Pt2 is located on the right side of the transmitter and has a valid LOS link with the transmitter
In Figure 7, the strongest path (LOS path) has around -120 of DoA and the other reflected path is reaching the receiver at -60 . At Pt2, the direct path has a path length of 98 m, and the reflected path has a path length of 104 m i.e. 6 m longer than the LOS path. Therefore, the strength of the reflected path is around 4 dB and 11 dB less compared with the LOS path at 15 GHz and 28 GHz, respectively. Also, the impact of diffused scattering from the wall at an angle of -60 at 28 GHz and 60 GHz is visible. The considered microcellular case is a simple environment, and not a multipath rich outdoor environment. Therefore, the most of the energy at the receiver points is coming from a narrow direction only. However, in an indoor environment, due to a rich indoor scattering environment the PAS of incoming multipath is wide spread, especially at higher frequencies i.e. 28 GHz and 60 GHz.
Figure 8 shows the Power Delay Profile (PDP) acquired through simulations of location Pt1, Pt2 and Pt3 at 15 GHz, 28 GHz and 60 GHz. For Pt1, the reflected path has 40 m longer path length therefore the reflected path reaches the receiver point with a delay of around 0.125 relative to LOS path, and the signal strength of the reflected path is around 16 dB less compared with LOS path. For Pt1, the power delay profile is almost identical at 15 GHz, 28 GHz, and 60 GHz. The Pt2 is located close to the wall of the building, and therefore the difference of path length between the reflected path and the LOS path is short. By comparing Figure 8(b), Figure 8(e), and Figure 8(h), it can be noted that the reflected path with slightly less signal strength than LOS path reaches the receiver point within a very short delay of 0.01 . Other diffracted and scattered paths from the nearby wall also reach the receiver Pt2 with a short delay period. The power delay profile of Pt2 got smoother at higher frequencies due to a large number of scattering paths at higher frequencies.
Indoor location Pt3 is located nearby the outdoor location Pt2. However, an indoor environment is a scattering rich environment and a larger number of scattering paths reach the receiver point with small delay. Therefore, the PDP of Pt3 is smoother compared with PDP of Pt2. It is interesting to find that the phenomenon of scattering becomes more prominent in higher frequencies, and the power of multipath components with short delay improves at 28 GHz and 60 GHz. The mean delay spread in nanoseconds for static location points are given in Table III.
Table III. Mean delay spread.
| Location | Mean Delay Spread (ns) | ||
| 15 GHz | 28 GHz | 60 GHz | |
| Pt1 | 150 | 150 | 150 |
| Pt2 | 109 | 107 | 106 |
| Pt3 | 124 | 119 | 114 |
4. Conclusion
In this article, a multidimensional analysis of the multipath propagation in an outdoor and indoor microcellular environment has been carried out at higher frequencies i.e. 15 GHz, 28 GHz and 60 GHz, by means of a sophisticated ray tracing tool. The simulations are performed using a simplified 3D map of a small area from the Yokusuka city of Japan. The considered outdoor simulation routes and outdoor static points represent an open environment scenario with valid LOS link between the transmitter and the receiver in a microcellular environment. Indoor simulation routes and an indoor static point were also considered for studying indoor propagation at higher frequencies. The simulation results presented for different simulation routes at 15 GHz are in a close relationship with a measurement results presented in [9]. Similarly at 15 GHz for the selected static points the power angular spectrum (PAS) at receiver end acquired through simulations are in a satisfactory agreement with the measured PAS given at [9]. The power angular spectrum (PAS) at receiver shows the direction of arrival of LOS, specular reflected, diffracted and diffused scattered paths. It was found that mean received signal strength in an outdoor environment for the selected simulation routes at 15 GHz is almost 5.7 dB, and at 60 GHz the mean RX level is almost 13 dB inferior in comparison with the propagation at 15 GHz due to higher propagation loss at higher frequencies. The difference in a mean received signal in an indoor environment between 15 GHz and 28 GHz is extended to nearly 10. 5 dB, and the difference between the mean received signal in an indoor environment between 15 GHz and 60 GHz is further stretched to 28.5 dB due to extra building penetration loss at higher frequencies. However, the higher path loss at 28 GHz and 60 GHz can be compensated by using an antenna with higher gain. The power delay profile acquired through simulations was found helpful in distinguishing the multipath richness of the environment. The indoor was found more scattering rich environment compared with outdoor environment. The absolute values of performance results presented in this article may vary depending upon the modeling impairment, antenna radiation pattern, simulation parameters and simulation environment.
- U. Sheikh and J. Lempiäinen, “Analysis of multipath propagation for 5G system at higher frequencies in microcellular environment,” 2017 13th International Wireless Communications and Mobile Computing Conference (IWCMC), Valencia, 2017, pp. 1660-1664.
- NTT DoCoMo, Inc, “5G Radio Access: Requirements, Concept and Technologies,” White Paper, 2014.
- Huawei Technologies, “5G: A Technology Vision”, White Paper, 2013.
- Dahlman, G. Mildh, S. Parkvall, J. Peisa, J. Sachs, Y. Selén, ”5G radio access,” Ericsson Review, vol. 91, no. 6, pp. 42–48, 2014.
- S. Rappaport , J. N. Murdock and F. Gutierrez , “State of the art in 60 GHz integrated circuits & systems for wireless communications” , Proc. IEEE , vol. 99 , pp.1390 -1436 , 2011.
- G. Larew, T. A. Thomas, M. Cudak, A. Ghosh, “Air Interface Design and Ray Tracing Study for 5G Millimeter Wave Communications” in Proc. IEEE Globecom 2013, Atlanta, USA, 9-13 Dec, 2013.
- Fuschini, H. El-Sallabi, V. Degli-Esposti, L. Vuokko, D. Guiducci and P. Vainikainen, “Analysis of Multipath Propagation in Urban Environment Through Multidimensional Measurements and Advanced Ray Tracing Simulation,” inIEEE Transactions on Antennas and Propagation, vol. 56, no. 3, pp. 848-857, March 2008.
- S. Rappaport, “Wireless Communications: Principles and Practice”, 2nd Edition, 2001.
- Tateishiet al., “Field experiments on 5G radio access using 15-GHz band in outdoor small cell environment,” Personal, Indoor, and Mobile Radio Communications (PIMRC), 2015 IEEE 26th Annual International Symposium on, Hong Kong, 2015, pp. 851-855.
- W. Son, and N. H. Myung, “A Deterministic Ray Tube Method for Microcellular Wave Propagation Prediction Model,” inIEEE Transactions on Antennas and Propagation, vol. 47, no. 8, pp. 1344-1350, August 1999.
- Soni, and A. Bhattacharya, “An Efficient Two-dimensional Ray-tracing Algorithm for Modeling of Urban Microcellular Environment”, in International Journal of Electronics and Communications, vol. 66, no. 6, pp. 439-447, June 2012.
- N. Schettino, F. J. S. Moreira and C. G. Rego, “Efficient Ray Tracing for Radio Channel Characterization of Urban Scenarios,”in 12th Biennial IEEE Conference on Electromagnetic Field Computation, Miami, FL, 2006, pp. 267-267.
- -E. Berg, “A Recursive Method for Street Microcell Pathloss Calculations”, Sixth IEEE International Symposium on Personal, Indoor and Mobile Radio Communications, PIMRC’95, Wireless: Merging onto the Information Superhighway. Vol. 1, 1995.
- Li, “Efficient Ray Tracing Simulation”, Master’s thesis at LUND University, 2014.
- Semaan, F. Harrysson, A. Furuskär and H. Asplund, “Outdoor-to-indoor coverage in high frequency bands”, 2014 IEEE Globecom Workshops (GC Wkshps), Austin, TX, 2014, pp. 393-398.
- Larsson, F. Harrysson, B.-E. Olsson, and J. E. Berg, “An outdoor-to-indoor propagation scenario at 28 GHz,” in 8th European Conference on Antennas and Propagation (EuCAP 2014), The Hague,The Netherlands, April 2014, pp. 3301-3304.
- C. Stone, “Electromagnetic signal attenuation in construction materials, ”NIST Building and Fire Research Laboratory, Gaithersburg, Maryland, NISTIR 6055 Report No. 3 6055, Oct. 1997.
- M. Frazier, “Radar surveillance through solid materials,” in Proceedings of the SPIE – The International Society for Optical Engineering, vol. 2938, Hughes Missile Syst. Co., Rancho Cucamonga, CA, USA, 1997, pp. 139-146.
- Wilson, “Propagation losses through common building materials 2.4 GHz vs 5 GHz,” University of Southern California, CA, Tech. Rep. E10589, Aug. 2002.
- A. Remley, G. H. Koepke, C. L. Holloway, C. A. Grosvenor, D. G. Camell, J. M. Ladbury, R. Johnk, D. R. Novotny, W. F. Young, G. Hough, M. McKinley, Y. Becquet, and J. Korsnes, “Measurements to support modulated-signal radio transmissions for the public-safety sector,” NIST, Boulder, CO, Tech. Rep. Tech. Note 1546, Apr. 2008.
- White paper on “5G Channel Model for bands upto 100 GHz”.