Systematic Tool Support of Engineering Education Performance Management

Adv. Sci. Technol. Eng. Syst. J. 3(1), 418–425 (2018);
 DOI: 10.25046/aj030151
Engineering schools must adopt or develop their own systems and processes for graduate attribute assessment. In this paper, we take a systems engineering approach to graduate attribute assessment and propose a system architecture and tool-supported continuous improvement process with key algorithms and mathematical analysis to process the data and provide performance management reporting. Over several iterations, we have introduced and evaluated improved systems support in a collection of tools called the Graduate Attribute Information Analysis system (GAIA). GAIA integrates course indicators as well as external indicators from a variety of sources. It provides a tool-supported continuous improvement process with templates and notifications for all deliverables. There are sound algorithms and tool support and built-in mathematical analysis for data collection and reporting that includes quantitative and qualitative data; weighted grading; historic trend analysis; improved visualization of results; and standardized reports at both the course level and the program level that can be used either for accreditation or to inform program improvement.
1. Introduction
The Canadian Engineering Accreditation Board (CEAB) requires engineering programs to collect data and assess 12 graduate attributes (GA) as part of a continuous improvement process to ensure the programs are adequately preparing students to be licensed as professional engineers in Canada [1]. The CEAB does not specify how graduate attributes should be measured or how the data should be managed. Engineering schools must adopt or develop their own systems and processes. Radloff, de la Harpe, Dalton, Thomas and Lawson report that for over a decade, academic faculty finds GA assessment challenging [2]. They see the need for faculty to develop a shared understanding of how to integrate GA assessment within the teaching of their courses.
This paper is continuation of the work originally presented in 2017 14th International Conference on Engineering of Modern Electric Systems (EMES) [3]. In this paper, we take a systems engineering approach to graduate attribute assessment and propose a system architecture and tool-supported continuous improvement process with key algorithms and mathematical analysis to process the data and provide performance management reporting. Our research methodology to validate our approach is an iterative combination of action and design science research methodology. We work with the faculty of software, computer and electrical engineering programs in the School of Electrical Engineering and Computer Science at the University of Ottawa to perform graduate attribute assessment, while at the same time identifying gaps, and prototyping improved tool support in our lab. Over several iterations, we have introduced and evaluated improved systems support in a collection of tools called the Graduate Attribute Information Analysis system (GAIA).
In our initial assessment of systems support for graduate assessment at uOttawa, we did not encounter the “academic resistance” discussed by Chanock in his article on developing GA assessment criteria [4]. However, we did identify that existing systems, tools and processes already in place at University of Ottawa School of Engineering tended to complicate rather than support the task. The key issues identified were cognitive overload, lack of clarity, and lack of defined systems and processes.
The first version of GAIA was introduced in 2015 and has progressed through three iterations or versions. The architecture integrates course indicators (such as tests, assignments, quizzes, exams or selected questions) from any learning management system (LMS) as well as external indicators from a variety of sources (such as student surveys, employer evaluation or different types of feedback forms). There is a systematic tool-supported continuous improvement process with templates and notifications for all deliverables. There are sound algorithms and tool support and built-in mathematical analysis for data collection and reporting that includes quantitative and qualitative data; weighted grading; historic trend analysis; improved visualization of results; and standardized reports at both the course level and the program level that can be used either for accreditation or to inform program improvement.
2. Literature Review
We researched and compared solutions from two sources – engineering institutions from countries members of Washington accord; and engineering schools across Canada.
There have been several attempts by different universities to create their own tool that will inform student learning, serve accreditation, and inform program development. In 2004, Maxim describes an assessment plan for student performance in three undergraduate engineering programs – computer science, information systems, and software engineering at the University of Michigan at Dearborn,[5]. It lists course learning outcomes (LO), the measurement instruments used to assess them, student achievement on each particular outcome, and the average score [5]. It gained popularity because of its ability to serve simultaneously as a grade book and LO evaluation tool.
The University of West Georgia, US, created a custom-designed software tool to collect, analyze and report assessment data for program requirements and for accreditation purposes. The tool called COMPASS supported an existing open-source classroom management system by adding the ability to map course LO. It allows for review and analysis of collected assessment data, but lacks a direct reporting feature. The data needs to be retrieved and formatted in order to produce a course assessment report. This complicated the process of data analysis and its implementation for informing program improvement [6].
The Curtin University of Technology in Perth, Australia followed a similar approach in developing the Outcomes Database web-based tool in 2005. It mapped course LO, unit LO, generic graduate attributes and assessment rubrics. The reports it generated helped provide an outcomes focused assessment [7]. Although the paper does not specify any method of tool evaluation, it does show that the Outcomes Database was successfully implemented across courses that share common units in Information Technology, Computer Science and Software engineering.
In his thesis, Essa proposes a custom-developed ABET Course Assessment Tool (ACAT) at the University of Nevada Reno that further improves the Michigan approach [8]. The goal of ACAT is to streamline the course assessment process and standardize reporting. To validate the design and user interface of the tool, Computer Science and Engineering faculty members perform a usability study. Usability of the tool was tested, based on International Organization for Standards criteria [9] that measure effectiveness, efficiency and satisfaction in a specified context of use by specific users. The results showed that the tool created is an improvement over the existing manual process used to assess GA. This study is one of the earliest we have identified that attempts to theoretically compare technology adoption issues between three different tools – COMPASS, Outcomes Database and ACAT. A comparison of the features in two off-the-shelf systems, Compass and Outcomes Database, and the ABET Course Assessment Tool (ACAT), shows 100% compatibility for ACAT, 33.3% for Compass and 66.7% for Outcomes Database.
In 2015, the University of Notre Dame, Australia introduced an outcomes-based curriculum mapping system, Prudentia©. It allows for constructive alignment between different learning outcomes and informs assessment and instructional methodology [10]. The week point of the tool as described by the author is its dependence on the quality of the curriculum framework itself.
Deferent statistical ways to analyze and interpret assessment data was presented by the Office of Academic Planning and Assessment (OAPA) at the University of Massachusetts [11].
Integrating data by cohort using analytical methods and correlations, a method similar to the one used in GAIA, is the subject of collaborative research between Northern Arizona University, Christopher Newport University and James Madison University [12].
Weber addresses the major concern in data analysis – reliability of the results [13]. He explores the use of T-test, ANOVA and ANCOVA to compare different treatments of assessment data for reliability.
Approaches by Canadian universities involve adopting suitable vendor products, adapting tools and processes in place and evolving them into their own learning management system that suits the institutional needs.
A comparison of different GA assessment compatible software tools available on the market was provided in a series of papers by Kaupp, Frank and Watts [14, 15, 16]. Considering the ability of each tool to handle and process data, they classify several outcomes-based assessment support vendor products into five categories – Learning Management Systems (LMS), Learning Content Management Systems (L/CMS), Assessment Platforms (AP), Analytics Systems (AS) and Curriculum Mapping Tools (CMT). Their study concludes that none of the tools is able to manage the GA assessment data independently and they can only address a specific aspect of the GA process [17]. Being distinct from the actual assessment process was identified as a common general weakness for all vendor tools. Issues like duplication of grading, need for uploading/re-entering data by instructors, agreement with other tools or systems or data record forms and most of all incompatibility with diverse nature of student assessment turns them into an additional tool rather than major carrier of assessment analysis for program improvement. Furthermore, the authors compiled evaluation criteria for tool adoption identifying that popularity of the tool should not be used as measure for its functionality. The choice should rather be made based on the compatibility of the tool with institutional needs and systems.
Identifying the process of measuring GA performance as the most difficult step in meeting accreditation requirements. Saunders and Mydlarski from McGill University discuss adopting current institutional resources and evolving them into a software information system [18].
Queen’s University, University of Calgary, University of Toronto, Concordia University, University of British Columbia, University of Manitoba and Dalhousie University outlined and compared their institutional approaches to accreditation requirements in a joint publication [19]. In the research, Concordia University is identified as one of the first Canadian engineering schools to develop their own Learning Management System when enabled them to collect data and allow for sharing between users.
Developing our algorithms, we explored the different ways for administering assessment data presented by Carleton University [20], University of Alberta [21] and University of Calgary [22]. Carleton University and University of Alberta merged the twelve CEAB graduate attributes with respective indicators, measures and rubrics. University of Alberta adds an additional step to the process by involving sub-categories associated with learning objectives.
3. GAIA
Engineering programs in Canada need to demonstrate that their graduates possess twelve specific attributes [23]: engineering knowledge; problem analysis; investigation; design; use of engineering tools; individual and teamwork; communication skills; professionalism; impact of engineering on society and the environment; ethics and equity; economics and project management; life-long learning. An Accreditation Board (AB) Report indicates that accreditations completed in 2015 were the first ones, which included Graduate Attribute Assessment and Continual Improvement compliance [24].
In developing the architecture for GAIA we had the following objectives:
- find a way to use (when possible) and/or modify (when needed) assessment tools and rubrics already in place;
- integrate GAs, key performance indicators (KPI), assessment tools, measurement criteria, course information sheets, data collection and analysis into one information system;
- measure GA performance and allow data to inform a continuous improvement process for each program
- generate reports and perform mathematical analysis to inform program improvement;
- be user-friendly and time-efficient;
- minimize cognitive overload for any data collection or analysis task.
3.1. System Architecture
GAIA provides three types of performance management support – collecting data, processing data and generating reports. Figure 1 below shows the GAIA architecture. It includes an academic platform (faculty administrator, program coordinator, program professors, course professors and students) focused on in-class evaluation and a non-academic platform (employers, co-op office, alumni and students) focused on evaluation mechanisms external to the class room. Data collected through the Academic Platform (AP) is associated with program-related courses and traditional courses typically supported by a Learning Management System (LMS). The Non-Academic Platform (NAP) deals with all other sources of data using Registration Management System (RMS), university-run surveys and outside survey sources. GAIA’s performance is managed by a system administrator to assure regular assessment data flow and support reporting of results in a timely manner.
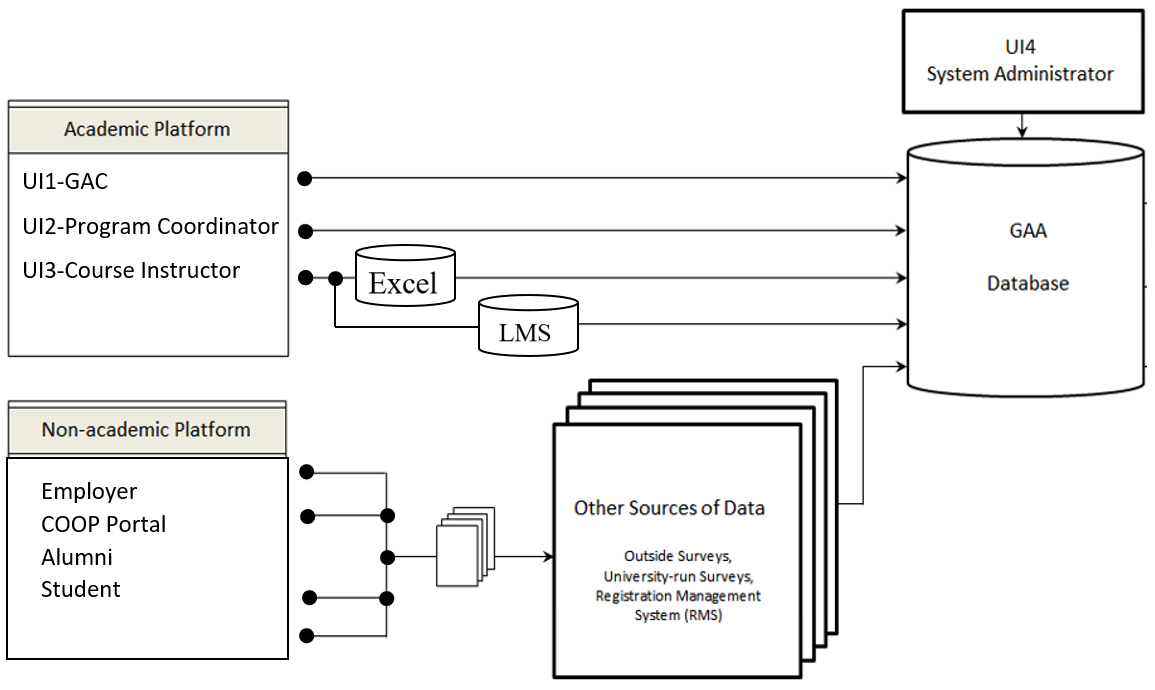 Figure 1: GAIA Architecture
Tool support needs to provide the GAA database (DB) with four types of user interfaces – Graduate Attribute Committee (GAC, UI1), program coordinator (UI2), course instructor (UI3) and system administrator (UI4). Furthermore, it needs to accommodate data fed by different machine interfaces for learning management systems (LMS) and tools already in place for the process of data recording and reporting, as well as qualitative data reported through the COOP portal.
Figure 2 shows the data processing performed by GAIA. It uses different algorithms to process graduate attribute assessment data and generate reports for accreditation agencies in addition to supporting a continuous improvement process for each engineering program. It applies different algorithms to process qualitative and quantitative data input by faculty directly, or imported from a variety of sources. We have identified four MI sources for GA assessment data – LMSs, COOP portal, employer evaluation reports and student surveys. GAIA’s architecture pulls external data from these sources in three different ways:
– Using CSV files
– SQL server
– ODBC compliant sources
GAIA’s architecture also supports Excel’s External Data feature. Once data is initially placed at the location selected by the user, the Refresh button from the Excel Data tab allows for automated updates reflecting data changes at the source. This process is usually set up and performed by the system administrator. GAIA also allows the use of Open Database Connectivity (ODBC) as a programming interface to pull data from different database management systems (DBMS) such as Blackboard or D2L, both currently used at the University of Ottawa.
3.2. Tool Supported Continuous Improvement Process
GAIA supports a systematic continuous improvement process for each program. Creating and implementing improvement steps are initiated and overseen by the members of respective Program Curriculum committees. Success is reported and gaps identified based on consecutive cycles of data analysis performed supported by GAIA as shown in Figure 3 below.
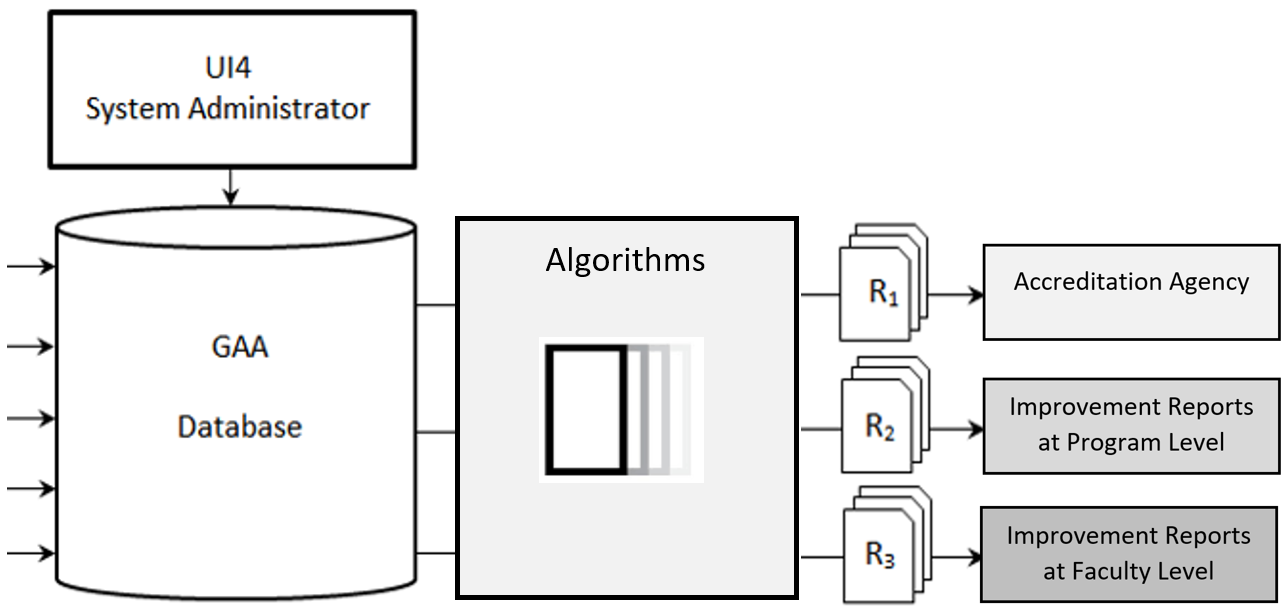 Figure 2: Data Processing for Reporting
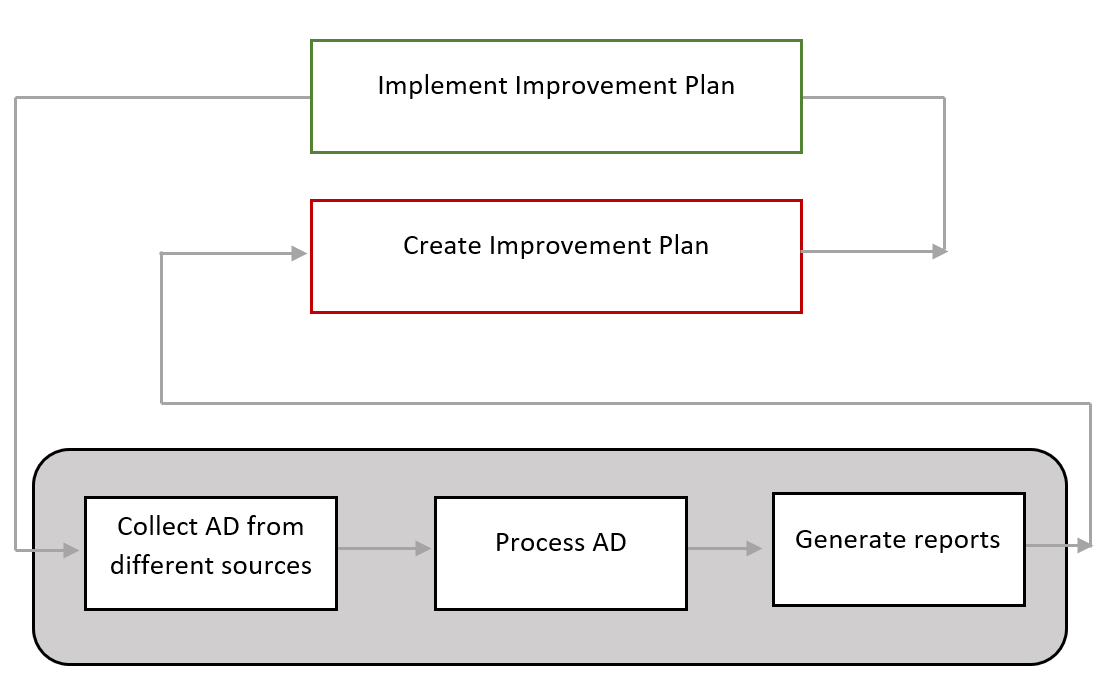 Figure 3: GAIA-supported Continuous Improvement Cycle
The top-down approach, illustrated in Figure 4, mandated by a common continuous improvement process (CIP) leads to a common set of indicators that can be shared across programs. There is a standardized program report that charts a common set of indicators across the 12 graduate attributes. The data for those indicators is obtained from measuring student achievement on the learning outcomes compiled into the common set of high-level indicators specified in the Program Reports. Initially, each program had its own set of performance indicators, which was problematic when trying to achieve consistent reporting at the faculty level that could support cross-program comparisons. Each program aggregated data is clustered into three levels:
– Level I (Course Level): Learning Outcomes presented at the bottom row in Figure 4;
– Level II (Program Level): Performance Indicators, indicated in Figure 4 in black ovals;
– Level III (Meeting Accreditation Requirements): Graduate Attributes analysis for accreditation and program improvement.
At level III we have the 12 graduate attributes specified by CEAB for graduate attribute assessment. Each program has its own set of measurement criteria used to report on achievement for a particular performance indicator (KPI). Selected KPIs are integrated to report on respective graduate attributes (GA). Those indicators are determined by the measurement of learning outcomes for particular courses. The compilation into indicators is mandated in a standardized fashion by the faculty to ensure that achievement is reported in a consistent fashion within a standardized process of continuous improvement.
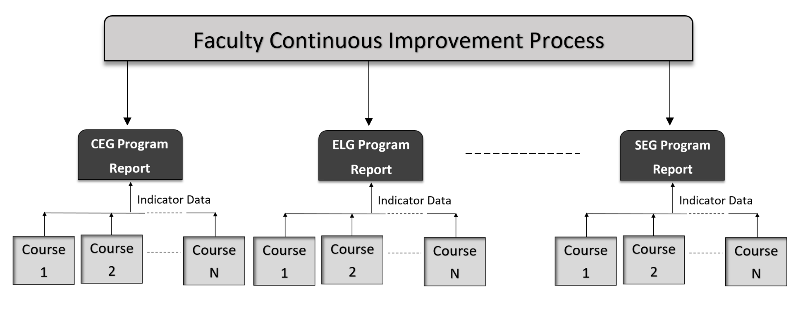 Figure 4. Faculty Continuous Improvement Process.
3.3. Tool-Supported Data Collection and Reports
GAIA provides data collection and reports at two different levels using Course Data Entry Form (CDEF) for individual courses and the Program Report Form (PRF) for an entire engineering program. Data for CDEF is provided by UI3 or input through CVS, SQL server or ODBC compliant sources. Data to Data for PRF is automatically processed and integrated from all the CDEFs for a program. CDEF provides reports and analysis for individual courses. PRF provides reports and analyses across the entire program.
As discussed in section 3.1, GAIA generates three major types of reports – reports for accreditation, improvement reports at program level and improvement reports at faculty level. They are presented in table and graph forms to improve visibility and usefulness. Different tool components, algorithms and data sources are involved in each.
A compiled data report is generated at course level and reflects GA achievement for courses which typically take two semesters to complete. Example for such course is a capstone project. Figure 5 and Figure 6 show a sample report generated for the purpose of this paper in table and graph form respectively.
 Figure 5. CDEF Table Report Form.
As illustrated in Figure 5 above the report uses color coding to better indicate the level of achievement for the course toward accreditation requirements. Using the CEAB meeting requirements scale with 60% – 80% boundaries. All courses that show achievement per GA below the lower bound did not meet expectations. Their status is shown in red. Above the upper bound of 80% indicates exceeding expectations (shown in dark green shading). The accepted level for meeting accreditation requirements is indicated in light green.
The current statistics graph illustrated in Figure 7, provides a graphical presentation of a historic trend of data collected for selected course. It allows for easy comparison of achievement for an entire accreditation cycle and gives a better visualization of the overall graduate attribute assessment against meeting accreditation requirements. The Report button allows users to see a historic trend of data in table form.
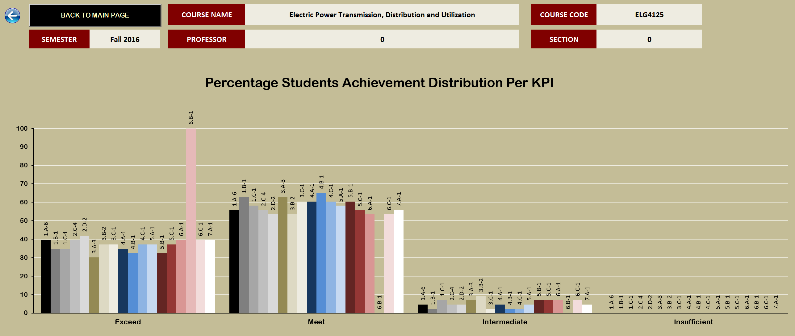 Figure 6. CDEF Graph Report Form.
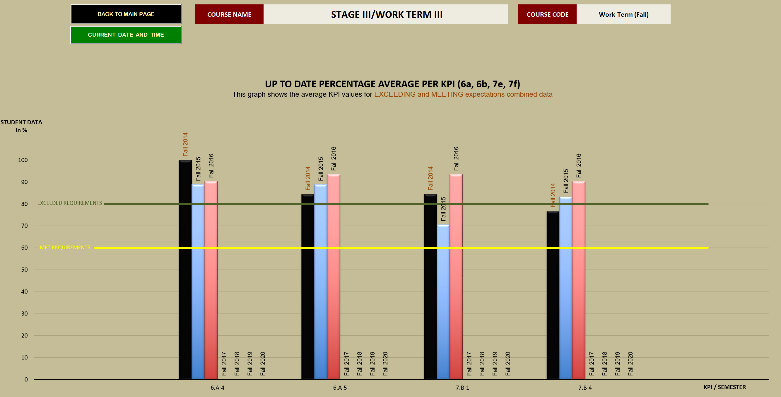 Figure 7. CDEF Current Statistics Report Form.
The Program Report Form (PRF) provides similar statistics which reflect achievement at program level. These reports are used by the curriculum committee members to inform program improvement. The PRF is a read-only workbook. It collates the assessment data provided by CEDF for all courses on a semester basis. This component of the tool measures and reports the cumulative impact individual courses have on overall program performance. It is generated in table and graph form per graduate attribute. A sample report is shown on Figure 8.
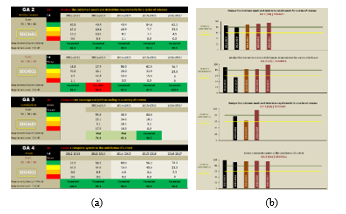 Figure 8. PRF generated report (a) table form, (b) graph form.
A special report form is used to track COOP work-placement data. Data is fed into GAIA from the University of Ottawa COOP Portal using CVS, SQL server or ODBC compliant sources. The report is used to inform on students’ ability to secure their first COOP position. A sample of such report form is simulated for the purpose of this paper and is shown on Figure 9.
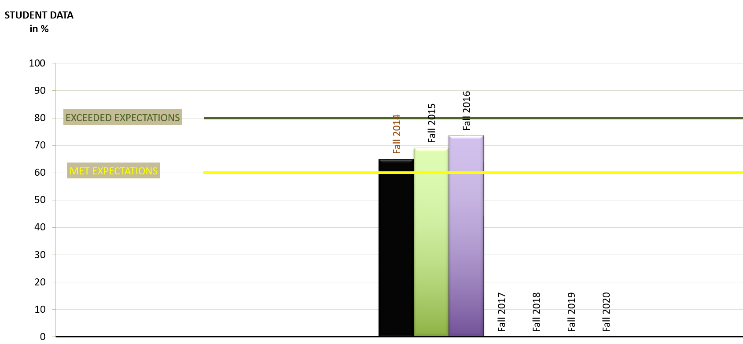 Figure 9. Work-Term Placement Data Report Form.
GAIA allows for comparison between cohorts by generating two reports: the Graduate Attribute Report per Cohort (GAR/C) and the Course Progression Report per Cohort (CPR/C). The former arranges averaged GA data per attribute, while the latter tracks students’ achievement as student progress in their program. Data from both cohort reports are used for comparison to provide a historic data trend for further curriculum development. Furthermore, the COOP Progress Report per cohort (COOPR/C) adds reliability in analyzing students’ employability and professional skills assessment provided by employers. Table 1, Table 2 and Table 3 below illustrate the datum of cohort reports. It is based on SEG course sequence selected by the program GA Committee to report on GA achievement. Color codes indicate the relative level of the course within the program as follows:
– blue shading is used for Year 5 courses
– green shading is used for Year 4 courses
– peach shading is used for Year 3 courses
– magenta shading is used for Year 2 courses
– no shading is used for Year 1 courses
Table 1. Graduate Attribute Report per Cohort (GAR/C)
| Graduate Attribute | ||||||||||||
| Courses | GA1 | GA2 | GA3 | GA4 | GA5 | GA6 | GA7 | GA8 | GA9 | GA10 | GA11 | GA12 |
| SEG
3101 |
SEG
3101 |
SEG
3103 |
SEG
4911 |
SEG
2105 |
SEG
2105 |
SEG
2911 |
SEG
4911 |
SEG
2911 |
SEG
2911 |
SEG
4105 |
SEG
4911 |
|
| SEG
4911 |
SEG
3101 |
SEG
4105 |
SEG
4911 |
SEG
1911 |
SEG
1911 |
|||||||
| SEG
3102 |
SEG
4911 |
|||||||||||
Table 2. Course Progression Report per Cohort (CPR/C)
| Academic Year | |||||
| Course | Year 1 | Year 2 | Year 3 | Year 4 | Year 5 |
| SEG1911 | SEG2105 | SEG2106 | SEG3101 | SEG4911 | |
| SEG3103 | SEG2911 | SEG3102 | SEG4105 | ||
| SEG3125 | SEG4145 | ||||
Table 3. COOP Progress Report per Cohort (COOPR/C)
| Academic Year | ||||
| Year 1 | Year 2 | Year 3 | Year 4 | Year 5 |
| SEG1911 | COOP Placement I | SEG2901 | SEG3901 | SEG3902 |
To illustrate the mechanism of data sorting behind the three cohort reports we generated random data that is being used for demonstration purposes in all tables and graphs. To follow the course progression within a cohort GAIA combines a historic trend data per respective courses according to the course sequence of the specific engineering program (i.e. software engineering in this sample). To generate GAR/C GAIA for cohort N, GAIA will use Year (N) data for SEG4911 and SEG4105, Year (N-1) data for SEG3101, SEG3102 and SEG4145; Year (N-2) data for SEG2106 and SEG2911; Year (N-3) data for SEG2105, SEG3103, SEG3125; and Year (N-4) data for SEG1911. This is illustrated in Table 4 below.
Table 4. Use of historic trend data for generating cohort reports
(GAR/C and CPR/C)
| Cohort (Year) | Course | Graduate Attribute |
| GA Data (N) | SEG4911 | 2, 4, 6, 7, 8, 12 |
| SEG4105 | 6, 11 | |
| GA Data (N – 1) | SEG3101 | 1, 2, 5 |
| SEG3102 | 5 | |
| SEG4145 | 11 | |
| GA Data (N – 2) | SEG2106 | Xxx |
| SEG2911 | 7, 9, 10 | |
| GA Data (N – 3) | SEG2105 | 5, 6 |
| SEG3103 | 3 | |
| SEG3125 | Xxx | |
| GA Data (N – 4) | SEG1911 | 8, 12 |
The data-supported framework for cohort reports is illustrated in Figure 10. It represents a combination of methodologies described in Figure 1, Figure 2, Figure 4 and Table 4.
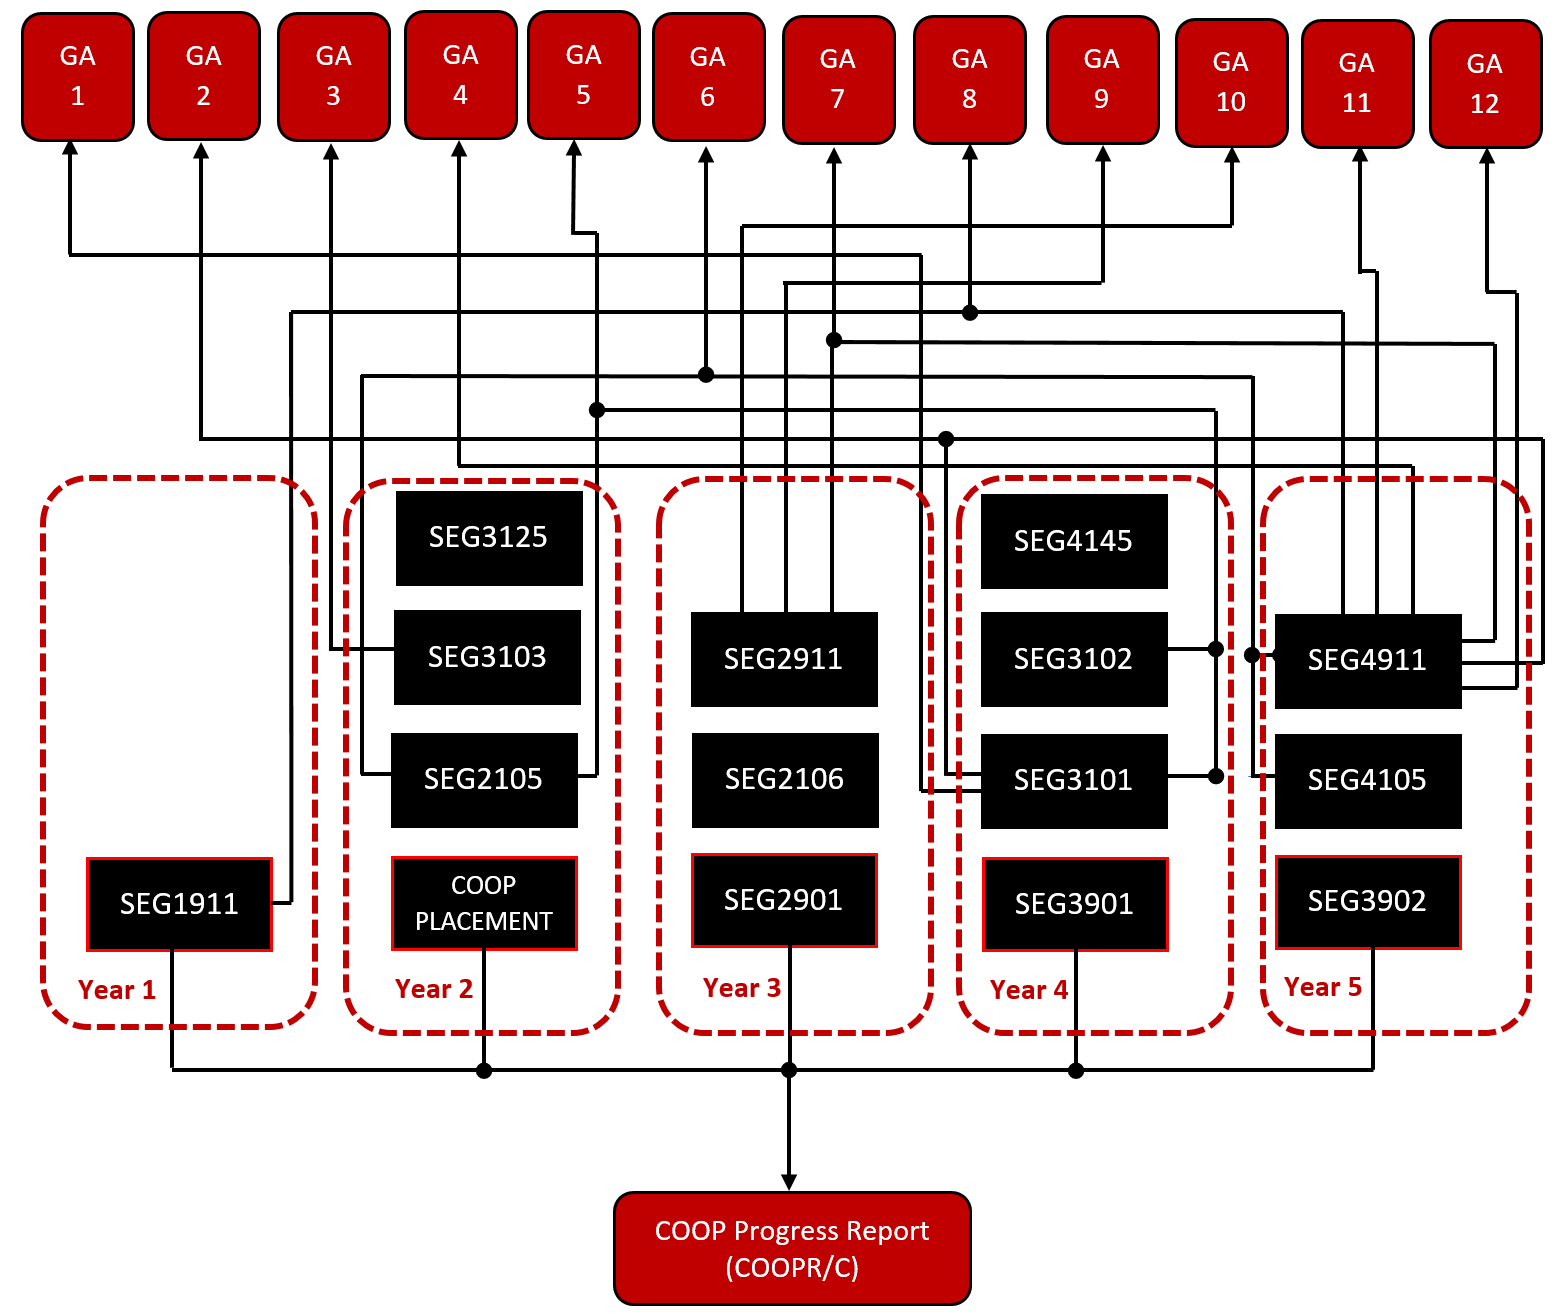 Figure 10. Data-Support Framework for Cohort Reports.
4. Results and discussion
GAIA’s improvement and further development is based on ongoing research on latest developments in the area of data management and analytics and the input provided by its users. Mapping the goals stated in section 3 has enabled us to establish an ongoing user-centered tool evaluation. It addresses the different users (U1, U2, U3 and U4 as listed in Figure 1) targeting their specific context of use. Thus, GAIA needs to reflect specific user requirements and specific program requirements for each
university actor. The GAA DB needs to accommodate different types of input data, analyze qualitative and quantitative data, and produce reports has to meet the latest accreditation requirements and inform a continuous program improvement process. Input on the report efficiency and efficiency of the improvement process are being provided by the GA Committee members per program. The ongoing evaluation process as described above is illustrated in Figure 11.
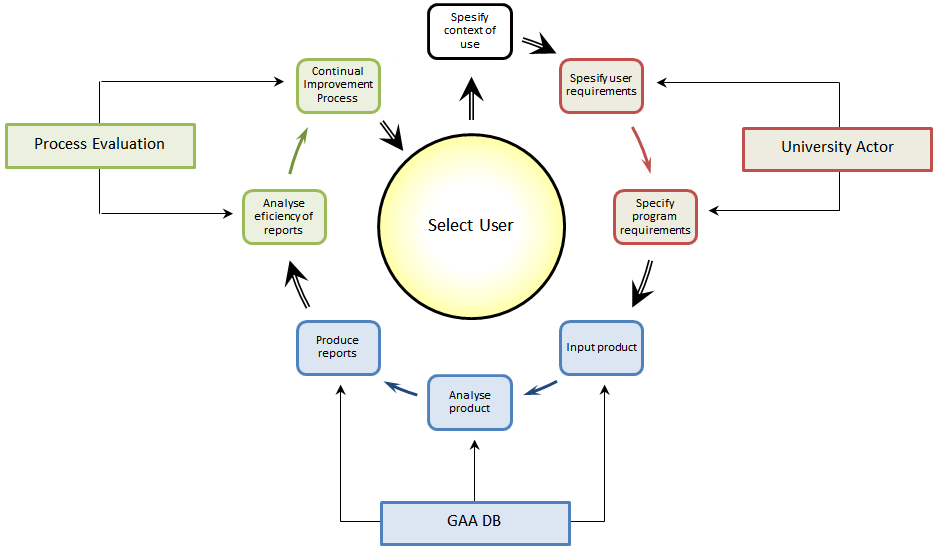 Figure 11. User-Centered Tool Evaluation Process
The following list of evaluation criteria are used for tool evaluation:
4.1. Perceived Ease of Use (PEOU)
This is a core variable, which measures the degree of belief that mastering the tool will not require any extra effort. In the TAM 2 model this construct is defined as a direct determinant of perceived usefulness [25]. Example for its use in academia is the study performed by Park in 2009 [26].
4.2. Perceived Usefulness of the Tool (PU)
Perceived Usefulness is the degree to which a user believes the tool will help successfully complete the task and excel at their job performance. This is a core variable, used to measure adoption in academia assessing learning performance, academic productivity and supporting learning process [26].
4.3. Attitude Toward Using the Tool
The attitude toward use measures the user’s feeling about performing the task using the tool. It shows the user’s desire to actually use the tool, their positive or negative evaluation of performing the behavior. It measures the ability to perform the task faster, improve user performance when using the tool, using the tool is related to increase of productivity and effectiveness. As a core variable, it is a part of almost every TAM construct set. Samples for its use in academia can be found in the studies by Kim, Park and Tsai [26, 27, 28].
4.4. Behavior Intention to Use the Tool (BI)
It measures the strength of the user’s intention to use the tool or the degree of one’s willingness to use the tool. It is one of the best indicators of the real usage of the tool. In other words, the actual use depends on the user’s intentions to apply effort. It is a combined measure of the wish to finish the task and planning its use in the future.
4.5. Perceived Usage of the Tool
This is the amount of time interacting with the tool and the frequency of its use. Measuring this variable has highest importance for Faculty Administrator (UI1) as manager interested in evaluating the impact of the tool as a whole.
4.6. Experience Using the Tool
Prior experience was identified as a determinant of behavior in 1980 by Ajzen and Fishbein long before Davis proposed the technology acceptance model [29]. Measuring the variable is mentioned in several studies [30, 31]. According to the studies, experienced users show strong correlation to perceived usefulness of the tool and the behavioral intention to use the tool. Being related to the number of years using the tool, this construct provides valuable information in terms of university users being ready to deal with measuring graduate attributes an ongoing process in a long term.
4.7. Complexity of the Tool
This variable measures the extent to which the user expects to use the tool without any additional effort. It has to do with the tool being difficult to understand and use. Complexity is measured in terms of time taken for the task and integration of tool usage results into existing tool. Complexity is inversely proportional to perceived usefulness (PU) and perceived usage as aspects of adoption. It is also measured by the extent to which the user realizes the possibility of computer crash or data loss.
4.8. Mandatory versus Voluntary Use of Tool
This variable is measured by the extent to which adoption is perceived as a mandatory or non-mandatory task. It is positively related to the behavioral intention to use the tool. In our particular case, the use of the tool is mandatory (requirements enforced by CAEB), so definitely imposed on Faculty Administrator (UI1) and Program Coordinator (UI2). Therefor this variable is not-applicable for them and should be noted as such in their respective evaluation criteria. Participation is mandatory for UI1 and UI2. It becomes mandatory for UI3 if their course is included. At the same time, UI3 cannot easily be coerced for tenured professors so UI3 adoption is critical. Similarly, indirect UI for students, employers etc. cannot be coerced so adoption into process is also critical. The point of this is how to weight the importance of various aspects of the tool. The reporting to CEAB is mandatory and critical so that UI adoption is both constrained and important, but adoption by administrator and coordinator will be coerced so not so critical.
4.9. Interoperability
This measure the tool compatibility with other systems or tools used simultaneously.
4.10. Handling Assessment Data
This measure reflects on tool’s ability to serve as database and allow for historic trends of analysis and comparison. The ability to use quantitative and qualitative data is to be evaluated as well.
4.11. Reporting Ability
Tests the tool against its ability to produce reports on course and program levels. Quality of reports and their use to inform program improvement is part of this criteria.
4.12. Alignment with CEAB accreditation requirements
This construct provides direct information on the user’s belief that the work performed will serve the need it was intended for. Analysis of the results will have a wide range of application – from indication for improving the tool, to explanation about the user’s attitude and perceived intentions
5. Conclusions and Future Work
Creation of GAIA reflected the need for our engineering programs to respond to CEAB accreditation requirements. Ever since it follows the changes implemented to the criteria to provide best support for reporting graduate attributes. Flexibility of the tool and the fact that it is onside made allows for immediate modifications to take place. It is constantly improved following the requests and recommendations from instructors, program coordinators or faculty administrators as well.
In future work, a structural equation model showing the relation between major and external variables in terms of hypotheses will be added. Such a graphical representation of the research model will clearly show the relationships between constructs and specify hypotheses with respect to those relationships. The structural equation modeling (SEM) technique can be employed using the LISREL program. Then direct/indirect effect and t-values will have to be calculated to identify the state of each hypothesis as “Supported” or “Not-supported”. Secondary future research will also include further improvement of the model and and more case studies to validate. The goal will be to achieve technology adoption results consistent with expectations. Such results will allow us to measure the tool satisfaction level and predict its usability in specifically constrained contexts.
Conflict of Interest
The authors declare no conflict of interest.
Acknowledgment
We would like to acknowledge funding from NSERC and the School of Electrical Engineering and Computer Science at the University of Ottawa which supported this research. We would especially like to thank Claude D’Amours, Emad Gad, Voicu Groza, Stéphane Somé and Marc-André Daoust for their partnership and support.
- Engineers Canada, “Canadian Engineering Accreditation Board Accreditation Criteria and Procedures,” 2014, pp. 1-118. Engineers Canada, Ottawa, ON, K2P2K3, ISSN 1708-8054
- Radloff, Barbara de la Harpe, Helen Dalton, Jan Thomas, Anne Lawson, “Assessing Graduate Attributes: Engaging Academic Staff and their students,” in ATN Assessment Conference 2008: Engaging Students in Assessment, 2008, p. 90.
- George, L. Peyton, V. Groza, “Graduate Attribute Information Analysis System (GAIA) – From Assessment Analytics to Continuous Program Improvement Use of Student Assessment Data in Curriculum Development and Program Improvement” in 14th International Conference on Engineering of Modern Electric Systems (EMES), Oradea, Romania 2017. https://doi.org/10.1109/EMES.2017.7980398
- Chanock, “Developing criteria to assess graduate attributes in students’ work for their disciplines,” J. Learn. Dev. High. Educ., no. 6, p. 16, 2013.
- Bruce R. Maxim, “Closing the loop: assessment and accreditation”, Journal of Computing Sciences in Colleges, vol. 20, issue 1, October 2004, pp. 7-18.
- Abunawass A., Lloyd W., Rudolph E., “COMPASS: a CS program assessment project”, ACM SIGCSE Bulletin, vol. 36, issue 3, September 2004. Pp. 127-131, NY, USA. {DOI: 10.1145/1026487.1008031}.
- Konsky B., Loh A., Robey M., Gribble S., Ivins J., Cooper D., “The Benefit of Information Technology in Managing Outcomes Focused Curriculum Development Across Related Degree Programs”, Eighth Australasian Computing Education Conference (ACE2006), Hobart, Tasmania, Australia, January 2006.
- Eugene O. Essa, “ACAT: ABET Course Assessment Tool,” University of Nevada, Reno, 2010, 73 pp., 2010. Available as of Apr. 19, 2017 from http://csi.fau.edu/wp-content/uploads/2013/03/Essa_ACAT_MS-Thesis_U-of-Nevada_Reno_2010.pdf
- ISO 13407, “Human-centered design processes for interactive systems”, International Standards, Reference number ISO 13407:1999(E), www.isostandards.com.au. Summary online. Accessed July 10, 2016 from http://www.ash-consulting.com/ISO13407.pdf
- Steketee C., “Prudentia©: An outcomes curriculum mapping system”, Teaching and Learning Forum 2015 – Teaching and Learning Uncapped, Category Professional Practice, pp. 9, 2015.
- Stassen, K. Doherty and M. Poe, “Program-based review and assessment. Tools and technoques for program improvement”, Umass Amherst, pp. 1-62, Fall 2001
- L. Pieper, K. H. Fulcher, D. L. Sundre and T. D. Erwin, “What do I do with the data now? Analyzing assessment information for accountability and improvement”, Research and Practice in Assessment, vol. 2, Issue 1, pp. 1-8, Jan. 2008
- Weber, “Quantifying student learning: How to analyze assessment data”, Ecology 101, pp. 501-511, October 2009
- Kaupp, B. Frank, and C. Watts, “Evaluation of software tools supporting outcomes-based continuous program improvement processes,” in 2013 Canadian Engineering Education Association (CEEA13) Conf., 2013. https://doi.org/10.24908/pceea.v0i0.4861
- Jake Kaupp and Brian Frank, “Evaluation of Software Tools Supporting Outcomes-Based Continuous Program Improvement Process. Part II,” Canadian Engineering Education Association (CEEA14) Conf. 2015. https://doi.org/10.24908/pceea.v0i0.5856
- Kaupp and B. Frank, “Evaluation of software tools supporting outcomes-based continuous program improvement processes. Part III,” in 2015 Canadian Engineering Education Association (CEEA15) Conf., 2015. https://doi.org/10.24908/pceea.v0i0.5764
- Chanock, “Developing criteria to assess graduate attributes in students’ work for their disciplines,” J. Learn. Dev. High. Educ., no. 6, p. 16, 2013.
- Saunders and L. B. Mydlarski, “Evolution of graduate attribute assessment and continuous program improvement in the Faculty of Engineering at McGill University,” in 2015 Canadian Engineering Education Association (CEEA15) Conf. 2015. https://doi.org/10.24908/pceea.v0i0.5763
- Kaupp, B. Frank, R. Brennan, S. Mccahan, L. Narayanan, P. Ostafichuck, N. Sepehri, and K. C. Watts, “A Comparison of Institutional Approaches to CEAB Graduate Attribute Requirements” in Canadian Engineering Education Association (CEEA12) Conf., 2012. https://doi.org/10.24908/pceea.v0i0.4642
- Harris, D. Russell, and A. Steele, “Progress on Defining the CEAB Graduate Attributes at Carleton University, in Canadian Engineering Education Association Conference, 2011. http://dx.doi.org/10.24908/pceea.v0i0.3628, pp. 1-5, 2011
- Csorba, D. Chelen, N. Yousefi, N. Andrews, and C. More, “Graduate Attributes at the University of Alberta,” a report of the Committee on the Learning Environment (CLE) Subcommittee on Attributes and Competencies, http://www.provost.ualberta.ca/en/~/ media/provost/Documents/Information/GraduateAttributes.pdf, pp. 1-22, June 5, 2013
- “UC Graduate Attributes Framework”, Faculty of Science, U of Calgary, http://www.ucalgary.ca/science/teachinglearning/graduate_attributes_framework, 2017
- CEAB, “2014 Canadian Engineering Accreditation Board Accreditation Criteria and Procedures”, pp. 118, ISSN 1708-8054, Engineers Canada, 2014. Online “https://engineerscanada.ca/sites/default/files/2014_accreditation_criteria_and_procedures_v06.pdf. Accessed February, 2018.
- Iachiver, G., “Accreditation Board Report, EC Board Meeting – September 30, 2015, https://engineerscanada.ca/sites/default/files/AB-Report-September-2015.pdf
- Venkatesh V. and Davis D., “A Theoretical Extension of the Technology Acceptance Model: Four Longitudinal Field Studies”, Management Science © 2000 INFORMS, vol. 46, no. 2, Feb., 2000, pp.186-204.
- Park S., “An Analysis of the Technology Acceptance Model in Understanding University Students’ Behavioral Intention to Use e-Learning”, Educational Technology & Society, 2009, vol. 12, issue 3, pp. 150–162.
- Kim Y., Chun J., Song J., “Investigating the role of attitude in technology acceptance from an attitude strength perspective”, International Journal of Information Management, Volume 29, Issue 1, February 2009, Pages 67–77.
- Tsai Wen-Chia, “A study of consumer behavioral intention to use e-books: The Technology Acceptance Model perspective”, Innovative Marketing, Volume 8, Issue 4, 2012.
- Ajzen I., Fishbein M., “Understanding attitudes and predicting social jj..abehavior”, Prentice Hall, 1980, pp. 278. {ISBN: 0139364439, 9780139364433}.
- Yang, H.-d., and Yoo, Y. “It’s all about attitude: revisiting the technology acceptance model,” Decision Support Systems, vo.38, issue 1, Oct 2004, pp. 19-31.
- Alharbi S., Drew S., “Using the Technology Acceptance Model in Understanding Academics Behavioural Intention to Use Learning Management Systems “, (IJACSA) International Journal of Advanced Computer Science and Applications,Vol. 5, No. 1, 13, 2014.