Fuel Cell/ Super-capacitor power management system assessment and Lifetime Cost study in a 500kVA UPS

Adv. Sci. Technol. Eng. Syst. J. 3(2), 220–230 (2018);
 DOI: 10.25046/aj030226
A 500 KVA Uninterruptible power supply (UPS) using Fuel Cells (FC) and super-capacitors (SCs) was studied with the worst case of 10 minutes and eight hours of interruption per day. A power management system was established to control the FC and the SCs in order to extract the hybridization benefits with a comparison between a Proton exchange membrane FC (PEMFC) working alone and another combined with SCs. Moreover, possible FC degradations were discussed. The start/stop cycling, the high-power loads and load changes degradations were taken into consideration in order to estimate the FC lifetime span using a prediction formula. Besides, the FC costs were studied to estimate the best average cost. Finally, the SCs filter constant time and their charging currents were revealed.
1. Introduction
UPS have reached mature levels in term of electrical power quality provided to sensitive loads despite power disturbances and outages. It is available on the market in a wide range depending on their ratings; from 300VA to provide back up for a computer to several megawatts for an entire building.
Most backup power systems technologies involve engine-generator sets and lead-acid battery either with SCs systems or without such systems. Although the engine-generator sets are reliable and last for long runtime, they depend on the availability of fuel, require excessive maintenance and cause a lot of pollution. Besides, batteries are unsuitable for long runtime; they last for limited life span, are very sensitive to temperature and have got power fluctuations which lead to lifetime and capacity uncertainty but they involve low capital investment.
Further improvement FC technology will be a real boost for UPS for low and high-power applications. They are emerging as a valuable alternative to engine generator sets and lead-acid batteries in backup power systems. FC have high specific energy and reliability and present no pollution to the environment. PEMFC are the most common thanks to their relatively fast response and low operating temperature.
The FC lifetime can vary significantly from an application to another, ranging from 4.000 h approximately for intermittent operation to 40.000 h for stationary applications [1]. But the most common drawback of FC is their high cost which is an important criterion for any project.
The FC durability is defined by the end of life (EoL) concept related to the inability to guarantee a minimum performance or to ensure basic operations. Thus, the FC EoL can be defined by the observation of a failure or a certain loss in performances. In case of failure, the user needs a complex and unexpected maintenance in order to bring the system back to its normal operational conditions. Failure is the most undesired situation; it should be prevented in advance by detecting these events. On the other hand, the loss in performances leads to a degraded mode implying reduction of power capacity or overconsumption. It has been proved that the aging effect causes the cell degradation in performances, which means that an old stack needs a higher amount of hydrogen than a new one to provide the same power [2]. In fact, the FC loss in voltage is related to the stack power reduction and so its inability to accomplish some technical requirements.
FC need an auxiliary power source to overcome fast transients such as SCs. In fact, UPS systems depending on the FC combined with the SCs are not that extensively investigated. Thanks to hybridization more advanced UPS systems are expected. This will allow FC functionalities enhancing the global system life expectancy and minimizing stresses caused by load currents [3].
Today, SCs can provide the required energy in a short time despite their low energy density. For high voltage applications, SCs cells can be connected in series and deliver higher power of a similar-sized battery [4]. However, SCs voltage drops sharply while discharging.
Different combination topologies of FC/SCs have been studied. Among these combinations the parallel topology using two choppers seems to be the most efficient and flexible [5]. Fuel Cells and SCs can be directly connected to the DC bus without a converter which allows the DC bus voltage to be maintained around the desired value. Meanwhile, the high charging and discharging cycles cause high power losses of the bidirectional converter and reduces the power efficiency of the entire system [6]. Besides, the load power is filtered during the UPS autonomous operation by a low-pass filter. The SCs absorb high power demands and prevent the FC to face them. The FC supply the smoothed power and can recharge the SCs when power demand is low [5].
In [7], the author estimated the FC lifetime relying on the Electrochemical Impedance Spectroscopy (EIS) measurements which consequently could help predict the FC maintenance planning.
In [8], the author gave a mathematical equation of expected FC lifetime taking into account the on/off cycles, load changes, high power load, idling, and air pollution factor. They proved that the FC reached its end when its voltage decreased by 10% at a constant current.
In [9], the author uses a Stochastic Dynamic Programming in order to decrease the total cost of the FC and increase its lifetime by 14% while increasing the fuel consumption by only 3.5%. This programming reduced significantly the FC transient load.
In [10], the author used two energy management strategies by a dual-stack FC system in order to improve the fuel economy of a vehicle and make the driving range longer. They kept the FC’s on/off frequency at a reasonable range.
In [11], the author studied an analysis of life-cycle cost of five trams and took into account the initial infrastructure cost, the tram’ power, the mode of operation and the replacement cost. They proved that using a FC hybrid tram cost 16.6% to 19.1% lower than a tram using an electric network.
The objective of this paper was to extract the best amortized lifetime cost of the hybrid system, considering power dissipation and the FC and SCs cost based on the amount of energy supplied. The cost of the hybrid system for the UPS was compared to that of an independent FC. The FC/SCs hybridization in backup systems for UPS was considered using an optimal energy management control in order to improve the lifetime of the hybrid system and reduce its overall cost.
2. Presentation of the UPS
2.1. UPS specification
The studied UPS is a 500 kVA rated power which main specifications are:
- Backup time: T = 10 min;
- Nominal FC power: = 480 kW;
- DC-bus voltage: = 400 V;
- Power factor: FP = 0.9;
- FC nominal voltage: = 650 V.
- Nominal SCs pack voltage: = 300 V.
- Total efficiency: η = 95%;
The studied UPS is a system with an Online/Double-Conversion. It interferes in grid failures before the generators start up. The maintenance has to be applied each time the FC falls up; the study was limited to twenty cycles of failure. In order to estimate the cost, the first cycle of autonomy was considered. The worst case of autonomy has been chosen in this work with two long interruptions per day: 10 minutes of interruption and 8 hours one.
2.2. Sizing and Modeling Supercpacitors
The SCs must deliver all the power rating = 480 kW in 10 s, with a delivered energy around 4.8 MJ. The simplified circuit is shown in figure 1.
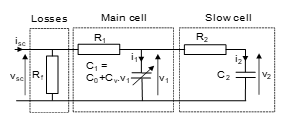 Figure 1: Super-capacitor simplified circuit.
The energy Esc stored in the SCs at the voltage is written as [5]:
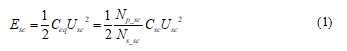 Where: is the equivalent capacity of the SCs, are the parallel branches of the SCs are the series connections of SCs and Csc is the SC capacitance.
For maximum SCs voltage = 300 V, we can recover 75% of the total energy initially stored if the voltage after discharge is in the range of = 150 V. The efficiency coefficient k is equal to 0.9 in the worst case [12]. The energy delivered by the SCs is expressed as:
![]() The calculation gives the equivalent capacitance =158 F.
The calculation gives the equivalent capacitance =158 F.
The SCs studied in this paper are the Maxwell/BCAP3000 type, rated 3000 F, 2.7 V. The number of components in series is determined by the initial voltage of the pack in the charged state (300 V). We finally get = 112 and = 6.
In order to model the SC, we refer to the simplified model with two branches that describes faithfully the electrical behavior of an SC element. This model was developed by Bonert and Zubieta [13]. It contains two parts in which the capacity of the main branch is nonlinear and varies depending on the voltage as shown in figure 1.
The main capacitance consists of a constant capacity C0 (F) and a parameter denoted by (in F/V) and it is written as: , where is a constant and is the voltage across . The equivalent circuit parameters are detailed in [5].
- = 0.360 mΩ;
- = 2100 F;
- = 623 F/V;
- = 1.92 Ω;
- = 172 F.
The SCs voltage is described as following:
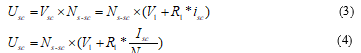 Where and Isc are the super-capacitors bank voltage and current respectively, and are the elementary SC voltage and current respectively.
The voltage at the terminals of the capacity is given by:
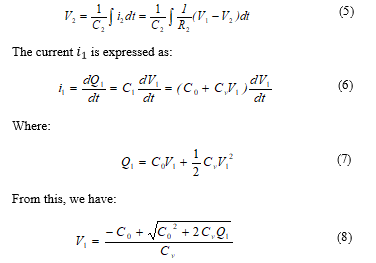 Taking into account the variation of the SC capacitance as a voltage function, the energy of the SC is given by:
![]() The SCs pack sizing meets the energy of 4.8 MJ specified initially. Furthermore, in [5] the simulated SCs circuit was validated by an experimental charge/discharge test at constant currents which showed good agreement with the developed model.
The SCs pack sizing meets the energy of 4.8 MJ specified initially. Furthermore, in [5] the simulated SCs circuit was validated by an experimental charge/discharge test at constant currents which showed good agreement with the developed model.
2.3. Fuel cell Sizing and Modeling:
The studied FC is a PEMFC simulated by MATLAB/SIMULINK using the datasheet of Nexa™ power module. The FC model should be rescaled to make it fit for UPS applications and suitable for the power demand. The Nexa™ FC stack provides1.2 kW of net output power and a voltage ranging from 43V to 26 V at full load.
The equations for calculating the variation of the voltage can be found in several works [14]. This model is described using a combination of basic laws and empirical models. The FC voltage is described as follows:
![]() Where: is the open circuit voltage and the sum of activation losses (due to the start-up electrochemical reactions at the cathode), ohmic losses (caused by the resistance imposed by the bipolar plates and the electrodes) and concentration losses (by the variation of the reactants concentrations). We can write according to [14] using the cell temperature , the partial pressure of hydrogen and oxygen as:
Where: is the open circuit voltage and the sum of activation losses (due to the start-up electrochemical reactions at the cathode), ohmic losses (caused by the resistance imposed by the bipolar plates and the electrodes) and concentration losses (by the variation of the reactants concentrations). We can write according to [14] using the cell temperature , the partial pressure of hydrogen and oxygen as:
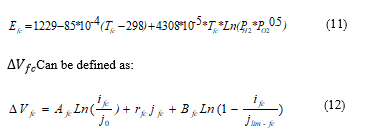
Where and are the losses activation parameter, is the modeling constant (V), is the current density of the stack (A/cm2), are the ohmic losses parameter and is the maximum current density of the FC (A/cm2).
The total electric power of the stack is calculated by the following equation:
![]() Where and are the voltage and current of the FC and is the series fuel cells number.
Where and are the voltage and current of the FC and is the series fuel cells number.
The FC parameters are summarized in Table 1. The results were verified by comparing the operating conditions with the datasheet provided by the manufacturer and given in Figure 2.
There is an agreement with the datasheet polarization curve and the polarization curve of the FC potential despite minor differences due to the estimation of some parameters affecting the activation regions. This difference is tolerable considering the neglect of some physical processes like water flooding at the cathode and anode drying.
From this comparison, we can say that the developed model is accurate and can be used to simulate the FC performances.
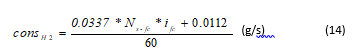
The consumption model uses an optimization algorithm that transforms the electric power and FC auxiliaries into a hydrogen consumption rate. The instantaneous hydrogen consumption rate depends on and can be expressed as: [15]
Table 1: Fuel Cell parameters
| PH2 | 2 atm | ||
| PO2 | |||
| Ns_fc | 18 | ||
| Np_fc | 18 |
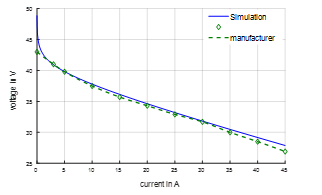 Figure 2: Polarization curves of the FC according to the proposed model and the datasheet
 The lifecycle cost can be approximated since the power source degradation in a backup system can be predicted. This is a priority objective of many researchers who try to make it as minimum as possible. Indeed, the degradation is not caused perforce by operation conditions but mainly by aging.
The FC couldn’t compete with the internal combustion engine with a price over 47€/kW at the transport domain [16, 17]. In fact the lifecycle cost depends on the FC cost, the fuel efficiency, the method of hydrogen production, the production capacity and the social cost [18]. Besides at stationary domain the FC cost is around 3000€/kW [19]. However, when the power needed increases, the FC cost decreases.
Few studies focused on the PEMFC lifetime and cost. If the researcher is seeking for prolonging the FC lifetime, he will always face cost problems. Thus to reduce the cost, the lifetime will be shortened. In fact the FC cost could be reduced by using small stacks at a higher power; however this will reduce the efficiency and increase the degradation and decrease the system lifetime [9].
The total FC cost ( ) takes into account the FC stack manufacture cost ( ), the hydrogen consumption cost ( ) and the maintenance cost ( ).
![]() In another hand, In order to estimate the FC lifetime, one should determine the FC degradations and its EOL. In fact, the FC EOL indicates a loss of about 20% of the active surface area, and the voltage value drops by 10% compared to what it was for a total surface area (120 ) [20, 8].
In another hand, In order to estimate the FC lifetime, one should determine the FC degradations and its EOL. In fact, the FC EOL indicates a loss of about 20% of the active surface area, and the voltage value drops by 10% compared to what it was for a total surface area (120 ) [20, 8].
Lifetime can be expressed as:
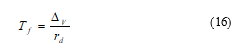 Where: presents the FC performance decay rate and is the decreased value of FC performance from the beginning of its lifetime to its end.
We can express as follows:
![]() Where is the average start-stop cycles per hour, is the start-stop cycle degradation value, is the average load change cycles per hour, is the load change cycles degradation value, is the average high power load operation time per hour, is the high power load degradation value.
Where is the average start-stop cycles per hour, is the start-stop cycle degradation value, is the average load change cycles per hour, is the load change cycles degradation value, is the average high power load operation time per hour, is the high power load degradation value.
Generally, lifetime loss can be expressed as:
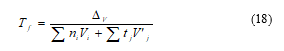 Where is the operating cycles of condition i per hour, is the average degradation value in condition i, is the average operating time of condition j per hour and is the average degradation value in condition j.
This formula can be used for any FC at any condition. But in our case with the Nexa module, zero output voltage degradation was witnessed under dynamic load test conditions according to the manufacturer. Therefore, we focused on on/off cycling and the high power load degradations.
3. Fuel cell/Super-capacitor combination
3.1. The UPS system design
The power sharing control is elaborated in order to benefit the SCs rapid charge and discharge ability and reduce the FC stress caused by instantaneous power load demands. The main goal of this combination is that the SCs support the power transients and to sleek the FC high-power demands.
The structure shown in figure 3 contains two ideal DC/DC converters which are supposed with no losses. These converters are two types two quadrants, reversible current for the SC and unidirectional for the FC to avoid current return, and have a bus voltage around 400 V.
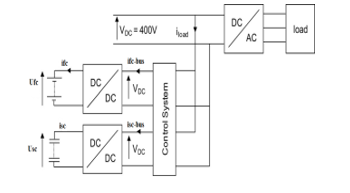 Figure 3: Topology of the controlled FC/SC combination with control system
The main goal of the management policy is to drive the FC only in its high efficiency domain, away from its high and low power regions. Thus, control strategies maintain the SOC of the SCs within a specified range. It mitigates the FC stress and maximizes its life span since it uses the energy stored in the SCs to absorb high power peaks.
The UPS block diagram respects the topology of an Online/Double-Conversion system. The backup autonomy considers a10 minutes of interruption and another one of eight 8 hours.
The hybrid control system generates two current reference signals for the FC and for the SCs with the following constraints: FC current must be limited to a maximum value in order to match the reactant delivery rate and the usage rate and a minimum value. Besides, the SC pack must have a maximum value of 300V and a minimum value of 150V to indicate the charge/discharge cycle limits.
At the beginning, sudden power variations are diverted to the SCs thanks to a low-pass filter which is activated each load change. Then this filter is canceled and the FC supplies the full load power Pload. After that, at a certain limit of the load power , the FC supplies the load and the SCs with energy. When fully charged, the SCs pack can intervene in the same way in case of another power demand and the filter activated again. When the SCs reach 75% of discharge, their voltage drops until 150 V which is the minimum limit set. The SCs pack role is inhibited and the FC handles up the full power.
The equation of the FC power is given by:
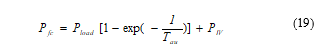 Where: is the power load cycle, is the starting FC power and is the adjustable constant of the low-pass filter.
The chart in figure 4 explains the power distribution principle between the FC and the SCs.
The power management is developed and gives the optimal sizing of the FC and SCs according to the critical load profile which corresponds to the typical load power with large power impulses as illustrated in figure 5. It is delivered by an UPS relying on batteries in information technology (IT).
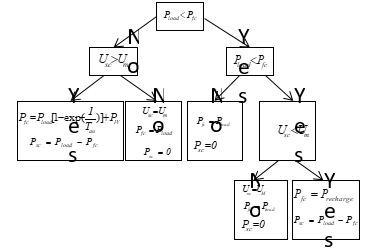 Figure 4: FC/SCs combination system chart
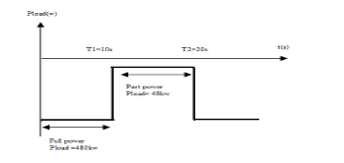 Figure 5: Load cycle profile
The energy management system has to be appropriate in order to obtain the necessary size of the FC and the SCs. The two major parameters of the power management system are the SCs current charging (ich) and the filter time (Tau).
The SCs current charge was varied (100A, 200A et 400A) for Tau=2 and the load charge variation of figure 5 in order to extract the SCs power waveforms as shown in figure 6. This test emphasized on the SCs rest time ( ) which decreased while increasing , thus the FC power varied too (since and are complementary) and so is its lifetime and the hydrogen consumption. For = 400A the SCs are charged rapidly via the FC in order to interfere in case another load variation occurs. However, at low charge currents the SCs are not totally charged to face the next power charge variation. Consequently the optimum is 400A.
The second test aims to vary the filter constant Tau (1, 2, 3 et 10) at 400A of as indicted in figures 7 and 8 which present the SCs power and the FC power variations simultaneously. In fact, the waveforms of theses storage elements vary for each Tau value. The filter dynamic could also affect the FC and SCs lifetime; the optimal solution seems to opt for a Tau = 2s.
3.2. Simulation results:
The combination of the FC and SCs has to last for the whole backup time needed by our UPS. For the rest of simulation the ich=400A and Tau=2 are adopted.
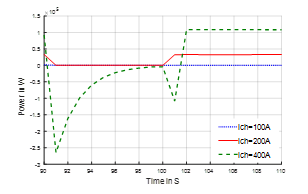 Figure 6: PSC for different values of Tau and current charge of the SCs
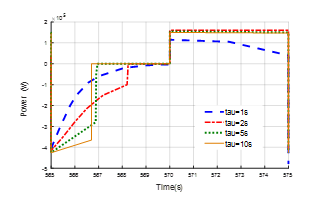 Figure 7: SCs power evolution for different values of Tau versus Pload
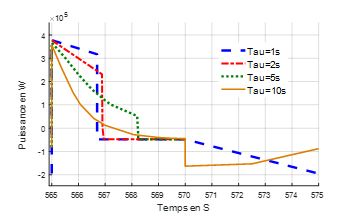 Figure 8: SCs power evolution for different values of Tau versus Pload
Figure 9 shows the FC voltage difference when it performs alone and when it is accompanied with the SCs. Figure 10 gives the SCs voltage and proves the optimum choice of Tau while reaching 150V for just seconds before being charged up to 319V. As for figures 11 and 12, they display the load power Pload versus the FC power and versus SCs power respectively obtained. Furthermore, figure 13 shows the FC current ( ) when the system relies on only the FC and when the system is hybrid in order to calculate the high power load operation period (while the FC current increases 46A). Figure 14 depicts the instantaneous consumption of hydrogen with and without SCs which follows the FC current shape.
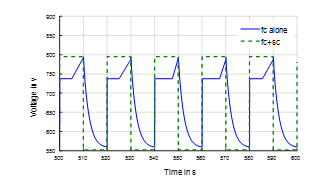 Figure 9: FC voltage
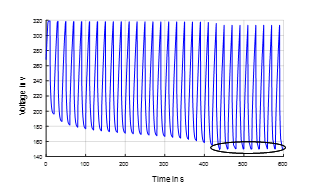 Figure 10: SCs voltage
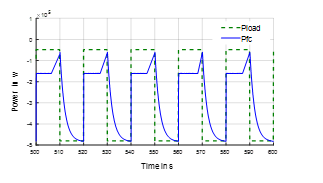 Figure 11: FC power versus load power with control system
At 550 s in figures 12 and 13, the FC is subjected to a sudden power demand by the load. The low-pass filter is applied in order to divert power variation to the SCs. At 558.83s, the FC supplies the full power and then the filter is off. Then at 560s the FC supplies the load and the SCs (in charging cycle) with energy.
At 570 s, another power demand arrives, the filter is activated again and the SCs meet this sudden power requirement until 578.83 s when the filter is shut down and the FC continues supplying the full power load: the same principle is repeated with each load power demand. We notice that the SCs recharge process stops when their voltage reaches its maximum value (319V); this avoids their deterioration.
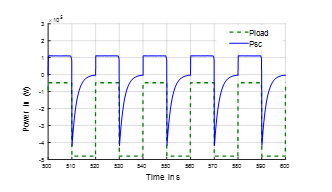 Figure 12: SCs power versus load power with control system
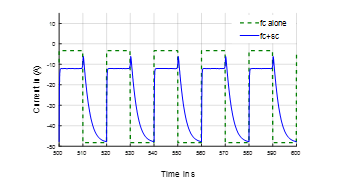 Figure 13: Single FC pack current
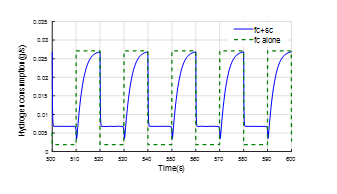 Figure 14: Hydrogen instantaneous consumption with control system
As it’s clear, the SCs make a significant effect on since they ensure the instant power changes only for a short period due to the quick drop of its voltage and the FC fulfills the rest of the supplied power until the 10 min are over.
In UPS applications, the FC is so efficient but the air supply compressor, cooling pump and radiator could affect its performance. Thus the air supply control strategy and resultant transients have a significant impact on the UPS efficiency and economy.
3.3. Gain in FC RMS Current and gain in FC Energy Losses:
In order to evaluate the FC/SCs association performance and to verify the good choice of Tau as well as the number of branches of SCs in parallel, two important criteria have been tested; the RMS current in the FC as well as its energy losses.
Certainly the more the number of SCs increases and Tau is greater the less the FC is solicited since SCs provide most of the load power for a longer time. For this, these quantities were calculated after each cycle and divided by the SCs cost.
The internal resistance of the FC can give an approximate image of ohmic losses thanks to the RMS FC current ( ) which is compared to the FC current when it acts without SCs pack ( ) [5]. The chemical processes are neglected.
The gain in FC RMS current is expressed as:
![]() Figure 15 (a) shows the RMS current gain of the FC while varying the constant of the filter Tau (1, 2, 5, and 10) and the number of parallel branches of SCs (6, 12, 18, 24, 30, 36, 42, 48, 54 and 60). It increases as the number of parallel SCs branches the filter constant increase until an upper limit after what there is no enhancement.
Figure 15 (a) shows the RMS current gain of the FC while varying the constant of the filter Tau (1, 2, 5, and 10) and the number of parallel branches of SCs (6, 12, 18, 24, 30, 36, 42, 48, 54 and 60). It increases as the number of parallel SCs branches the filter constant increase until an upper limit after what there is no enhancement.
The gain in RMS current is divided by the cost of the SCs pack as shown in figure 15 (b). It shows a maximum value about 214 % per € of gain/cost at Tau=2s and =6 branches.
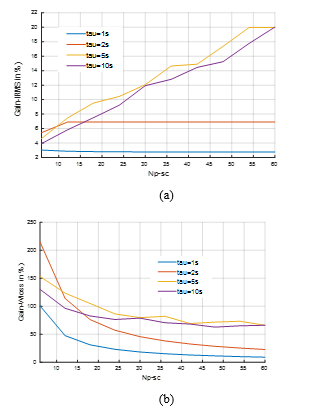 Figure 15: Gain in RMS current versus Tau and
In another hand, reducing the energy losses for any storage element is the goal of any researcher in order to reduce its direct effect on its longevity. These losses were calculated for the FC by a comparison between FC losses ( ) when the system is hybrid and the FC losses while it is without SCs pack ( ).
The gain is obtained as:
 Figure 16 (a) and (b) shows gain in FC energy losses and the gain per cost with the same conditions of Tau and for the gain in RMS current.
The gain in FC evolves as increasing Tau and until no enhancement, but the gain per cost reaches 349.72 % per € for Tau = 2s and = 6 branches.
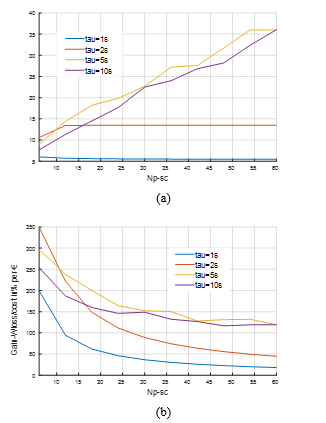 Figure 16: Gain in FC losses versus Tau and
4. Lifetime cost evaluation
Some measurements may be available in order to evaluate the SOH of the FC and indicate its EOL.
EIS measurements are either given by the manufacturer or measured before the using the stack. However, these measurements cannot be performed all the lifetime of an embedded system [21].
The voltage decreases with time as presented in figure 17 which indicates the evolution of degradation mechanisms inside the PEMFC; that’s why some papers use the voltage and the power to evaluate the degradation rate of the system [22].
In order to evaluate the SOH of the FC, two thresholds can be defined. The first one is a threshold to conform a mission which decides if the FC can asset a given mission (the FC is not out of use if we operate in degraded mode). The second one is the definitive EoL; the FC is not able to deliver the power in safe conditions (loss of 10% of voltage).
Figure 17 shows that the voltage drops from 795V for a new stack to 791V for a stack at 90% of SoH and to 786V for a stack at EoL. The FC won’t perform when the profile contain current variations if the stack is aging. It’s clear that’s there are differences between voltage at Beginning of Life (BOL) and voltage after a loss of 20% of membrane.
The Beginning of degradations can be declared when the system starts up. After only few hours the power decreases continuously. Degradations could be a result of an increase in resistance of the FC [23].
Figure 18 proves that aging FC consumes more Hydrogen than a new FC stacks; the more the FC is aged, the more the cost grows.
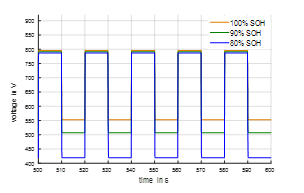 Figure 17: FC voltage from the BOL to its EOL
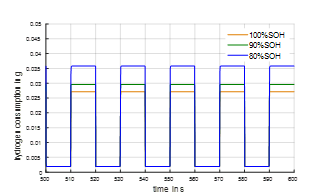 Figure 18. Hydrogen instantaneous consumption from the BOL to its EOL
The lifetime is calculated with (16) taking into account the high power load, the load change and the start/stop cycles in this paper. The FC degradation depends on the way the system operates.
Two interruptions occur per day, otherwise two start/stop cycles for 8h and 10 min, thus we can deduce the average start-stop cycles per hour. Furthermore, the load power period is 20s; for 10 min the load power makes 30 cycles and for 8h it makes 1440 cycles thus we can calculate the average load change cycles per hour .
Besides, the high load power degradation is defined when the FC operates at full power with a current that exceeds 46A. However when the system operates with a current less than 35A the Nexa module presents no degradation.
The degradation values are given in table 2. The high load power period is obtained by calculating the periods while the FC current exceeds 46A in seconds. After that, theses periods are expressed according to the backup autonomy in min/h; they are about 9.3min/h when the storage system is hybrid and about 30 min/h when the FC acts alone. In [24], the author gave FC degradation causes, the interest of use of auxiliary system for the FC lifetime and calculated the cost of the SCs and FC pack [24].
Table 2: PEM Fuel cells voltage degradation rates [15]
| Operating conditions voltage | Degradation rate | Load spectrum | Values |
| Start-stop | 1.1 mV/cycle | 0.245 cycles/h | |
| Load change | 0.4185μv/cycle | 180 cycles/h | |
| High load power | 0.54 mV/h | 9.3 min/h (for Tau=2) |
The study was limited to twenty cycles of FC failure. In order to estimate the cost, the first cycle of maintenance was considered.
The cost of the FC is calculated with equation (15). The PEMFC stack manufacture cost is estimated by 100 000€ [25] thus the first maintenance cycle FC stack cost is 5K€, the hydrogen cost is about 5€/kg and the maintenance cost is estimated by 20 000€.
A good modeling minimizes the SCs and FCs size. Consequently, the mass and cost of the UPS will be reduced. However, the FC hydrogen consumption and the power variations increased compared to the full design. Subsequently, there is a compromise between reducing the SC size and the FC lifetime [24].
Figures 19 and 20 are drawn in order to prove the optimum choice of Tau with a less impact on the FC lifetime and cost. Tau =2 provides 1510.28h of autonomy and costs only 14.15€ for 10 minutes of autonomy.
The cost of the SCs is assumed to be 0.01€/Farad [5]. The total cost of the SCs is 112*6*30=20k€. Their lifetime is about 1 million cycles of charge/ discharge. The charge cycle lasts 10s and the discharge cycle lasts 10s too which means the complete cycle duration is 20s. For the two long interruptions with 10 minutes and 8 hours, the SCs operate 29400s per day otherwise 1470 cycles per day. During 1510.28 h of the FC lifetime, the SCs operate 92504.65 cycles. Consequently, the SCs cost for the first maintenance cycle is 2K€.
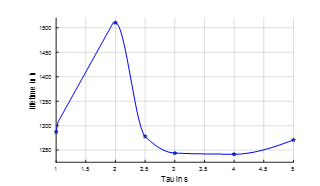 Figure 19: FC lifetime for different values of Tau
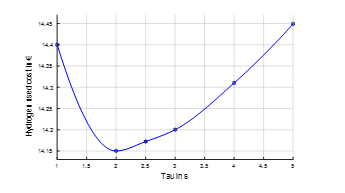 Figure 20: Hydrogen cost in 10 minutes for different values of Tau
The energy is product of the mean load power charge ((480KVA + 48KVA)/2) and the FC lifetime duration and it is expressed by KWh.
The comparison of using hybrid storage system relying on FC/SCs and using only the FC is summarized in table 3.
Table 3: The first maintenance cycle FC’ lifetime cost.
| PAC alone | controlled FC/SC system | |
| lifetime | 1117.3 h | 1510.28 h |
| The H2cost | 97.57 k€ | 129.63 k€ |
| The FC stack cost | 5 k€ | 5 k€ |
| The maintenance cost | 20 k€ | 20k€ |
| The SCs cost | – | 2 K€ |
| Energy | 294 967.2 KWh | 398 713.92KWh |
| The FC cost | 0.4155 €/KWh | 0.3928 €/KWh |
Clearly, using SCs increases the FC lifetime since it lasts only 1117.3h when they are not used and also decreases the total FC cost per KWh.
The Gain in FC lifetime is not the only issue in the UPS. The SCs lifetime should also be considered which explains the fact that the power management decreases the SCs power and cost. Therefore, a compromise between all performances has to be made in order to decrease the cost of the whole UPS system and get a better lifetime.
5. Conclusion
In this paper a 500-kVA rated UPS was presented. The system included a FC standalone architecture and another where it is coupled with SCs and simulated on Matlab-Simulink. Simulations show that FC/SCs hybridization could reduce significantly the FC peak current requirement and so the possibility of downsizing the potential of the FC system. In fact, downsizing the FC can reduce the system peak efficiency but improve the average system efficiency. FC degradations were presented while taking into account high load power, load change and start/stop degradations in order to estimate its lifetime by a quick evaluation method. The expression of the formula is suitable for all applications. The cell voltage decreases of about 10% at a constant current at the EOL; this percentage is not definite. In fact, to evaluate the future SoH of the system it is crucial to know if the FC remains in a healthy mode or it is already degraded. Furthermore, an evaluation method of the FC economic lifetime was determined. It was based on cost ratio and optimal benefits. Clearly, the fuel consumption increases in degraded modes and with FCs use and aging.
Acknowledgment
This work is a contribution of the Ministère de l’Enseignement Supérieur et de la Recherche Scientifique of Tunisia. The authors would like to acknowledge the conference paper “Fuel cell/supercapacitors combination in Uninterruptible Power Supply (UPS)” Published in: Sciences and Techniques of Automatic Control and Computer Engineering (STA), 2015, 16th International Conference published by IEEE.
- D. Knights, K. M. Colbow, J. St-Pierre, and D. P. Wilkinson, Aging mechanisms and lifetime of PEFC and DMFC, J. Power Sources, vol. 127, no. 12, pp. 127–134, Mar. 2004.
- N. d. Fonseca, Optimization of the Sizing and Energy Management Strategy for a Hybrid Fuel Cell Vehicle Including Fuel Cell Dynamics and Durability Constraints, Ph.D. dissertation, The National Institute of Polytechnique in Toulouse, 2013
- Hredzak, V. G. Agelidis, and G. D. Demetriades, A Low Complexity Control System for a Hybrid DC Power Source Based on Ultracapacitor–Lead–Acid Battery Configuration, IEEE Trans. Power Electron., vol. 29, no. 6, pp. 2882–2891, Jun. 2014.
- Thounthong, S. Raël, and B. Davat, Energy management of fuel cell/battery/supercapacitor hybrid power source for vehicle applications, J. Power Sources, vol. 193, pp. 376–385, 2009.
- Lahyani, P. Venet, A. Guermazi, and A. Troudi, Battery/Supercapacitors Combination in Uninterruptible Power Supply (UPS), IEEE Trans. Power Electron., vol. 28, no. 4, pp. 1509-1522, April 2013.
- S. Yoo, J. Y. Choi, M. K. Yang, H. S. Cho, and W. Y. Choi, High Efficiency Power Conversion System for Battery-Ultracapacitor Hybrid Energy Storages, IEEE Trans. Power Electron., vol. 978, pp. 2830–2835, March 2013.
- Onanena, L. Oukhellou, D. Candusso, A. Same, D.Hissel,P. Aknin, Estimation of fuel cell operating time for predictive maintenance strategies, Int. J. of hydrogen energy, vol. 35,no. 15, pp. 8022–8031, 2011
- Pei, Q. Chang, T. Tang, A quick evaluating method for automotive fuel cell lifetime, Int. J. of hydrogen energy, vol. 33, pp. 3829–3836, 2008
- Fletcher, R. Thring, M. Watkinson, An Energy Management Strategy to concurrently optimise fuel consumption & PEM fuel cell lifetime in a hybrid vehicle, Int. J. of Hydrogen Energy, vol. 157, 2016
- Han, F. Li, T. Zhang, T. Zhang, K. Song, Economic energy management strategy design and simulation for a dual-stack fuel cell electric vehicle, Int. J. of hydrogen energy, 2017
- Zhang, J. Li, ,L. Xu, M. Ouyanga, Y. Liu, Q. Hand, K. Li, Comparison study on life-cycle costs of different trams 1 powered by fuel cell systems and others, Int. J. of hydrogen energy, vol. 41, no. 38, pp. 16577–16591, 2016
- Choi, J. W. Howze, and P. Enjeti, Fuel-cell powered uninterruptible power supply systems: Design considerations, J. Power Sources, vol. 157, pp. 311–317, 2006.
- Zubieta and R. Bonert, Characterization of double-layer capacitors for power electronics applications, IEEE Trans. Industry Applications, vol. 36, no. 1, pp. 199–205, Jan./Feb. 2000.
- Lachhab and L. Krichen, An improved energy management strategy for FC/UC hybrid electric vehicles propelled by motor-wheels, Int. J. of hydrogen energy, vol. 39, pp. 571–581, 2014.
- NexaTM Power Module User’s Manual, MAN5100078, Ballard
- Cao, H. Lin , L. Chen, Y. He and W. Tao, Numerical investigation of the coupled water and thermal management in PEM fuel cell, J. Applied Energy, vol. 112, pp. 1115, 2013
- Sun, J. Ogden and M. Delucchi, Societal lifetime cost of hydrogen fuel cell vehicles, Int. J. of Hydrogen Energy, vol. 35, no. 21, pp. 11932, 2010
- Lee, M. Yoo, K. Cha, TW. Lim and T. Hur, Life cycle cost analysis to examine the economical feasibility of hydrogen as an alternative fuel, Int. J. of Hydrogen Energy, vol. 34, no. 10, pp.4243, 2009
- The Fuel cell and Hydrogen annual review, the 4th energy wave, 2016
- Chen, P. Pei, M. Song, Lifetime prediction and the economic lifetime of Proton Exchange Membrane fuel cells, J. Applied Energy, vol. 142, pp. 154-163, 2015
- Jouin, M. Bressel, S. Morando, R. Gouriveau, D. Hissel, M. C. Péra, N. Zerhouni, S. Jemei, M. Hilairet and B. O. Bouamama, “Estimating the end-of-life of PEM fuel cells : guidelines and metrics”, J. Applied Energy, vol. 76, May 2016
- Zhang, Y. Rui, Z. Tong, X. Sichuan, S. Yong, N. Huaisheng, “The characteristics of voltage degradation of a proton exchange membrane fuel cell under a road operating environment”, J. Hydrogen Energy, vol. 39, no. 17, pp. 9420 -9429, 2014
- Bezmalinovic, B. Simic and F. Barbir, “Characterization of PEM fuel cell degradation by polarization change Curves” , J. Power Sources vol. 294, pp. 82-87, 2015
- B. Amira, A. Lahyani, A. Guermazi, Fuel Cell/Supercapacitors combination in uninterruptible power supply(UPS), The 16 int. Conf. Of Sciences et Techniques d’Automatique STA’2015
- Chauvin, Contribution à l’optimisation globale pour le dimensionnement et la gestion d’énergie de véhicules hybrides électriques basée sur une approche combinatoire, Ph.D. dissertation, The national Institute of applied sciences in Lyon, 2015.