Linear Evaluation on Weak Story Medium Rise Structures Placed in High Seismic Areas

Adv. Sci. Technol. Eng. Syst. J. 3(6), 173–179 (2018);
 DOI: 10.25046/aj030622
The paper shows the influence of nonbearing masonry walls for medium rise framed buildings placed at higher stories but not at the ground floor. The building studied here is a hotel that will be built in Bucharest, Romania. This is a high seismic area according to the seismic codes in force. The structure is composed of a basement, a ground floor and 3 stories above it. It is necessary to use a frames structure to have a free partitioning at the ground story. Masonry nonbearing walls placed only at the upper stories may generate a weak story behavior for the structure. This becomes particularly difficult when the building is subjected to seismic loads. The ground floor columns are subjected to high bending moments and shear forces. This study will show the behavior of such buildings in the elastic state, but also the failure mechanism. The influence the nonbearing walls have on the structure’s behavior, their ability to bear the efforts they are subjected to and whether or not this solution is usable are very important aspects to be highlighted in the study. The results may be used for framed buildings with small bays and masonry partitioning walls placed at the higher stories and not at the ground floor.
1. Introduction
The “weak story” is phenomenon that can cause serious earthquake damage. These story configurations appear from architectural requirements such as: open first floor, free architectural plan, free façade and roof terrace gardens [1]. Many medium and high rise framed buildings contain masonry infill walls. Such buildings are usually used as dwellings or office buildings with moderate bay size. The frames are usually designed without the masonry walls being taken into account [2]. There are advantages in using masonry walls as partitions for high structures. They may increase the lateral stiffness [3]. Masonry walls are thought to fail trough diagonal shear. There is also another failure called corner crushing, that is not considered in the masonry design [4]. Masonry panels may generate different failure mechanisms to reinforced concrete framed structures, so they should be taken into account in the structure design [5]. The interaction between frames an infill masonry walls may generate a very different seismic response from what it was originally assumed. According to tests on model framed buildings, shear failures appeared at the slab-column connection when no masonry walls were present. If masonry infill walls were used, they prevented slab collapse and increased the structure stiffness and strength [6]. According to laboratory tests, the reinforced concrete frames lateral strength increases and the displacement ductility decreases as a result of using infill masonry walls stiffly connected to the structure. If the masonry walls have a less stiff connection to the frames, then these effects are diminished [7]. The most common masonry units are either burned clay bricks or concrete blocks. They can be solid or can contain hollows. The concrete blocks are more brittle than the burned clay bricks. Different mortars cause masonry properties to vary [8]. The masonry prisms strength decreases as the bricks height/thickness ratio increases. Masonry prisms subjected to compression strength tests show diagonal cracks close to the corners and vertical cracks in the center [9]. Masonry infill walls with rigid connections to the structure have caused several undesired effects during earthquakes, such as short-column effect, soft story effect, torsion and out of plane collapse. One of the requirements in ductile frames design is strong columns and weak beams, so most structures will have enough ductility to survive an earthquake. Elements will yield and deform, but they will bear the loads. After seismic events, it was seen that if the weak beams and strong columns rule isn’t followed, plastic hinges appear at the columns ends. It is also important that cast in place slabs increase the beams stiffness [10]. The presence of masonry infill walls significantly changes the dynamic response behavior of the building model compared to the bear frame model. The existence of a soft story shows dramatic variation in the dynamic behavior of the infill walls model, compared to the one without such a story. The story displacement, overturning moment and stiffness change from one model to the other [11]. It is adequate to analyze a structure’s behavior in the plastic stage too, to predict its possible failure mechanism and the maximum base force it can bear. The moment-curvature diagram may show the ductility or stiffness of the building in study [12]. Moreover, many other researchers have also evaluated high rise composite concrete-steel structures without considering the frame wall [13-14]. The paper presents the behavior of a framed building composed of a basement, a ground floor and two floors above it. The structure will be designed using the codes in force [15-21]. It will be built in Bucharest, Romania. This is considered a high seismic area, as ag=0.30g (g is the gravity acceleration) [21].
2. Building description
The structure is composed of a basement, a ground floor with 3.5m story height and 3 floors above it with 3m story height. This study will only highlight the behavior of the structure above the basement. According to the seismic codes in force, it is considered that the columns at the ground floor are fixed at the bottoms. The basements are designed as stiff boxes, stiffer than the structures. The structure is presented in Figures 1 and 2.
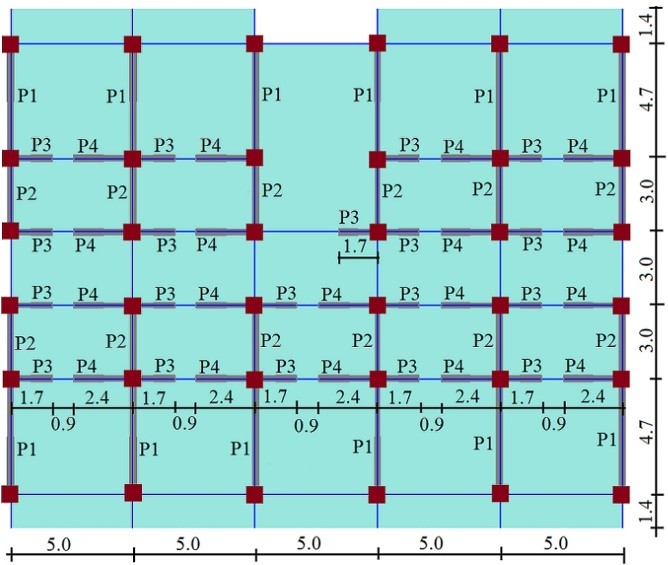 Figure 1: Story plan
The lengths seen in Figure 1 are written in meters. The particularities of this structure are the small bays and masonry walls placed at the upper stories. The ground story has no partitioning walls, so a weak story phenomenon may appear there. There are four types of nonbearing walls, according to their lengths. They will be named P1, P2, P3 and P4. The beams are blue, the slabs are green, walls are gray and columns are brown. In order to highlight the masonry walls influence to the building, 2 structural solutions are studied. One doesn’t use the stiff partitioning masonry walls. It will be named solution 1. Another uses the masonry walls. It will be named solution 2. This will help to understand the nonbearing walls importance.
In the research conducted in the last decade, the finite element method has been widely considered. The finite element software used for analysis is ETABS 2016.
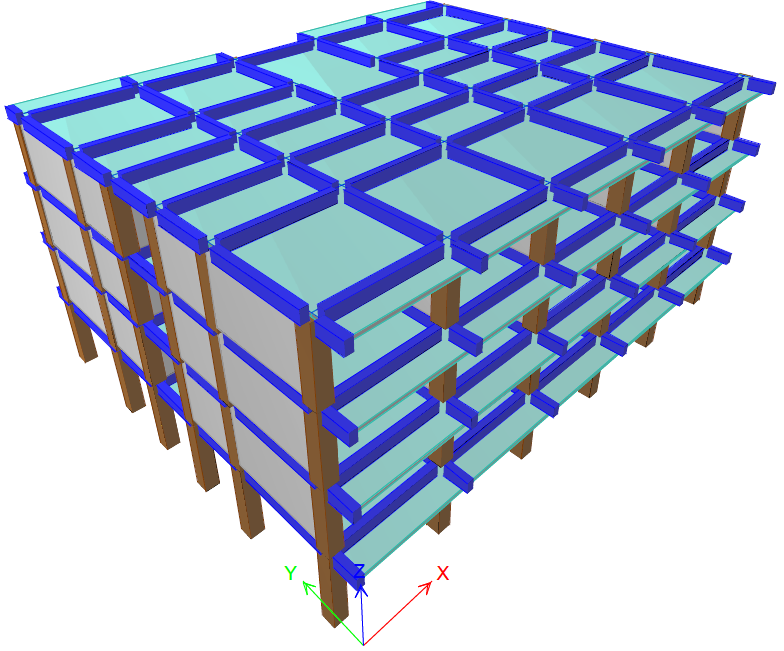 Figure 2: 3D building image
3. Theory Used in Paper
3.1. Materials Properties
To determine the behavior of frames they will have to be designed and reinforced to bear both the vertical and horizontal loads they are subjected to in the elastic state. Also, the plasticity of the materials is ignored. Moreover, the theoretical elastic and plastic behavior of steel and concrete are explained in [22-24]. Concrete used here is C20/25 [19], with elasticity modulus EC=30000N/mm2. Reinforcement bars are S355 with elasticity modulus ES=210000N/mm2 [19]. The nonbearing masonry walls are made of autoclaved concrete 600·250·240 (mm) with standard strength fb =5N/mm2, mortar M10 and elasticity modulus EM=3380N/mm2 [15]. The masonry design strengths [15] are horizontal compression (fdh), vertical compression (fd), and shear strength for horizontal direction (fvd,0). Those design strengths are determined from their characteristic values: fkh, fk, and fvk,0, using the masonry strength insurance factor γM [15]. The concrete compression design strength (fcd) is determined using the characteristic strength (fck) and γM for concrete [19]. The steel reinforcement bars design strength is determined in an analog way.
fdh = fkh/γM=1.91/1.9= 0.1 N/mm2 (1)
fd = fk/γM=3.38/1.9= 1.78 N/mm2 (2)
fvd,0 =fvk,0/γM= 0.25/1.9= 0.13 N/mm2 (3)
fcd = fck/γM=20/1.5= 13.3 N/mm2 (4)
fyd = fyk/γM=355/1.15= 309 N/mm2 (5)
3.2. Reinforced Concrete Frames Design
Bending reinforcement of beams is designed according to MEd (bending moment from the load combination: 1.0 · permanent loads+0.4 ·variable loads+1.0 ·seismic loads) [15-21].
MEd=b·λx·fcd·(d-λx/2)= As·fyd·z [kNm] (6)
m=MEd/(b·d2·fcd) (7)
z=d-λx/2=d-d·(1-(1-2m)0.5)/2 [mm] (8)
As,min = min{0.26·fctm/fyk·b·d; 0.0013·b·d} (9)
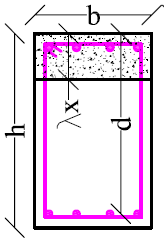 Figure 3: Concrete beam section
 Figure 4: Concrete column section
As is the minimum reinforcement area for beams. λx is the beam section compressed area [19] length. fctm =2.6N/mm2 is the medium value of the concrete tensile strength. Bending moments of columns are calculated using (10), according to [21].
ΣMRc ≥ 1.20 · γRd ·ΣMRb [kNm] (10)
γRd =1.2 is the steel stiffening factor for DCM (medium ductility buildings) [21], ΣMRc and ΣMRb are the sums of bearing bending moments of columns and beams along a line. Minimum longitudinal reinforcement percent value for columns is pmin = 1% and the maximum is pmax = 4% [21]. If λx<2·as, AS will be determined from (13), and from (14), if λx≥2·as. Here, as=45mm. NEd is the axial force in the calculated columns [21].
p=As/(b·d)·100 (11)
x=NEd/(b·λ·fcd) [mm] (12)
As=[MEd-NEd(d-as)/2]/[fyd·(d-as)] [mm2] (13)
As=[MEd+NEd(d-as)/2-b·λx·fcd(d- λx/2)]/[fyd(d-as)] (14)
3.3. Seismic Base Force
The base force Fb is calculated according to [21]. The factors in the formula are: β0 = 2.5 is the maximum elastic spectrum value, q is the structure’s behavior factor, γI,e = 1.2 is the building’s importance-exposure coefficient, q=3.5·αu/α1=3.5·1.35 [21], αu/α1 = the base shear force value for the failing mechanism/the base shear force value for the first plastic hinge, m = building’s mass. λ = 0.85 for 3 stories buildings, ag = 0.30g [21], G = building’s weight and cs is the seismic coefficient.
Fb = γI,e · β0 · ag/q · m · λ = cs · G = 0.17·G [kN] (15)
3.4. Masonry Walls Design Method
A1=NEd/(0.85·fd) [mm2] (16)
MRd = NEd · yz [kNm] (17)
A1 is the wall’s compressed area and MRd is the walls bearing bending moment. yz is the distance between the wall’s weight center (C) and the compressed autoclaved concrete area weight center (A1G) [15]. S is the seismic action direction.
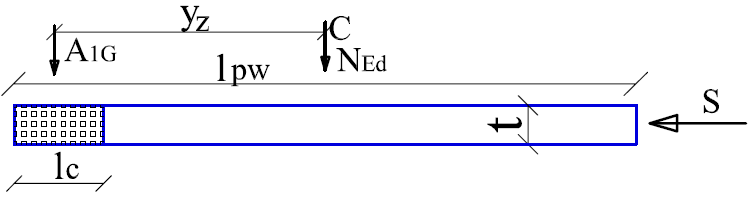 Figure 5: Autoclaved concrete wall section
VRd= 0.4 · (NEd +0.8· VEd·hpan/lpw) [kN] (18)
VEd ≤ lpw· t · fvd,0 (19)
VRd is the masonry wall bearing shear force and VEd is the horizontal shear force from the seismic loads combination. fvd,0 is the design initial shear strength for no axial stress [15], hpan and lpw are the height and length of the masonry panel.
3.5. Seismic Force Perpendicular to the Masonry Walls
FNBW(z)=γI,e·ag·βNBW·kz·mNBW/qNBW=0.7 kN/m2 (20)
The force is considered uniformly distributed, perpendicular to the non-bearing walls [21]. The factors in the formula are explained here. βNBW =1 is the non-bearing walls amplification factor, kz is a coefficient according to the non-bearing wall’s level (the distance to the building’s base), z is the non-bearing wall’s level and H is the building height [21]. kz is expressed by factors kz1 and kz2 that refer to the highest and lowest points of the nonbearing wall. Of course, the greatest value for kz is calculated at the top building story. qNBW =2.5 is the behavior factor for non-bearing walls. mNBW =γmas · t =7 · 0.25= 1.75kN/m2 is the wall mass/m2.
kz=1+2·z/H (21)
kz=(kz1+kz2)/2=(1+2·z1/H+1+2·z2/H)/2 (22)
Seismic force value FNBW is limited as (23) shows [21].
0.75· γI,e ·ag ·mNBW ≤FNBW≤4·γI,e ·ag ·mNBW (23)
4. Elastic Analysis Results
4.1. Natural Vibration Periods
The natural vibration periods for the first 3 natural vibration modes are 20% smaller if stiff partitioning walls are used.
Table 1 Natural vibration periods
| Natural vibration periods | Solution without stiff walls
(solution 1) |
Solution with stiff walls
(solution 2) |
| T1 | 0.510 s | 0.398 s |
| T2 | 0.462 s | 0.359 s |
| T3 | 0.443 s | 0.356 s |
4.2. Story Displacements in the Elastic Stage
For the first solution with no nonbearing walls, the displacements reach slightly greater values at story 1 and then, they visibly increase towards story 4. For the second solution, where the nonbearing walls are present at the upper stories, displacements are smaller and the values gradually increase towards the building top.
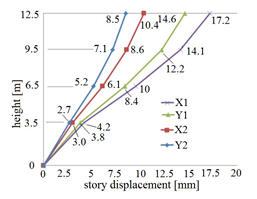 Figure 6: Story elastic displacements
4.3. Frames Efforts and Reinforcements
Efforts in beams and columns are shown in Figures 7–16 for the load combination with the seismic load on direction X (GX) and on Y (GY). The dark blue graphic lines show the efforts in frames for the first solution and the light blue graphic lines show effort values for the second one.
 Figure 7: VEd in beams on direction X
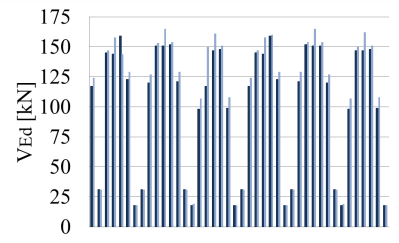 Figure 8: VEd in beams on direction Y
 Figure 9: MEd in beams on direction X
 Figure 10: MEd in beams on direction Y
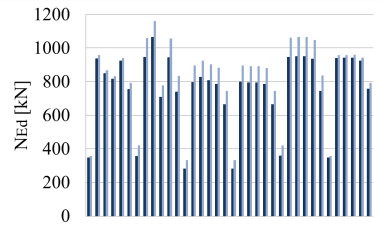 Figure 11: NEd in columns on X
 Figure 12: NEd in columns on Y
It is clear that the presence of nonbearing walls increases the frames efforts. There are 29 beams on direction X, 42 on Y and 36 columns. Each one of the line graphics is the effort value in a frame or a column. The beams with very low efforts on Y are the short beams at the edges. There are some beams on direction X with no masonry walls to bear. Their effort values do increase for the case when the walls are present. This is because of the influence from the other elements in the structure.
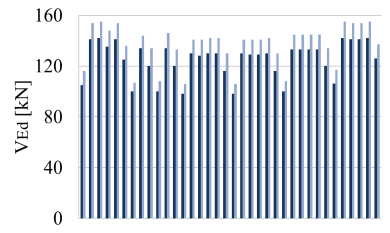 Figure 13: VEd in columns on X
 Figure 14: VEd in columns on Y
 Figure 15: MEd in columns on X
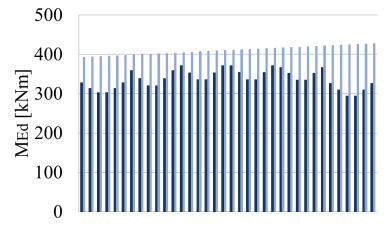 Figure 16: MEd in columns on Y
If no stiff partitioning walls are present the efforts in columns are about 90% of these that are seen if nonbearing autoclaved concrete walls are used.
Table 2: Frame elements reinforcement bars
| Beam 30×50 As →4Φ22 up and 4Φ20 down (solution 1) | Beam 30×50 As →4Φ25 up and 4Φ22 down (solution 2) | Column 60×60 As →12Φ22
(both solutions) |
4.4. Masonry Nonbearing Walls Results
Table 3 Design and bearing efforts in masonry walls
| Wall (P) | NEd [kN] | MEd [kNm] | VEd [kN] | MRd [kNm] | VRd [kN] |
| P1 | 28.2 | 10.7 | 3.57 | 65 | 11.9 |
| P2 | 18 | 6.9 | 2.3 | 26.4 | 7.8 |
| P3 | 10.2 | 3.9 | 1.2 | 8.47 | 7.64 |
| P4 | 14.4 | 5.5 | 1.8 | 17 | 6.36 |
5. Nonlinear Stage Results
5.1. Plastic Mechanisms
The nonlinear analysis is performed for solution 1 by using pushover cases PX and PY and for solution 2, by using cases PXW and PYW. This way, the masonry walls influence on the building is clearly seen on both directions X and Y. Figures 17 – 20 show the last stages of the analysis. The color code is the following: B (green) means the plastic hinge is formed, C (light blue) means the plastic hinge reaches the limit and the element gives out, D (pink) means the load was redistributed and E (red) means collapse.
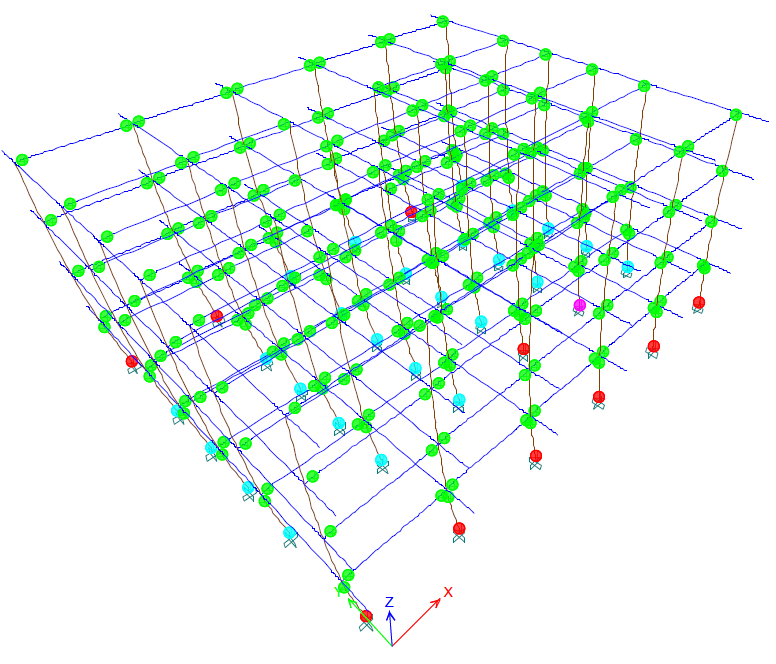 Figure 17: PX step 11 solution 1
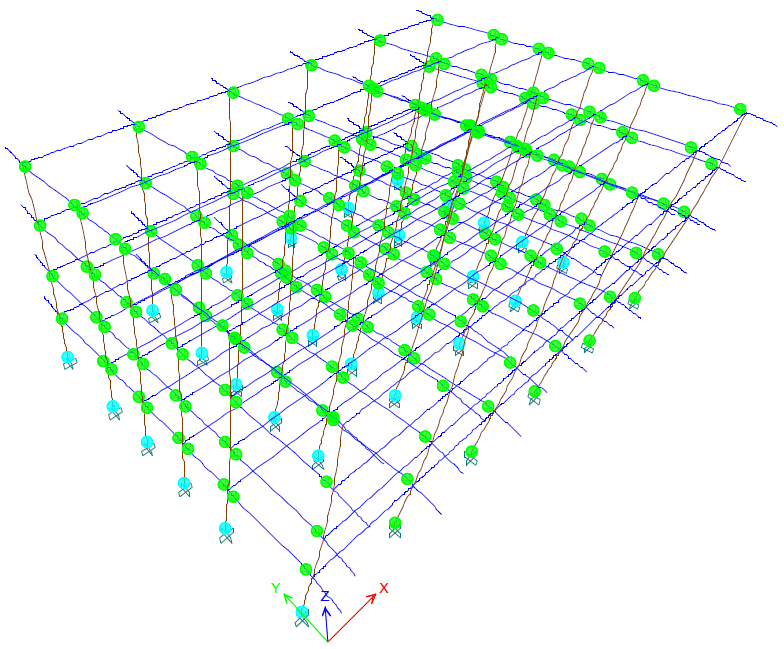 Figure 18: PY step 22 solution 1
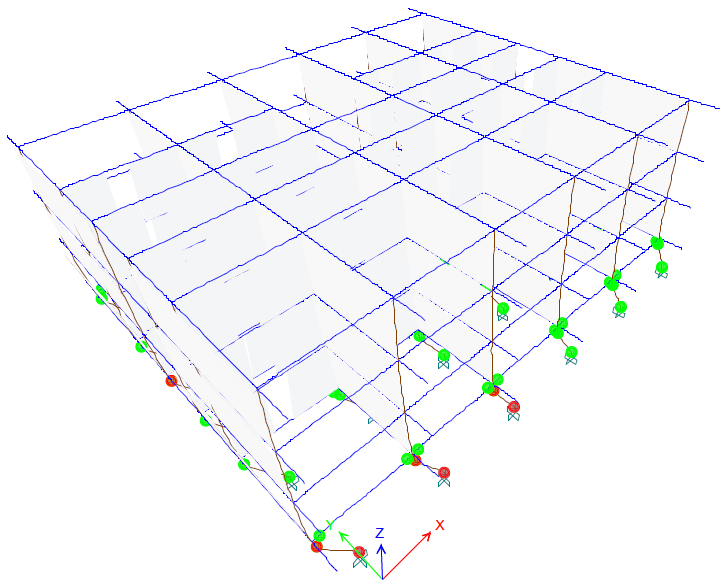 Figure 19: PXW step 7 solution 2
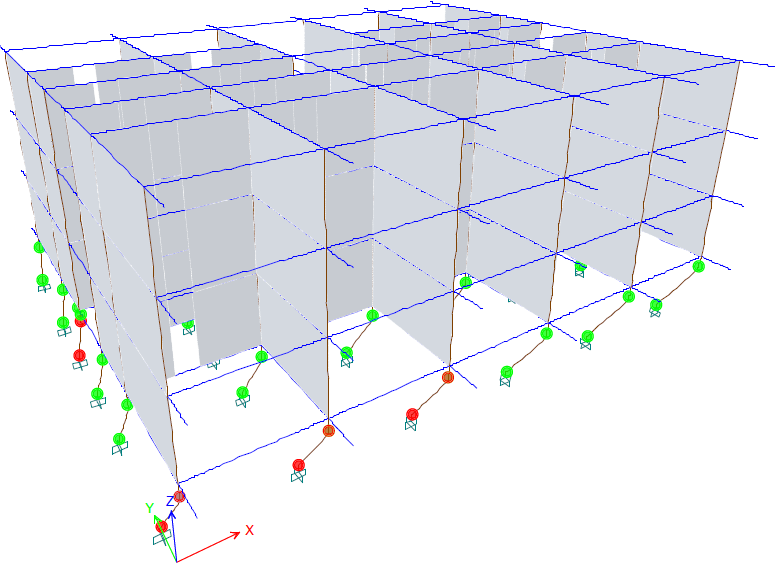 Figure 20: PYW step 25 solution 2
If stiff nonbearing walls are not used, the plastic mechanism on direction X is created when plastic hinges reach stage D at some columns bottoms and E at others. There are plastic hinges at all the beams ends on both directions. The last nonlinear analysis step on direction Y shows plastic hinges in stage C at the columns bottoms and in stage B at the beams ends on direction Y. If stiff masonry walls are used, the plastic mechanism is formed when plastic hinges reach stages D and E at the ends of the ground floor columns. There are plastic hinges at the ground story beams ends on direction X for case PXW and on Y for PYW. There are no plastic hinges seen in the floors above. It looks as if the ground floor columns are folded. The nonbearing walls do have a stiffening effect to the upper stories.
5.2. Plastic Stage Story Displacements
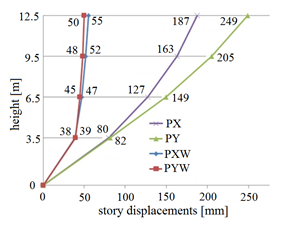 Figure 21: Story plastic displacements
For solution 1, where no masonry walls are present, the displacements reach high values. These values are greater for direction Y. The story displacements for the structure with masonry walls at the upper stories reach a certain value at story 1 and then show a slight increase towards the building top. The values are very similar for both X and Y directions. The values are 4 to 5 times smaller than for solution 1.
5.3. Pushover Diagrams
For cases PX and PY, where no partitioning walls are present, the maximum displacements are 5 times greater than for PXW and PYW. The maximum base forces reached for PY, PXW and PYW are similar. For case PY, the maximum force reached is smaller. Cases PX and PY diagrams show a slightly reduced rigidity at the beginning of the analysis, compared to PXW and PYW.
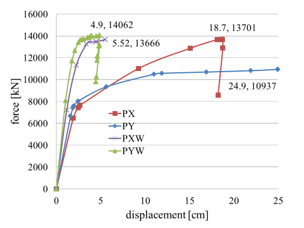 Figure 22: Pushover diagrams
When the base force approaches 8000kN, the rigidity visibly drops more for PY and less for PX. As the base force reaches 11000kN, PY rigidity drops nearly to 0 and is maintained like that until the analysis ends. For case PX, the base force nears 14000kN and then the base force drops while the displacement is maintained almost the same. This may be explained by the plastic hinges that reach collapse in the ground floor columns. Case PYW shows a greater rigidity than PXW form the beginning of the analysis to the maximum force. After this force is reached, the rigidity drops to nearly 0 for both cases. There is a slight stiffness increase for case PXW before collapse, but PYW shows a drop in force while the displacements remains the same.
5.4. Masonry Nonbearing Walls Results
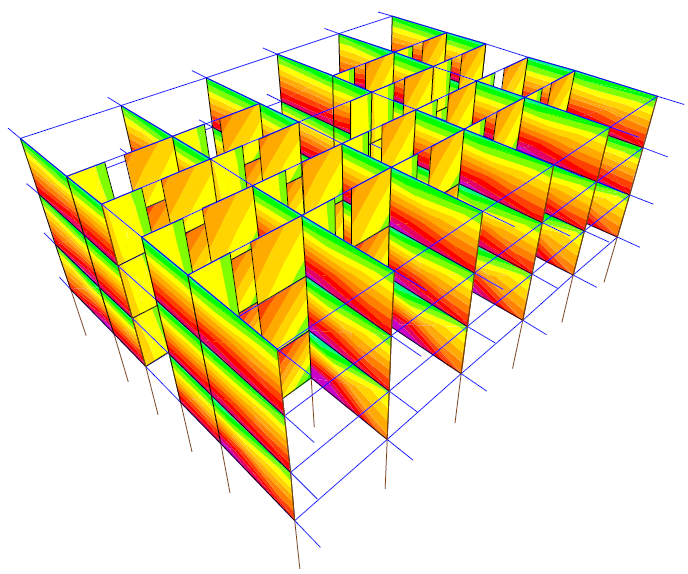 Figure 23: PXW step 2 σx=0.1N/mm2
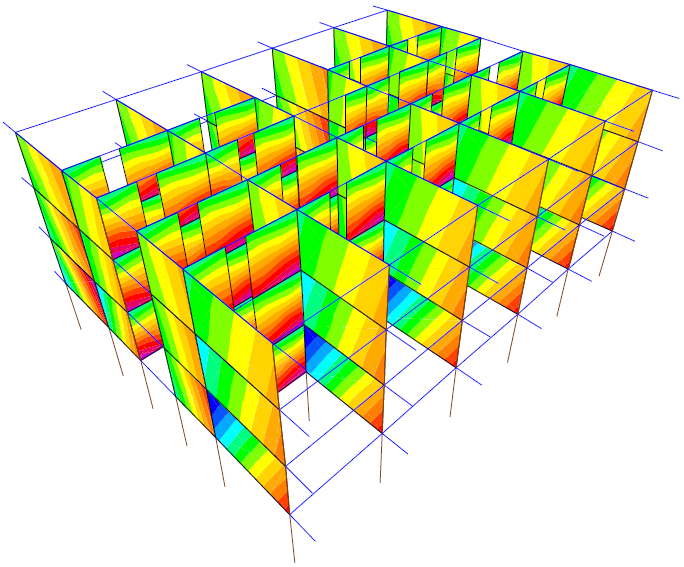 Figure 24: PYW step 8 σx=0.1N/mm2
Stress σx surpasses strength fdh from the nonlinear analysis second step. Both PXW and PYW cases generate corner crushing in the masonry panels on their directions. The highest stresses are in the walls at story 2. In the panels on the perpendicular direction, the stresses values increase from the bottom to top and also change the sign. This indicates a wall folding at about one third on story height measured from top to bottom. The stress reaches approximately the same values on both directions.
 Figure 25: PXW step 8 σz=0.4N/mm2
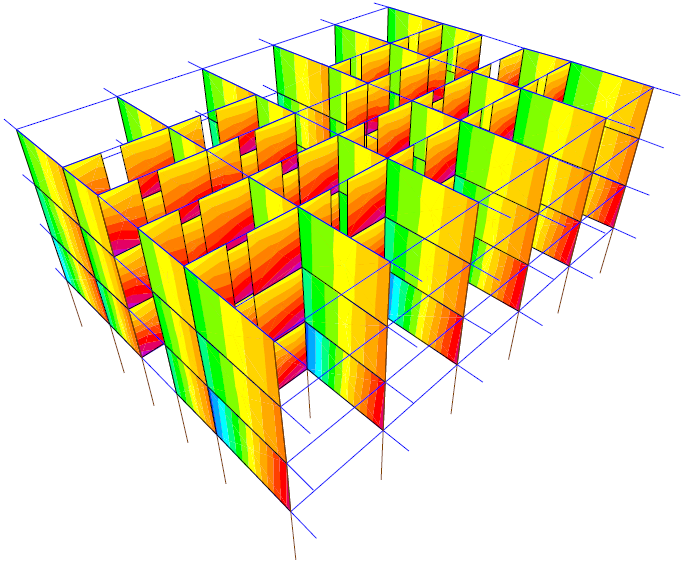 Figure 26: PYW step 8 σz=0.4N/mm2
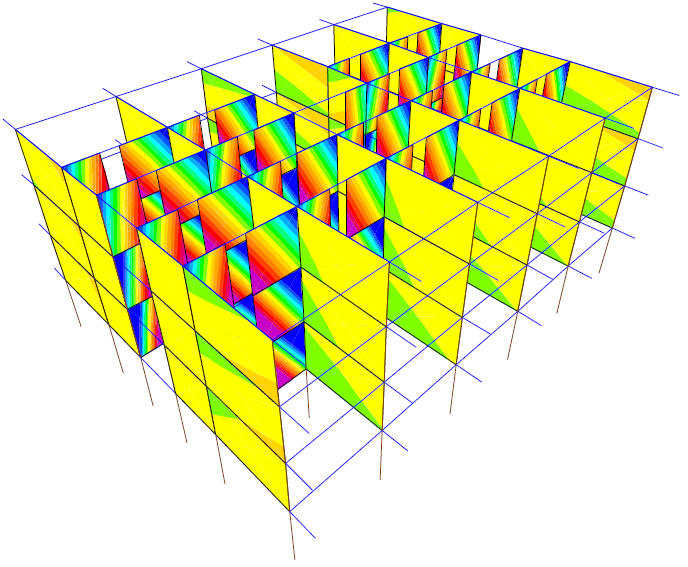 Figure 27: PXW step 1τxz=0.15N/mm2
 Figure 28: PYW step 1 τxz=0.15N/mm2
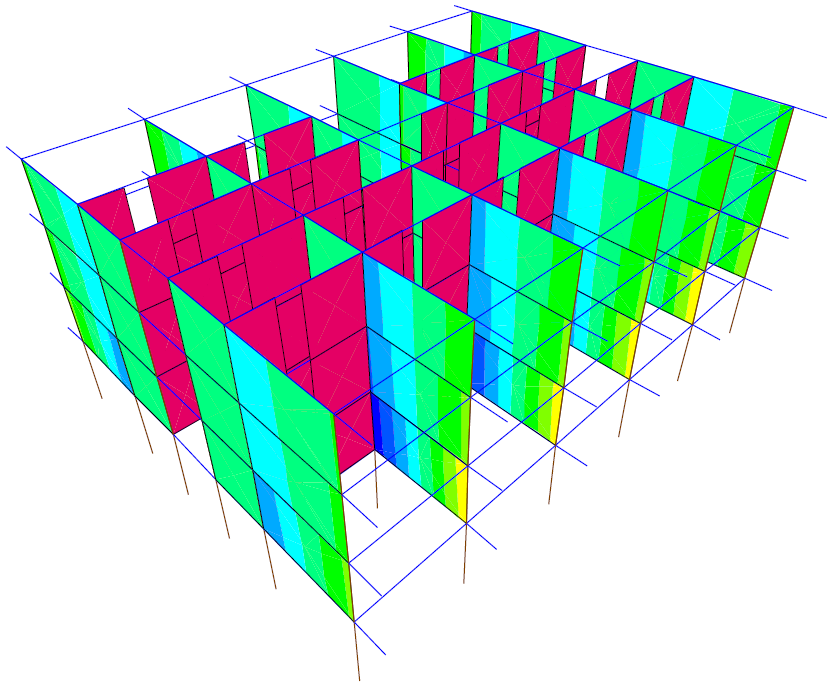 Figure 29: PXW step 1 F =1kN/m2
 Figure 30: PYW step 1 F =1kN/m2
Stress σz remains below strength fd throughout the nonlinear analysis. The stress pattern shows horizontal stripes indicating increased values from the wall top to bottom on the direction perpendicular to the load case. On the nonlinear case direction, the stress value stripes are vertical. This shows crushing on one side of the walls and stretching on the other.
Stress τxz surpasses strength fvd,0 from the first step of the analysis for both pushover cases. The stress values are very clearly seen in walls on the same direction as the pushover case. For PXW, the stresses are particularly increased at the walls corners. For PYW the stresses show horizontal stripes. The maximum values are reached both at the walls tops and bottoms, but the signs are opposite. There are stripes of zero stress at one third of the wall height from the top. This means the walls are „cut” at that zero stress line.
The horizontal seismic force perpendicular to the partitioning walls surpasses the theory design value form the first step of the analysis. The force values are practically 0 in walls parallel to the nonlinear case direction. In walls perpendicular to the loading case, the force values are seen as vertical stripes. The highest values are reached closer to the frame columns.
6. Conclusions
The autoclaved concrete walls are lightweight but they do have an influence on the structure. If the masonry walls are not present, the efforts values in frames are about 90% of these reached otherwise. This demands greater reinforcements in beams. The natural vibration periods are decreased by 20% if stiff partitioning walls are used. The walls can bear their efforts in the elastic stage. The plastic mechanism is greatly influenced by the nonbearing walls presence. The ground story columns are particularly affected, as plastic hinges form only there and develop until collapse. The pushover diagrams are greatly affected by the autoclaved concrete walls. They increase the structure rigidity and the maximum base force. Horizontal stresses surpass the masonry strengths at the first steps of the analysis. The horizontal seismic force reaches greater values than the theory design value form the first step of the analysis. The autoclaved concrete walls work well in the elastic stage. In the plastic stage they reduce the structure ductility and increase the maximum base force. The masonry walls reduce story displacements for both elastic and plastic stage.
Conflict of Interest
The author declares no conflict of interest.
- T. Guevara-Perez, „Soft Story and Weak Story in Earthquake Resistant Design: A multidisciplinary Approach” in 15 World Conferences on Earthquake Engineering (WCEE) Lisboa 2012 https://www.iitk.ac.in/nicee/wcee/article/WCEE2012_0183.pdf
- C.V.R. Murty, S.K. Jain, “Beneficial influence of masonry infill walls on seismic performance of RC frame buildings” in 12th World conference on Earthquake Engineering (WCEE) Auckland, New Zeeland, 2000. http://www.iitk.ac.in/nicee/wcee/article/1790.pdf
- Madan A and Hashimi AK. “Performance Based Design of Masonry Infilled Reinforced Concrete Frames for Near-Field Earthquakes Using Energy Methods” WASET, International Journal of Civil, Environmental, Structural, Construction and Architectural Engineering Vol:8, No:6, p 689-695, 2014. https://pdfs.semanticscholar .org/bbdd/eb245adce7d0b1604f474ad249e5a57c1397.pdf
- M. Dhanasekar, “Shear in Reinforced and unreinforced masonry: response, design and construction” in The 12th East Asia-Pacific Conference on Structural Engineering and Construction. Elsevier Procedia Engineering 14 2069-2076, 2011. doi:10.1016/j.proceng.2011.07.260
- A. Furtado, H. Rodrighez, A. Arede, H. Varum, “Experimental evaluation of out-of-plane capacity of masonry infill walls” Elsevier Engineering Strucutres Vol. 111, p 48-63, 2016. https://doi.org/10.1016/j.engstruct .2015. 12.013
- S. Pujol, A. Benavent-Climent, M. E. Rodriguez, J.P. Smith-Pardo, “Masonry infill walls: an effective alternative for seismic strengthening of low-rise reinforced concrete building structures” in The 14th world conference on earthquake engineering. Beijing, China 2008 http://www. jdwhite.com/ sites/default/files/uploadedfiles/tp-Masonry Infill Walls. pdf
- H. Jiang, X. Liu, J. Mao, “Full scale experimental study on masonry infilled RC moment-resisting frames under cyclic loads”, Elsevier Engineering structures 91, p70-84, 2015. http://dx.doi.org/10.1016/j. engstruct.2015.02. 008
- M. Teguh, “Experimental evaluation of masonry infill walls of RC frame buildings subjected to cyclic loads” Elsevier Procedia Engineering 171 Sustainable Civil Engineering Structures and Construction Materials, p 191-200, 2016. doi:10.1016/j.proeng.2017.01.326
- N. N. Thaickavil, J. Thomas, “Behavior and strength assessment of masonry prisms” Elsevier. Case Studies in Construction Materials 2018 Vol. 8, p 23-38. https://doi.org/10.1016/j.cscm.2017.12.007
- B. Li, Z. Wang, K. Mosalam, H. Xie Wenchuan, “Earthquake Field Reconnaissance on Reinforced concrete on reinforced concrete framed buildings with and without masonry infill walls” in The 14th world conference on earthquake engineering. Beijing, China, 2008 https://scholar.google.ro/
- A. Abd-Elhamed, S. Mahmoud, “Linear and Nonlinear Dynamic Analysis of Masonry Infill RC Framed Buildings” C.E.J. Vol. 3 Nr. 10, 2017. http://dx.doi.org/10.28991/cej-030922
- P. Naik, S. Annigeri, “Performance evaluation of 9 story RC building located in North Goa” 11th International Symposium on plasticity and Impact Mechanics, Implast, Elsevier Procedia Engineering 173, 2017. p 1841 -1846 ,2016 . doi:10.1016/j.proceng.2016.12.231
- R. Rahnavard, F. Fathi Zadeh Fard, A. Hosseini, M Suleiman, “Nonlinear analysis on progressive collapse of tall steel composite buildings”, Elsevier Case Studies in Construction Materials 8 ,2018 p 359-379. https://doi.org/10.1016/j.cscm.2018.03.001
- R. Rahnavard, N. Siahpolo, “Function comparison between moment frame and moment frame with centrically braces in high-rise steel structure under the effect of progressive collapse”, Journal of structure and construction engineering, Volume 4, Issue 4 – Serial Number 14, p 42-57, doi: 10.22065/jsce.2017.77865.1084
- CEN EN 1996–1–1–2006 Eurocode 6: Design of masonry structures – Part 1-1: General rules for reinforced and unreinforced masonry structures, 2006.
- CEN EN 1991-1-1-2004 Eurocode 1: Actions on structures – Part 1–1: General actions- Densities, self-weight, imposed loads for buildings, 2004.
- CEN EN 1990–2004 Eurocode 0: Basics of structural design, 2004.
- CEN EN 1991–1–3–2005 Eurocode 1: Actions on structures – Part 1–3: General actions- Snow loads, 2005.
- CEN EN 1992–1–1–2004 Eurocode 2: Design of concrete structures – Part 1–1: General rules and rules for buildings, 2004.
- CEN EN 1998–1–2004 Eurocode 8: Design of structures for earthquake resistance. Part 1: General rules, seismic actions and rules for buildings, 2004.
- P100-1/2013 Seismic design code – Part 1- General rules for buildings, 2013.
- R.Rahnavard, A. Hassanipour, A. Mounesi, “Numerical study on important parameters of composite steel-concrete shear walls”, Journal of Constructional Steel Research 121 2016 p 441–456. doi:10.1016/j.jcsr. 2016.03.017
- R. Rahnavard, M. Naghavi, M, Abudi, M. Suleiman, “Investigating Modeling Approaches of Buckling-Restrained Braces under Cyclic Loads”, Elsevier Case Studies in Construction Materials, Case Studies in Construction Materials 8, 2018 p 476–488. https://doi.org/10.1016/j.cscm. 2018.04.002
- R. Rahnavard, A. Hassanipour, M. Suleiman, A. Mokhtari, “Evaluation on eccentrically braced frame with single and double shear panels”, Elsevier Journal of Building Engineering 10, 2017 p 13–25. http://dx.doi.org/10. 1016/j.jobe.2017.01.006