Prospects of Wind Energy Injection in the Brazilian National Interconnected System and Impacts Analysis Through a Quasi-Steady Power Flow

Adv. Sci. Technol. Eng. Syst. J. 3(6), 185–189 (2018);
 DOI: 10.25046/aj030624
There is no doubt that the wind was the renewable source of energy that had the most significant growth during the last five years, and more importantly, the wind power source in Brazil has always been the cheapest and most competitive of all the others, so it is worth saying that wind have never been so well used. The wind energy generation in Brazil is hugely getting stronger, mostly in Northeast region where for the first-time energy auctions trough hydroelectric has been surpassed wind ones. Besides, there are still those who want to benefit from this significant advance, making Brazil the first country to collect royalties from the wind. In this paper a reviewed about Brazilian wind energy scenario and prospects will be done, enumerating the main impacts caused by this kind of power injection in a static analysis. In addition, a Quasi-Steady Power Flow (QSPF) will be simulated to show the impacts of loss, and voltage fluctuation created by the intermittence of wind resource. Numerical evaluation was performed in IEEE-30 bus benchmark system. Computer results, demonstrated the needing of control to make electrical variations smoothly on different periods of the day.
1. Introduction
The idea of generating electricity from wind came precisely with the development of electricity. With the development of coal and oil, in parallel, the wind was left aside as a source of electricity. However, from the petroleum crises on 70s, wind energy was once again used in the generation of electricity. The principle of conversion is very simple: kinetic energy are provided by rotating blades, where the force of wind turns its on and consequently, the machine rotors, multiplied by a gearbox to the generator. The mechanical power extracted from the wind by the wind turbine is given by half the products of the air density ( ), area swept by the rotor wind turbine ( ), wind speed ( ) power three and wind turbine power coefficient ( ), as shown in (1) [1]
![]() This energy is clean and renewable, there is no cost associated with obtaining a raw material. It is considered the cleanest source of energy in the world. It can be obtained in several places, including at sea, by offshore installations. These advantages of wind power have led several countries to establish incentives, regulating and driving financial investments to stimulate wind power generation [2,3].
This energy is clean and renewable, there is no cost associated with obtaining a raw material. It is considered the cleanest source of energy in the world. It can be obtained in several places, including at sea, by offshore installations. These advantages of wind power have led several countries to establish incentives, regulating and driving financial investments to stimulate wind power generation [2,3].
Wind power is in high growth and countries that do not have land area to install or expand their wind farms are opting for offshore installation. This is not the end of Brazil that has a large area to be explored and with better winds.
Wind energy is gaining its space in the Electric Energy Trading Chamber (CCEE in Portuguese), enabling the purchase and sale of energy throughout the country. CCEE promotes discussions focused on the evolution of the market, always guided by the pillars of isonomy, transparency and reliability. It acts as an institution responsible for offering the viability of purchase and sale of energy throughout the National Interconnected System [4,5]. This system of generation and transmission of electric power, is unique worldwide in its size and characteristics, encompassing the five regions of Brazil, with the purpose of efficiently generating power, giving the ability to choose which plants will generate energy and where this energy goes, this system of support and priority for wind power plants connected to the grid [6].
In this paper is shown a review about the wind energy context in Brazilian power system, enumerating the main impacts caused by its intermittence factor. Only static analysis is performed, and then parameter as harmonics injection, frequency and angular stability are not cover in the context. Besides, a briefly explanation about the national electrical energy corporation and its structure are treated. Finally, a Quasi-Steady Power Flow (QSPF) is simulated to present the main impacts of wind generation on voltage and losses.
This paper is structured as follows: Section 2 presents the general aspects of wind energy in the world scenario, as well as its trends and perspectives for generation. Section 3 explains the organizational structure of the Brazilian electrical sector. Section 4 shows the market aspects for wind energy in the Brazilian scenario. Section 5 handle numerical results obtained through simulations. Finally, section 6 presents the conclusions.
2. General Aspects of Wind Energy
Wind energy, among renewable energy technology, had shown the greatest growth in Brazilian system and around the world. In northeast side of the country the presence of these source is now greater than hydroelectric, which in terms of total generation reach more than 70% of injection [7-9].
2.1. Wind Energy around the World
Wind energy price is cheaper than the price of thermal energy. However, according to the Global Wind Energy Council (GWEC) report, there was a decrease in the amount of new capacity installed in 2017 compared to the previous two years, this is justified by the elimination of subsidies and institutional support in several countries that undermined investments, at a time when the wind industry is in transition to a system based on the rules of the market [7].
In Brazil, installed capacity in 2017 was 2 GW, representing 4% of the world and the accumulated capacity reached 2% of the global total with 12.8 GW. The country surpassed Canada in the world ranking in accumulated installed capacity going to 8th place. However, given its territorial, population and economic dimensions, Brazil has done little to produce wind energy. [10]
On world stage, wind energy is advancing strongly on the high seas. Navigant Research reports that the global wind industry has installed 3.3 GW of offshore capacity by 2017, attracting approximately 17 GW of global total accumulated. In Germany, the industry had its first “no-subsidy” auction this year, with proposals for more than 1 GW of new capacity. In the next five years, the global market for offshore wind energy must install more than 24 GW of new capacity, and by the end of 2022 should reach the accumulated of 40 GW [ 8].
2.2. Brazilian context on Wind Energy
According to the GWEC, report of 2015 shows that Brazil has the best winds in the world, it has a wind power potential three times higher than the country’s electricity needs, and that the capacity factors Brazilians are above the global average. While Brazil goes from 50% and in times of best winds 70%, the other countries average 25% of capacity factor [5].
With the exception of the Amazon region, the potential of the winds is distributed in the national territory, more intense from June to December, coinciding with the months of lower rainfall intensity (less generation of energy in the hydroelectric plants) [11].
Currently, wind energy is the 3rd place in the Brazilian electricity generation matrix. From December 31st, 2016 to December 31st, 2017, the generation of energy by wind power represented about 7% of all electricity generation [6].
2.3. Trends and perspectives for generation in Brazilian scenario
Diversity in an energy matrix guarantees greater security to the system because it is not dependent on a single source. If there is a problem with a specific source, there are others to continue generating. An example of it are the hydroelectric power plants: In some periods the flows of the rivers decrease, thus decreasing the generation of energy, requesting the actions of other sources, such as thermoelectric plants. In a recent case, on the current year, Brazil was over a truckers’ strike, which prevented diesel oil from reaching a thermal plant, affecting directly the interconnected system and consequently the energy price. Not being dependent on just a few sources is advantageous for system reliability [6].
Incentive Program for Alternative Energy Sources (PROINFA in Portuguese) encourage the development of renewable sources in the energy matrix and paved the way for the fixation of the component industry and wind turbines in the country. At the end of 2009, the 2nd Brazilian Energy Reserve Auction (ERA) was held, which was the first auction to sell energy exclusively from wind power sources, contracting the amount of 1.8GW [12].
In August 2010, the 3rd ERA and the Alternative Source Auction (ASA) were held, where 2GW of wind power was contracted. These auctions no longer worked exclusively with the wind model, but included several renewable sources competing with each other to negotiate their energy in the auction. The price of wind energy was lower than biomass energy price and Small Hydroelectric Power Plants (SHP) [13].
In 2011, the A-6 auction became the second cheapest energy, soon after the hydroelectric plants. About 49 wind farm projects were contracted, with a physical guarantee of 776.6 average MW and a power of 1,386.9 MW, shown itself to be more competitive than biomass and SHPs [13].
In addition to PROINFA and specific auctions mentioned before, the wind power also sells its energy, on a smaller scale, in the Free Market where contractual conditions are freely negotiated bilaterally.
With better winds, institutional incentives and receptiveness to investments from abroad, Brazil has the cheapest wind energy in the world. By 2020, wind power should have a 12% of presence in country’s energy matrix [13].
3. Organizational structure of Brazilian energy sector
Brazilian electricity generation and transmission system is predominantly hydrothermal with continental dimensions and huge amounts of hydroelectric power plants. The National Interconnected System (SIN in Portuguese) is made up of four subsystems: South, Southeast/Midwest, Northeast and North [6].
The interconnection of the electrical systems, through the transmission grid, facilitates the interchange between subsystems, allows obtaining synergistic gains and explores the different hydrological regimes of rivers. The integration of generation and transmission resources allows supplying the market with security and economy [14].
CCEE is a non-profit civil association, whose purpose is to enable the commercialization of electric energy in the Brazilian energy market. It brings together companies of generation of public service, independent producers, self-producers, utilities, commercializes, importers and exporters of energy [13].
The contracting of energy can occurs through two environments: (1) the Regulated Contracting Environment (ACR in Portuguese) that should meet the demand of distribution utilities who can only buy energy through the auctions held by CCEE. In these auctions, generators and sellers compete with each other for provide demand of distribution utilities; and (2) the Free Contracting Environment (ACL in Portuguese) where, generators, consumers and sellers negotiate bilaterally buying and selling energy, i.e., they are free to negotiate.
The Short-Term Market accounts the differences between what the agents contracted and what was actually produced or consumed in both environments (ACL and ACR). The Settlement Price of Differences (PLD in Portuguese) is the reference price of the short-term market, used to set a price on what was generated and what was consumed by all market participants.
Several factors influence the computational models used in the calculation of PLD: the occurrence of rainfall in the areas where hydroelectric reservoirs are located, which is the amount of water that can be transformed into electric energy, and the behavior of the load that can be influenced by temperatures. PLD is calculated weekly by the CCEE for four submarkets (subsystems) and three load levels (light, medium, and heavy) and is used to assess differences in the short-term market [4].
The Mechanism of Compensation for Wastes and Deficits has application exclusively on Energy Trading Contracts in the Regulated Environment. It promotes energy and power transfer associated with sellers among distribution agents that have leftover energy for distribution agents with energy deficits; it minimizes or eliminates any penalties for insufficient energy ballast [15].
4. Market aspects for wind energy in Brazilian scenario
The northeastern subsystem is directly affected by the hydrological shortage due to geo-climatic conditions, and as a consequence, it is in the long and bitter energetic instability that has been overcome in the last five years. Renewable energies such as wind power were fundamental to avoid the shortage of the Northeast, and the significant relevance of this was the lack of use of reserve energies for this purpose.
According to Steve Sawyer, GWECs General Secretary, wind power is the most competitive option to add more capacity to power grid in many growing markets such as Africa, Asia and Latin America. By 2030, wind power could reach 2,110 GW and account for up to 20% of world energy [16].
The New Energy auctions, handled by CCEE, are executed and presented through two phases, among which, the first one aims to reduce the risks to generators and buyers, where it is constituted by a given qualification question per bid price, considering the capacity of SIN. The second one consists of a continuous phase for the enterprises classified in the first phase, where the selection criterion is for a lower price, with four different products per source.
It is valid to report that, during the auction of the New Energy A-4 auction, after the one-hour period with a stabilized current price, hydro and wind sources returned to decrease values, dropping more than 30%, where energies such as wind and solar has more than 60% reduction in price [9].
Fiscal incentives such as the installation of a wind farm in the city of Paulino Neves (state of Maranhão) in 2017 have contributed to Brazil’s growth in the ranking of wind energy producers. Through an investment of around BRL 1.5 billion, Maranhão is another state that adheres to the global trend of sustainable energy production at the pole of energy produced through the winds. It is worth noting that the country exceeded Canada and ranks eighth in the world ranking of wind energy producers. The consequence of all this investment in wind power production in one more state of the Northeast subsystem may reflect positively on the cost of energy to consumers, mainly because most of the parks are located in the same, being considered as the best location for capitation of winds in the world. Recalling also, that the Northeast Region only escaped rationing last year because of the wind turbines. In the critical phase of hydroelectric plants, wind farms supplied 11% of Brazil and 60% only in the Northeast.
One resource, increasingly adopted in several countries, is the storage of the cheapest energy available in the system, possibly part of that generated by intermittent sources, to be used in the absence of this generation. Thus, part of the intermittent generation or other sources would have their consumption postponed to times of greater need, and could then receive higher prices, which would compensate for losses incurred in filling and emptying the energy reservoirs, be they hydraulic, batteries or other, less usual. Another advantage of the accumulation is that it can be made with energy generated by the plants based on renewable sources [17,18].
5. Numerical Results
Simulations were performed in a MATLAB® R2015a (8.5.0.197613) environment on an Intel (R) Core i7-4770S 3.1 GHz, 4- cores and 8GB of RAM with the aid of statistics and Machine learning toolbox. To obtain the results, the IEEE-30 System was used, containing 30 bus, 6 generators, 41 lines and a total load of 283.4 MW and 126.2 MVAr of active and reactive power respectively. The proposed methodology involved the simulation of a QSPF, applying 100 intervals of time in a load curve modeled by a normal type PDF. Three buses of the System were chosen for inclusion of wind farms. Generators configurations or turbines are not a problem concerned in this simulation, as they are modeled just as injection active power. The criterion for selection of buses was those with higher density of load that did not contain generation. It is clear that in a real situation the installation of wind farms depends on the energy availability among several other factors that could influence the investment. A penetration percentage of 10%, divided proportionally by the amount of load of each of the buses chosen, was considered. The generation of energy through the wind farms was modeled from a Weibull PDF. For the proposed methodology, wind farms do not have reactive control, being modeled only as active power injections.
Trough numerical results presented in all figures, it could be said that all electrical variables in the system will be affect by the intermittent feature of wind source. The most evident technical impact can be noticed on voltages profile, especially in the WF bus and its neighbor’s bars.
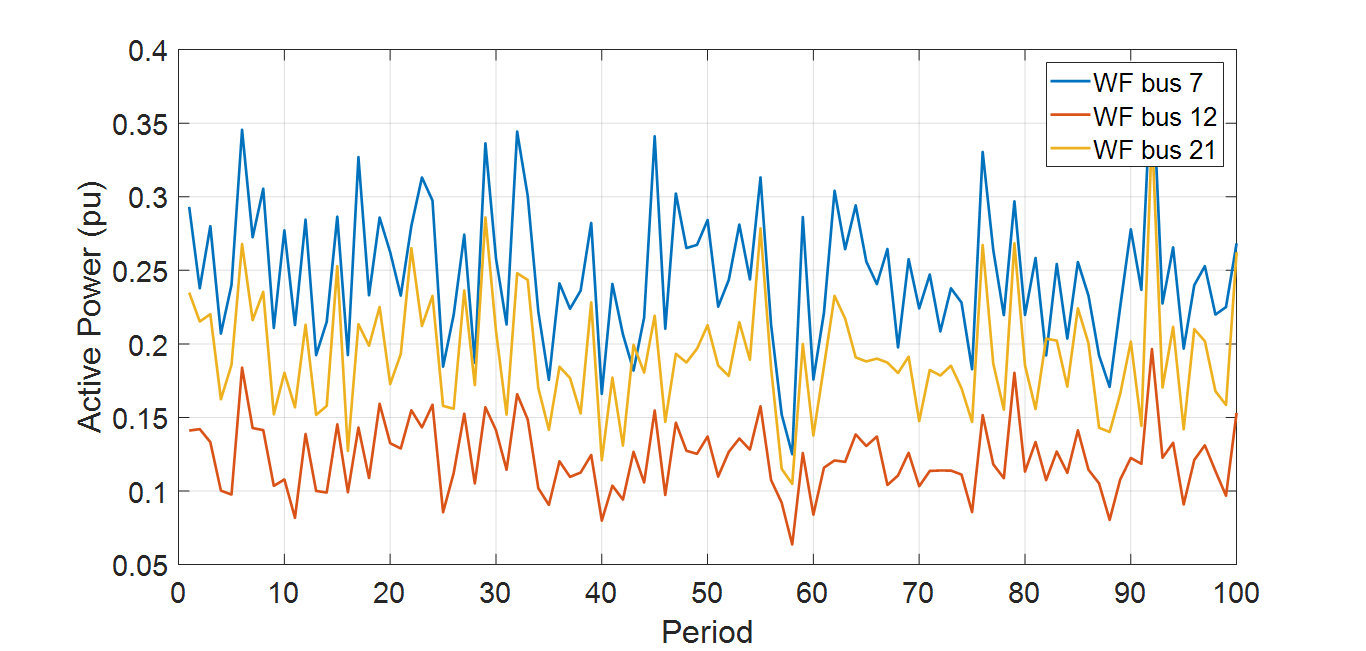 Figure 1: WF profile of active power injection
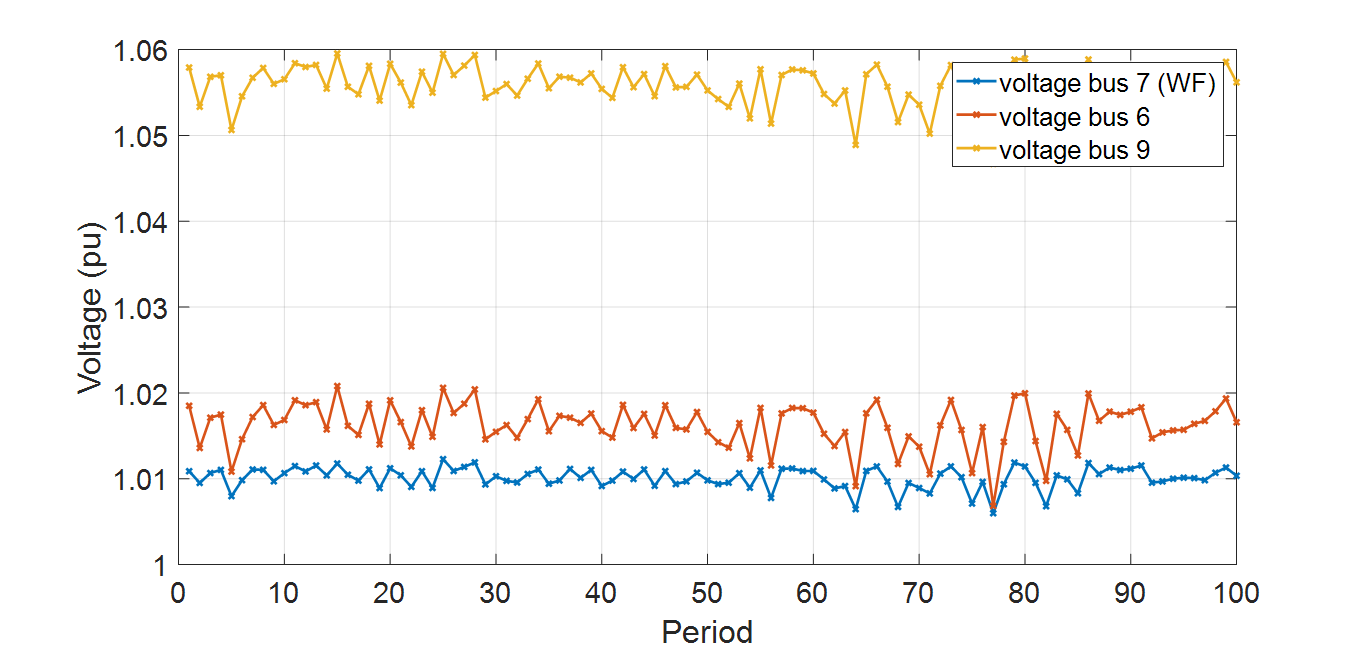 Figure 2: Voltage profile for buses near WF located in bus 7
 Figure 3: Voltage profile for buses near WF located in bus 12
The generation profile for the 100 periods executed in the quasi-steady power flow are recorded in Figure 1.
 Figure 4: Voltage profile for buses near WF located in bus 21
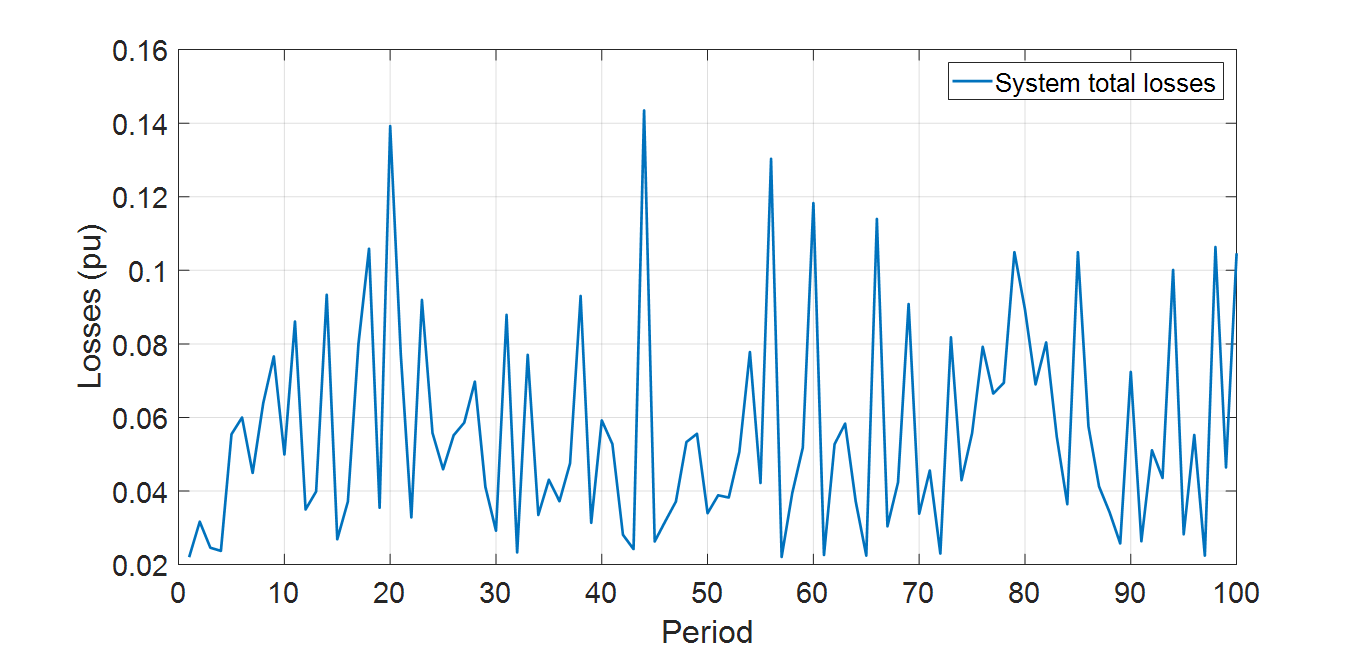 Figure 5: WF profile of active power injection
Voltage profile for WF buses and neighbor buses are shown in Figure 2-4.
System losses according to all 100 periods are shown in Figure 5.
For example, in Figure 3, voltage in bus 14 goes from about 1.02 to 1.06 in a short period of the QSPF. In other situation these variations can be smooth, but simulations show that the bigger the wind power injection, bigger will be these variations, especially when the system presents weak profiles of voltage. This variability makes the operator of the system to improve its control technics, for example, using FACTS devices to make it smoother voltages variations [19].
Another factor that can be mentioned is the systems losses. This analysis is general for all systems that involves generation near the load (distributed generation). The explanation can be done in a very simple way: As an amount of energy is being generated close to a charge, those loads can consume this power, and the amount of energy that was coming from a distant source it will no longer be needed. By this way, a smaller current will pass through transmission lines, decreasing and losses. The situation get clearer looking at Figure 5. When the system losses are greater (period 20, 43, 56, 60 and 67) it means that wind power injections are lowers, and for the lower losses (period 1, 2, 58 and 71), wind are almost down [20].
6. Conclusion
The future of electric energy is that: A clean and renewable generation system with distributed generation across the entire grid. It is worth mention that the growth and application of those technologies are exponentially noticed. Brazilian investors already realize that wind is potentially the future base of power system and those investments are taking huge proportions. National Interconnected system have to be ready to absorb greater amount of intermittent power. Commercially wind energy have to overcome the reliability problem trough precise forecasting resources to supply the variability of the source. Numerical results on section 5 shows the needing of control to handle the changeability of voltage. Besides, it is clear from simulations that the fact of including distributed generation in a power system, improve overall grid losses.
Acknowledgment
We thank ISL Wyden International College for technical support, which provided a good environment to develop this research.
- CHENG, M.; ZHU, Y. The state of the art of wind energy conversion systems and technologies: A review. Energy Conversion and Management, v. 88, p. 332–347, Dezembro 2014.
- Impacts and Challenges in operating Planning”, in Portuguese, Bsc. Thesis, Federal University of Rio de Janeiro, 2014
- CAILLÉ, A. et al. 2007 Survey of Energy Resources. United Kingdom: World Energy Council, 2007. Disponível em: <http://citeseerx.ist.psu.edu/viewdoc/download?doi=10.1.1.481.5707&rep=rep1&type=pdf>. Acesso em: 3 ago. 2015.
- CCEE Documents “Maketing Rules”, Version 2018.1, available online on: www.ccee.org.br/
- M.H. Nascimento, “Impacts of wind farms in electrical market”, in Portuguese, Msc. Thesis, UFI, 2005
- J. E. Ferreira, “Impacts of wind energy generation in market prices”, in Portuguese, Msc. Thesis, ISCET Business School, 2016
- Global Wind Energy Council, “Global Wind Report”, Annual Market Update 2017, Available online on: www.gwec.net
- GWEC. Global Wind Energy Outlook 2014. [s.l.] GWEC, 2014. Disponível em: <http://www.gwec.net/wp-content/uploads/2014/10/GWEO2014_WEB.pdf>. Acesso em: 9 set. 2015.
- ABEEólica-Brazilian association of wind energy, “Annual generation bulletin 2017”, available online on: http://abeeolica.org.br/wp-content/uploads/2018/04/Boletim-Anual-de-Geracao-2017.pdf
- A. P. Correa, “Wind energy in Market”, in Portuguese, Msc. Thesis, Thesis, ISCET Business School, 2014
- ONS Documents, “MONTHLY WIND GENERATION BULLETIN”, August 2017, Available online on: ons.org.br/
- ABEEÓLICA. Boletim de Dados – Julho 2015. São Paulo: ABEEólica, jul. 2015. Disponível em: <http://www.portalabeeolica.org.br/index.php/dados.html>.
- CCEE. Consolidated results of auctions – 03/2015. [s.l: s.n.]. Available on: <http://www.ccee.org.br/ccee/documentos/CCEE_347805>.
- M.S. Simas, “Wind Energy and sustainable development in Brazil”, in Portuguese, Msc. Thesis, USP, 2012
- J. Pessanha, V. L. O. Castellani, V. A. Andrade “Short-Term Wind Power Forecasting Based On Quantile Regression”, Brazil Windpower, 2017
- S. O. Nunes 1, E. O. Teles 2, E. A. Torres 3, “Risk Analysis in the Wind Energy Market: A Review”, Brazil Windpower, 2017
- Kim, K., Park, H., & Kim, H. (2017). Real options analysis for renewable energy investment decisions in developing countries. Renewable and Sustainable Energy Reviews, 75, 918-926.
- Li, F., Liu, Z. C., Jia, X. X., Zeng, M., & Li, N. (2012). Investment Risk Assessment Model for Wind Power Projects Based on Full Life-Cycle Theory. East China Electric Power, 40(4), 0531-0535.
- AYODELE, T. R.; OGUNJUYIGBE, A. S. O. Mitigation of wind power intermittency: Storage technology approach. Renewable and Sustainable Energy Reviews, v. 44, p. 447–456, abr. 2015.
- BLACK, M.; STRBAC, G. Value of Bulk Energy Storage for Managing Wind Power Fluctuations. IEEE Transactions on Energy Conversion, v. 22, n. 1, p. 197–205, mar. 2007.