Student Performance Evaluation Using Data Mining Techniques for Engineering Education

Adv. Sci. Technol. Eng. Syst. J. 3(6), 259–264 (2018);
 DOI: 10.25046/aj030634
In this research work, we are implementing a student performance evaluation model using Mamdani Fuzzy Inference System (FIS) and Neuro Fuzzy system and comparing the results with classical averaging method for Network Analysis (NA) course studied by third semester Electronics and Communication Engineering students. This work explains the designing of scoring rubrics using Bloom’s levels as the criteria of assessment for NA course. Also at initial stages of learning how students’ strengths and weaknesses can be identified using rubrics and develop critical thinking skills. The five inputs identify, understand, apply, analyze and design/create are five levels of learning as per Bloom’s Taxonomy. Fuzzy rules are applied and the evaluated results are expressed in both crisp and linguistic variables and compared with classical aggregate scores.
1. Background and Motivation
Performance evaluation is always a challenge for a tutor after a learner undergoes a learning process or training program. Earlier the final grade for any course would mean the averaging of internal assessment scores and semester end examination scores. Later different activities like quiz, mini projects, seminars etc. were introduced in the course learning process to inculcate the higher order or critical thinking skills. In this process to the averaging method fails to highlight on the learners’ critical thinking abilities. Also take a case of two students with same average marks but scores of both are like this, first student 65,75, 85 and second student 85,75,65. Here the average of the two students is same but first student is continuously improving the performance where as the second student is not. But a simple averaged grading method at the end of the course may not through light on all these issues of understanding, improvement or attainment of higher order thinking skills etc. [1]. The grades of evaluation of learners should in an ideal situation reflect their understanding of the course learnt, application of it in solving challenges of real life situations or solving similar issues by modifying the existing solutions or developing a new solution. Instead, continuous assessment of learner on daily/weekly basis is performed for given tasks and if a rubric with Bloom’s criteria for evaluation on one side of the table and scores on the other side for predefined criteria is designed to evaluate the critical thinking skills for each of the tasks assigned then the rubrics scores clearly indicate the strengths and weakness of learner, levels of critical thinking skills attained, understanding of the course on daily/weekly basis [2,3]. The scores so obtained are then subjected to suitable soft computing evaluation technique where each level attained by learner is weighted. The final grade so obtained should give details of the rubrics scores highlighting these thinking abilities of a learner for the course learnt, the activities performed during the training period. Whenever the rubrics scores for daily/weekly (formative) assessments are discussed with the learner the learner understands the natural thinking abilities and they can be strengthened and if the learner is willing to work upon weak areas for improvement, then he/she can take guidance from the tutor and improve upon them. The rubrics scores for every task assigned can give early indications of strengths and weakness’ to both learner and tutor. Such formative assessments provide scope for improvement in final grades and skills of learner and even tutor can plan new learner centric teaching methodologies.
The scoring rubrics [2,3,4] can be designed for each activity stating clearly the evaluation criteria/objectives to attain the standards set for the said activity. They can be used for formative and summative assessments. The grading is unbiased, more objective and the degree of attainment is easily understood by both learner and tutor. The rubrics can be modified during learning phase if required to improve standard of learning. The NA course demands identifying different circuit elements, understanding and applying Kirchhoff’s Laws and finally calculating the various currents, voltages and designing equivalent networks. The different levels set to evaluate critical thinking skills are identify, understand, apply, calculate and create. The Bloom’s Taxonomy levels are set as standards for evaluation.
Bloom’s Taxonomy was designed in 1965 by Dr. Benjamin Bloom[5,6] to improve learning standards in higher education. As per this, three domains of learning are described. Namely Cognitive – Knowledge, Affective- Attitude and Psychomotor- Skills. The cognitive domain involves the development of intellectual skills and knowledge. This is further divided into six orderly categories. These are commonly referred as Bloom’s levels and are in the increasing order of complexity and thinking abilities. Now it is referred globally to evaluate critical thinking skills, for defining course objectives, designing cognitive level course activities and tests, setting question papers at different levels etc.
In this work we have tried to overcome the drawbacks of averaging method by evaluating learner performance using scoring rubrics tool designed for Network Analysis course. The rubric is designed keeping the critical requirements of the said course like identifying different electrical elements of a network, analyzing the network for its loop and branch currents, node and branch voltages, related power calculations etc. Later, making use of this knowledge in creating or building new simple solutions for real life scenario. Also while designing rubrics tool to evaluate the learners’ for critical thinking skills, Bloom’s levels or higher order thinking skills are set as criteria/bench mark for evaluation. After designing the rubrics, it is discussed with the learners so that they understand the different criteria for evaluation. The score/grade card mentions the rubrics scores obtained indicating different levels attained by each learner for different tasks completed along with average/weighted average grade of performance (it may be CGPA –cumulative grade point average or percentage of scores). The soft computing techniques are investigated for suitability to evaluate the performance [7,8]. The Neuro-fuzzy (NF), Fuzzy inference system (FIS) are tested and performances are compared with classical averaging method for student performance evaluation. .
Professor L. A. Zadeh invented the concept of Fuzzy Logic in 1964. In 1974, Mamdani developed first fuzzy logic controller which is used in predicting results when data is imprecise, vague or some data is missing. Fuzzy controllers are widely used in forecasting weather, stock market, product market, health monitoring systems, aviation systems, temperature and pressure controllers in manufacturing industries etc. It is rule based and reliable.
2. Literature Review
A good number of researches have been reported since 1995 on student performance evaluation using soft computing techniques. Authors have proposed a fuzzy logic based model for performance evaluation of Network Analysis course [1,2] . The early work by Biswas used fuzzy sets for evaluation of students answer scripts by matching the answer scripts in 1995 [9]. But when large number of papers are to be evaluated this becomes tedious. Intelligent expert systems were implemented not using the complicated matching operation of answer scripts, instead [10] a more generalized method using degree of satisfaction and extended fuzzy grade sheets. A cricketer performance evaluation model was presented to predict international rank of a cricketer and also the effect of each input parameter like ranking of the teams being played, current ranking of the player, run rate etc are evaluated and rank of cricketer is predicted. Also the effect of each parameter on performance is discussed [11].The drawbacks of conventional method of evaluation performed in universities considering higher weightage to attendance is discussed in [12] also a new method using fuzzy logic considering student attendance as one of the parameters along with internal and external marks as input parameters is implemented. A personalized student evaluation method is presented in comparison to the back propagation and conventional statistical methods in [13]. Every student is unique and fuzzy systems can make decisions and evaluate student performance along with students learning progress Such a unique model is presented in [14]. In [15] the authors opine that the performance of the students depends upon their previous performance, medium of instruction and type of board affiliated to using WEKA tool and compare the results of various classifiers. There are several factors which affect the performance of students,[16] authors use the combination of Genetic Algorithm and Artificial Neural Networks to predict the performance and also to find the factors which influence the performance of students. In another paper authors predict performance considering gender, location of house, family income, medium of instruction along with previous semester grades, attendance [17]. The application of fuzzy inference system in predicting the traffic flows by considering traffic related parameters is discussed in [18]. Neuro fuzzy systems in which the different attributes are used to predict performance in crisp values. It also provides an alternate solution when data available is vague and imprecise and classify the students’ performance into different categories [19,20]. Student performance evaluation and prediction can be done using Surgeon-type ANFIS architecture. The membership functions generated by ANFIS using the training data predict the student performance (21).Prediction and evaluation can also be done using different types of data mining algorithms like C5, CART, ANN,SVM (22).Ensemble is one of the data mining algorithm used to classify recorded heart sound in (23). Classification using KNN is studied using certain distance algorithms such as Cosine, Correlation, Euclidean and City blocks in (24).By considering students’ previous performance, motivation level, family background future performance is predicted in to different classes as Very good, Good and Poor (25). The data mining techniques are used to obtain the hidden knowledge about the student performance (26).The performance of different data mining algorithms are compared by considering their ‘No of True positive’ values (27).
3. Methodology
In this work we design the rubrics for Network Analysis course as given in Table 2. for third semester Electronics and Communication Engineering students (ECE). This course deals with study of different electrical circuit analysis and simplification techniques like Mesh and Node analysis, Network Theorems for DC and AC circuits etc. This requires the basic knowledge of electrical elements, Ohm’s law and Kirchhoff’s laws.
The steps involved are as follows:
- Designing of Rubric – the rubric is designed after consultation with course experts and students.
- Content delivery and Designing of question paper – the course content is delivered and question paper is designed as per Bloom;s taxonomy.
- Data collection – The test is conducted and scores of 41 students in rubric profile are collected.
- Evaluation using FIS and NF models – The data collected is investigated using the two models mentioned as shown in Figure 1.
The different stages of designing the rubric tool and evaluation:
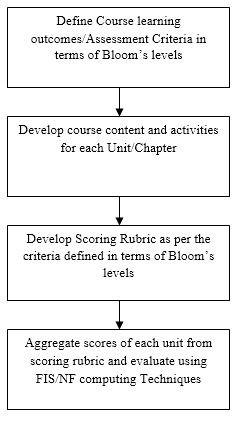 Figure 1. Designing of Scoring Rubric.
3.1. Fuzzy inference system (FIS)
The system which maps inputs to the outputs using fuzzy set theory is known as the Fuzzy Inference System. This can be either Mamdani or Sugeno. This system involves 3 steps, fuzzification of inputs using membership functions, formation of rule base using IF-THEN rules, defuzzification using output membership functions to get crisp values of outputs as shown in Figure 3. The membership functions can be chosen depending upon the requirement from the set of triangular, trapezoidal for linear variations and Gaussian, sigmoidal, zigmoidal etc.for nonlinear variations. We have used trapezoidal membership functions for both inputs and outputs as shown in Figure 2. Different weights are assigned to lower and higher order skills so that drawback of classical aggregation of scores is overcome. For example the scores above 8 are considered excellent for lower order skills like Identify whereas scores above 7 are considered excellent for hogher order skills like Apple and Create as shown in Table 2. The system can be made robust and flexible with the help of rules (13).
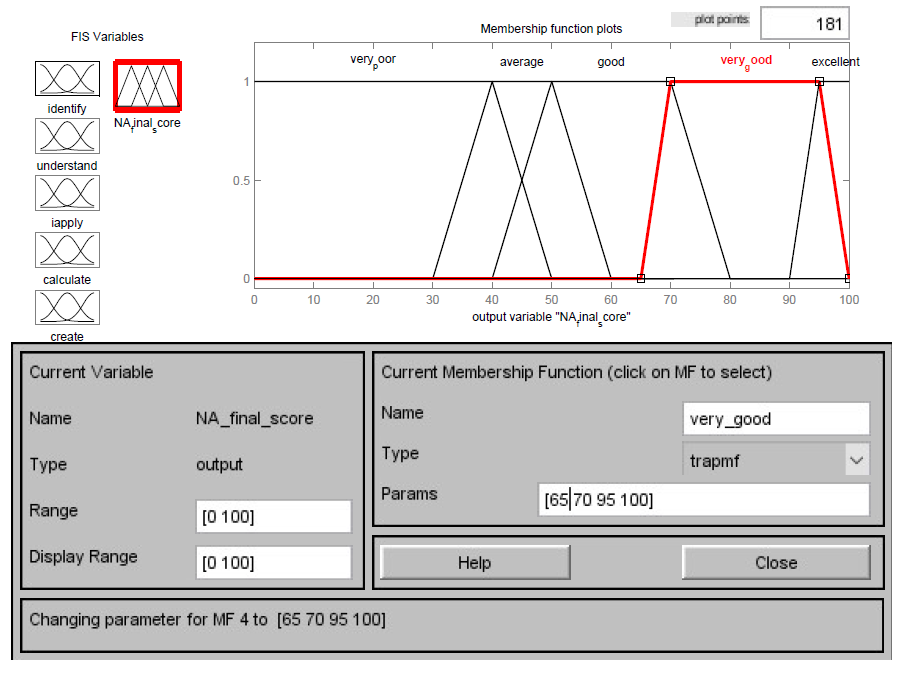 Figure 2. Membership functions for output.
Table 1. Input Variables
| Input Variable | Evaluation Criteria |
| F1 | Identify |
| F2 | Understand |
| F3 | Apply |
| F4 | Calculate |
| F5 | Create |
3.2. Neuro-fuzzy (NF)
The hybrid of fuzzy inference system and neural networks is Neuro- Fuzzy (NF) system as shown in Figure 4. It combines the advantages of ANN and FIS in terms of ability to learn and think respectively making any system intelligent and think like human beings. This hybrid system basically is a neural network and is trained to generate IF-THEN fuzzy rules and membership functions of fuzzy systems. It is possible to incorporate common sense, intelligence and knowledge into the structure of neuro-fuzzy systems. The neuro-fuzzy system consists of 5 layers. The first one is the input and last one is the output layer and remaining three are the hidden layers responsible for generating membership functions, calculations and normalization (10).
 Figure 3. Basic flow of FIS
 Figure 4: Basic bock diagram of NFZ
4. Results and Discussion
We have studied the rule based classifiers like Fuzzy (2), Neuro fuzzy systems which give 100% accuracy for classification. The crisp values for results are compared with classical averaging method. The initial time taken for these two systems is more if the data set is large for forming rule base in case of FIS or training the system in case of NF. Neuro fuzzy system and Sugeno fuzzy system are used with input variables as identity,
understand, apply, calculate, create as shown in Figure 4. and Figure 5.The output variables indicate the performance of
student’s in linguistic variables and are expressed as Poor<5, Average>5, Good (6.0-6.9), Very good (7.0-8.90) and Excellent (>9.0) and are given in Table 4 Final results in Crisp values and linguistic variable are shown in Figure 6.
The comparison line graph of FIS, NF and classical averaging are shown in Figure 7. Comparison of different types of classifier
results are as shown in Table 5.
Table 2. Final Scores in Linguistic Variables
| Final score of NA(linguistic variable) | very poor | average | good | very good | excellent |
| Crisp value | <5.0 | 5.0-5.90 | 6.0-6.90 | 7.0-8.90 | >9.0 |
 Figure 5. Fuzzy Inference System
5. Conclusions and future work
In this work we have compared the performance of Fuzzy Inference system and Neuro Fuzzy system with classical average scoring method. All these classifiers can be used to evaluate the student performance depending upon the accuracy of classification and time taken to classify. Depending upon the students attribute their performances are evaluated and classified into 5 classes as very poor, average, good, very good and excellent. We have compared the performance based on factors such as training time, accuracy of the classifier performance. Fuzzy inference and Neuro fuzzy systems give 100% classification accuracy and the results are comparable to classical averaging method. But if data is large then the training period is more and formation of rules, selection of membership functions lead to complexity. Depending upon the data size, accuracy required and training time constraint one can choose any of the above classifiers for performance evaluation. We would like to evaluate student performance using other soft computing techniques like Support Vector Machine,K- nearest Neighbour,Ensemble and Discriminant analysis in future.
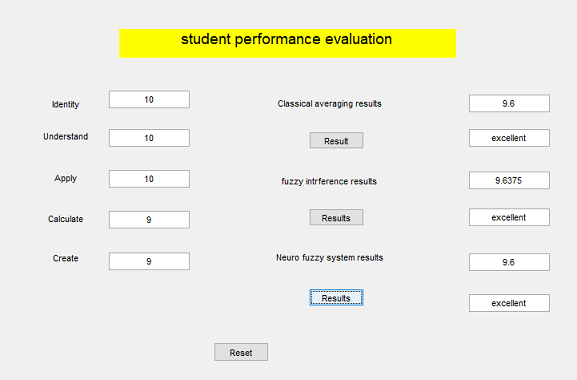 Figure 6. Result Comparison of different type of rule based classification
 Figure 7. Observation Comparison Between the classical method, fuzzy and Neuro fuzzy system
Table 3. Different scores assigned for fuzzification of input variables
| Input variables | unsatisfactory
|
satisfactory
|
good
|
very good
|
excellent
|
| Identify | <5 | 5.0-5.9 | 6.0-6.9 | 7-7.9 | >8.0 |
| Understand | <5 | 5.0-5.9 | 6.0-6.49 | 6.5-7.49 | >7.5 |
| Apply | <5 | 5.0-5.49 | 5.5-5.9 | 6-6.9 | >7.0 |
| Calculate | <5 | 5.0-5.9 | 6.0-6.49 | 6.5-7.49 | >7.5 |
| Create | <5 | 5.0-5.9 | 6.0-6.49 | 6.5-6.9 | >7.0 |
Table 4. Rubrics for Network Analysis Course
| CLO or Criteria | Unsatisfactory(1-2) | Satisfactory(3-5) | Good(6-7) | Very Good(8-9) | Excellent(10) |
| Identify | Only Identifies and describes few circuit elements | Identifies and describes all the circuit elements | Identifies and describes the elements and demonstrates a limited understanding of the problem and solution | Identifies and describes the elements and demonstrates complete understanding of the problem and partial solution | Identifies and describes the elements and demonstrates complete understanding of the problem and solution |
| Understand/Select | Does not understand the problem including nodes and meshes | Does understand the problem including nodes and meshes | Selects and expresses nodes or meshes | Selects and expresses nodes or meshes in terms of equations | Selects and expresses nodes or meshes in terms of equations with complete understanding |
| Apply(KVL/KCL) | Does not apply mathematical/scientific principles/ laws | Applies laws with errors | Applies the mathematical/scientific principles/ laws with some errors and calculation mistakes | Applies the correct mathematical/scientific principles/ laws and all calculations are precise and not always appropriate | Applies the correct mathematical/scientific principles/ laws and all calculations are precise and appropriate |
| Calculate/
Compare |
Fails to break down ideas/equations into simpler parts and analyze | Breaks down few ideas/equations into simpler parts | Breaks down ideas/equations into simpler parts, fails to analyze and compare/examine correctly | Breaks down ideas/equations into simpler parts analyzes and compares/examines sometimes correctly | Breaks down ideas/equations into simpler parts analyzes and compares/examines correctly |
| Summarize/Explain
/Design |
Does not acquire the knowledge in designing/developing electrical circuits | Acquires limited knowledge in only designing electrical circuits | Acquires limited knowledge in designing/developing electrical circuits | Acquires knowledge in only designing or developing electrical circuits | Acquires knowledge in designing and developing electrical circuits |
Table 5.Student Data set.
| Sl. No. | Identify | Understand/
Select |
Apply | Calculate/
Compare |
Create/
explain |
Classical Method of Averaging | Fuzzy method results | Neuro fuzzy method results |
| 1. | 4 | 4 | 2 | 2 | 2 | 2.8 | 2.36944 | 2.80000 |
| 2. | 4 | 4 | 3 | 3 | 4 | 3.6 | 2.36944 | 3.59999 |
| 3. | 5 | 5 | 4 | 4 | 4 | 4.4 | 2.86609 | 4.39999 |
| 4. | 5 | 5 | 3 | 4 | 3 | 4.2 | 2.86609 | 4.19997 |
| 5. | 5 | 5 | 4 | 3 | 4 | 4.2 | 2.86609 | 4.19998 |
| 6. | 7 | 7 | 5 | 4 | 4 | 5.6 | 4.64815 | 5.59999 |
| 7. | 7 | 7 | 7 | 5 | 3 | 5.8 | 6.67544 | 5.79997 |
| 8. | 8 | 8 | 5 | 6 | 2 | 5.8 | 6.62000 | 5.79999 |
| 9. | 8 | 7 | 8 | 3 | 4 | 6.0 | 7.11905 | 5.99998 |
| 10. | 6 | 7 | 6 | 6 | 6 | 6.2 | 7.11905 | 6.19995 |
| 11. | 7 | 7 | 6 | 6 | 7 | 6.6 | 7.11905 | 6.59992 |
| 12. | 7 | 7 | 7 | 7 | 7 | 7.0 | 7.11905 | 7.00001 |
| 13. | 7 | 8 | 7 | 8 | 7 | 7.4 | 7.11905 | 7.40000 |
| 14. | 8 | 7 | 8 | 7 | 7 | 7.4 | 7.11905 | 7.39999 |
| 15. | 10 | 10 | 6 | 6 | 6 | 7.6 | 8.50000 | 7.59994 |
| 16. | 10 | 10 | 6 | 6 | 5 | 7.4 | 8.64643 | 7.40000 |
| 17. | 8 | 9 | 8 | 9 | 6 | 8.0 | 8.64643 | 7.99995 |
| 18. | 8 | 8 | 8 | 8 | 8 | 8.0 | 7.26757 | 8.0000 |
| 19. | 8 | 9 | 9 | 7 | 7 | 8.0 | 8.64643 | 8.00007 |
| 20. | 10 | 9 | 10 | 7 | 8 | 8.0 | 8.50000 | 8.30003 |
| 21. | 9 | 9 | 9 | 7 | 7 | 8.2 | 8.64643 | 8.29991 |
| 22. | 10 | 10 | 7 | 7 | 7 | 8.2 | 8.50000 | 8.19828 |
| 23. | 10 | 10 | 9 | 6 | 6 | 8.2 | 8.64643 | 8.20001 |
| 24. | 9 | 9 | 9 | 8 | 7 | 8.4 | 8.64643 | 8.29991 |
| 25. | 10 | 10 | 10 | 7 | 7 | 8.8 | 8.64643 | 8.89706 |
| 26. | 10 | 10 | 10 | 6 | 6 | 8.4 | 8.64643 | 8.39996 |
| 27. | 10 | 9 | 10 | 7 | 7 | 8.6 | 8.64643 | 8.30003 |
| 28. | 9 | 10 | 9 | 7 | 8 | 9.0 | 8.50000 | 8.99999 |
| 29. | 10 | 9 | 9 | 8 | 9 | 9.0 | 8.64643 | 8.99997 |
| 30. | 10 | 10 | 10 | 7 | 8 | 9.0 | 8.50000 | 8.89706 |
| 31. | 10 | 10 | 9 | 10 | 7 | 9.2 | 8.64643 | 9.17178 |
| 32. | 10 | 9 | 9 | 10 | 8 | 9.2 | 8.64643 | 9.19997 |
| 33. | 10 | 10 | 8 | 9 | 10 | 9.4 | 9.63750 | 9.34977 |
| 34. | 10 | 10 | 10 | 8 | 10 | 9.6 | 8.64643 | 9.56348 |
| 35. | 10 | 10 | 10 | 9 | 10 | 9.8 | 9.63750 | 9.80072 |
| 36. | 10 | 10 | 9 | 10 | 9 | 9.6 | 9.63750 | 9.60004 |
| 37. | 10 | 10 | 9 | 9 | 10 | 9.6 | 9.63750 | 9.69827 |
| 38. | 10 | 10 | 9 | 9 | 9 | 9.4 | 9.63750 | 9.55849 |
| 39. | 10 | 10 | 10 | 10 | 9 | 9.8 | 9.63750 | 9.80007 |
| 40. | 10 | 10 | 9 | 10 | 9 | 9.6 | 9.63750 | 9.60004 |
| 41. | 10 | 10 | 10 | 10 | 10 | 10 | 9.63750 | 9.86492 |
- V. B. Deshmukh, S. R. Mangalwede and Rao, D. H. “Student performance evaluation model based on scoring rubric tool for network analysis subject using fuzzy logic.” In International Conference on Electrical, Electronics, Communication, Computer, and Optimization Techniques (ICEECCOT), 2017, pp. 1-5. IEEE, 2017.
- V. B. Deshmukh, S. R. Mangalwede and Rao, D. H. “Student performance evaluation model based on Bloom’s Taxonomy using fuzzy logic.” In International Conference on Electrical, Electronics, Communication, Computer, Mechanical and Computing (EECCMC). IEEE, 2018.
- Srikant Jadcherla, “ A short note on Revised Bloom’s taxonomy” Seer Academi and Global University 2014.
- Kai Meng Tay, Chwen Jen Chen and Kim Khoon Lee, “Application Of Fuzzy Inference System To Criterion-Referenced Assessment With A Case Study”, Proceedings of the 2nd International Conference of Teaching and Learning (ICTL 2009) INTI University College, Malaysia
- Bloom, B.S. (Ed.), Engelhart, M.D., Furst, E.J., Hill,W.H., & Krathwohl, D.R. (1956). “Taxonomy of educational objectives: The classification of educational goals”, Handbook 1: Cognitive domain.
- David R. Krathwohl. “Theory Into Practice”, Volume 41, Autumn 2002 The Ohio State University.
- Brenda Sugrue, October, 2002 “ Problems with Bloom’s Taxonomy”.
- Zadeh, L.A. 1965, “Fuzzy sets and systems”, In J. Fox, editor, System Theory. New York: Polytechnic Press, pp. 29-39.
- Biswas, “An application of fuzzy sets in students’ evaluation” 1995, Fuzzy sets and systems pp.187-194.
- Shyi-Ming Chen, Chia-Hoang Lee, “New methods for students’ evaluation using fuzzy sets”, Fuzzy sets and Systems 1999, pp.209-218.
- Singh, G., Bhatia, N., and Singh, S. “Fuzzy Logic Based Cricket Player Performance Evaluator”. IJCA Special Issue on “Artificial Intelligence Techniques – Novel Approaches & Practical Applications” 2011, pp. 11-16.
- Meenakshi N., Pankaj N., “Application of Fuzzy Logic for Evaluation of Academic Performance of Students of Computer Application Course”, IJRASET 2015. Volume 3 Issue X, October 2015 ISSN: 2321-9653 .
- Nidhi Arora, Jatinder Kumar R. Saini. “A Fuzzy Probabilistic Neural Network for Student’s Academic Performance Prediction”, International Journal of Innovative Research in Science, Engineering and Technology, 2013,Vol. 2. 4425-4432.
- Z.Jeremic,J.Jovonovic,D.Gasevic, “Sudent modeling and assessment in intelligent tutoring software paterns”, Expert systems with Applications, Elsevier, 2012 pp.210-212 .
- R. Sumitha , E.S. Vinothkumar, “Prediction of Students Outcome Using Data Mining Techniques”, International Journal of Scientific Engineering and Applied Sciences , Volume-2, Issue-6,June 2016 ISSN: 2395-3470.
- Omar Augusto Echegaray-Calderon, Dennis Barrios-Aranibar, “Optimal selection of factors using Genetic Algorithms and Neural Networks for the prediction of students’ academic performance”, 978-1-4673-8418-6/15/$31.00 ©2015 IEEE.
- Gurmit Kaur,Williumjit Singh, “ Prediction of Student Performance Using WEKA Tool”,An International Journal of Engineering Sciences,2016,Vol 17, ISSN:2330-0332(online).
- Deshpande, Minal, and Preeti R. Bajaj. “Short term traffic flow prediction based on neuro-fuzzy hybrid sytem.” In ICT in Business Industry & Government (ICTBIG), International Conference on, pp. 1-3. IEEE, 2016.
- Isa, K., Mohamad, S. and Tukiran, Z., 2008, August. Development of INPLANS: An Analysis on Students’ Performance using Neuro-Fuzzy. In Information Technology,ITSim 2008. International Symposium on (Vol. 3, pp. 1-7). IEEE. 2008
- Sevarac, Zoran. “Neuro fuzzy reasoner for student modeling.” In Advanced Learning Technologies, 2006. Sixth International Conference on, pp. 740-744. IEEE, 2006.
- Taylan, Osman, and Bahattin Karagözoğlu. “An adaptive neuro-fuzzy model for prediction of student’s academic performance.” Computers & Industrial Engineering 57, no. 3 (2009): 732-741
- Agaoglu, Mustafa. “Predicting instructor performance using data mining techniques in higher education.” IEEE Access 4 (2016): 2379-2387.
- Homsi, Masun Nabhan, Natasha Medina, Miguel Hernandez, Natacha Quintero, Gilberto Perpiñan, Andrea Quintana, and Philip Warrick. “Automatic heart sound recording classification using a nested set of ensemble algorithms.” In Computing in Cardiology Conference (CinC), 2016, pp. 817-820. IEEE, 2016.
- Kataria, Aman, and M. D. Singh. “A review of data classification using k-nearest neighbour algorithm.” International Journal of Emerging Technology and Advanced Engineering 3, no. 6 (2013): 354-360
- Do, Quang Hung, and Jeng-Fung Chen. “A neuro-fuzzy approach in the classification of students’ academic performance.” Computational intelligence and neuroscience2013 (2013): 6.
- Amra, Ihsan A. Abu, and Ashraf YA Maghari. “Students performance prediction using KNN and Naïve Bayesian.” In Information Technology (ICIT), 2017 8th International Conference on, pp. 909-913. IEEE, 2017.
- Troussas, Christos, Maria Virvou, and Spyridon Mesaretzidis. “Comparative analysis of algorithms for student characteristics classification using a methodological framework.” In Information, Intelligence, Systems and Applications (IISA), 2015 6th International Conference on, pp. 1-5. IEEE, 2015.
No related articles were found.