Contract Price Model Under Active Demand Response

Adv. Sci. Technol. Eng. Syst. J. 3(6), 324–328 (2018);
 DOI: 10.25046/aj030640
The power market in China is faced with problems such as the continuous widening of terminal load peak-valley difference and the imbalance between supply and demand. Under this background, this paper to establish the mathematical model of the contract price of active demand response. The first is to consider the load component of the user’s electricity consumption, whether it can be transferred or can be reduced. Then consider the market incentive conditions and purchase costs, whether the market electricity price difference is enough to attract users to transfer or reduce the load during peak hours. Those can guide users as much as possible Improve the peak consumption pattern, that is, reduce the peak load during peak hours, or use it during off-peak hours.
1. Introduction
Before the reform of the power market, there was an imbalance between supply and demand of the power industry. In addition, due to the lack of coordination and interaction, it is easy to cause power shortage in peak hours, power surplus or insufficient utilization rate of generating units in low periods [1]. And demand response (DR) refers that demand side management how to make full use of market regulation, maintaining the safety stability of the power system operation and the optimal allocation of energy demand side. Simply, demand response is a series of measures to bring the demand side of the power market into the process of feed-related incentive policies [2].
Then, there are some solidification problems in the current price methods in China, and the peak – valley ratio in China is unreasonable. Peak – valley ratio in our country only 2 ~ 3 times, but the peak – valley ratio abroad in the general case for 5 ~ 8 times, even 9 ~ 10 times [3-4]. Enough difference in electricity price can generate effective incentive level for users.
Thus, this paper has established the contract price model under active demand response, which in China are rare research issues about price model.
2. Contract Price Model Under Active Demand Response
2.1. Representation of Contract Price Model
The standpoint of active demand response is to emphasize the enthusiasm and initiative of users to participate in demand response. The key to achieving this goal is to motivate users in what ways and improve the users’ participation for DR’s enthusiasm and initiative, which is the core content of this paper.
Based on the above viewpoints, this paper establishes the contract price model under the active demand response. The user purchases electricity from the selling company unilaterally and signs the corresponding electricity contract with the selling company. The contract type is adopted in this paper:
- The price of 24 nodes per day within the trading period has been fixed;
- Regulate the upper limit and lower limit of quantity, and the adjustment method. Namely, if the power consumption of users exceeds the specified range, they will charge DR fees according to the content.
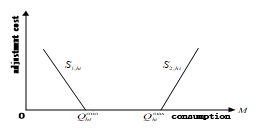 Figure1. Mathematical model of contract mechanism
2.2. Implementation Mechanism of Contract Price Model
In this contract trading mode, when the power consumption of users is not within the contract range, the users will face certain DR over-limit adjustment fees. Specific rules are shown in figure 1.
As shown in figure 1, and respectively represent the lower and upper limit of the contract quantity. and represents corresponding over-limit adjustment coefficient. is a close to the positive infinite natural number. Mark different situations of power consumption transactions with piece-wise functions.
- : The actual electricity consumption of the user is less than the electricity consumption stipulated in the contract price.
- :The actual power consumption of the user is within the scope specified in the contract price.
- : The actual power consumption of the user is greater than that of the contract price.
Therefore, in the specific implementation process of the contract price, the user’s electricity expenses during the trading period include: — the basic electricity fee charged according to the time-sharing electricity price, and — the additional DR fee charged after the user exceeds the power consumption scope.
The total electricity charge is :
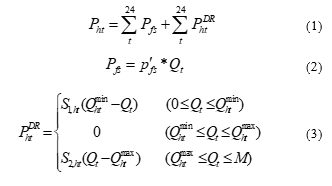 Where: is the time-sharing electricity price of the time period; is the power consumption of users; and are respectively the upper limit and lower limit of quantity of the contract quantity.
Therefore, in order to establish the contract price model under the active demand response, the threshold value ( , ) of the contract quantity must be determined. As well as the DR over-limit adjustment coefficient and , the following chapters will make further research and analysis.
3. Contract Price Model Design
3.1. Electricity Structure of Users
In general, users’ electric load can be divided into inelastic partial load, transferable load and reducible load [5-6]. The inelastic part load is the user’s unchangeable rigid power load. The transferable load refers to the power load that users can transfer from the peak period to the non-peak period. The reducible load is to point to the power load that the user can reduce directly in a certain period of time and won’t transfer to other periods of time consumption.
The mathematical relation can be described as:
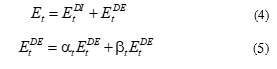 Where: is the total load of the user; and respectively represent the inelastic part and the elastic part of the electric load; is the transferable load factor and is the reducible load factor.
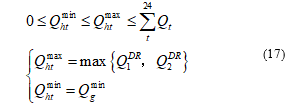
Under ideal condition, the upper limit quantity of DR contract price model should be inelastic load of peak period. The lower limit quantity shall be the minimum load in the low period, mainly to meet the basic electricity demand of users in the period.
 where: is the power consumption limit value adjusted by DR after considering the load characteristics. is the maximum power consumption during peak period of users before DR. is the minimum power consumption during low period of users before DR.
3.2. Incentive Conditions of Electricity Price
In the literature [7] pointed out that, according to the principle of consumer psychology, the user’s stimulation have a just noticeable difference (difference threshold). Within the scope of the user basically no reaction or very small, not sensitive period (dead zone); beyond this range user will respond, but the degree of response is related to the degree of stimulus, namely the normal response period (equivalent to the linear zone).The user reaction also has a saturation value for the stimulus, which is the reaction time limit (equivalent to the saturation area).
Usually to simplify the problem, the reaction is represented by a piece wise linear function.
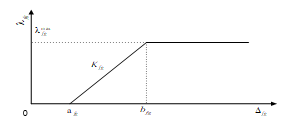 Figure 2. Price incentive and user response curve
The load transfer peak – valley rate of users is expressed by the formula:
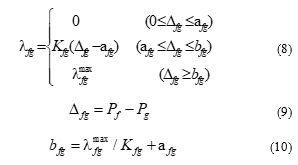 Where: and are respectively the price of electricity during peak and low periods. is the threshold value of the insensitive period (dead zone),which is the first unknown variable. Point( , )represents the ultimate point of load transfer between peak-valley, is the ultimate load transfer rate and is the threshold value of the reaction saturation area, which is the second unknown variable. is the slope of the user reaction linear region, which is the third unknown variable. The relationship between user response and price incentive can be obtained by fitting these three variables.
Thus, the DR load limit of peak – valley transfer can be further obtained:
![]() Where: is the limit value of consumption adjusted by DR incentive condition; is the maximum consumption during peak period of users before DR.
Where: is the limit value of consumption adjusted by DR incentive condition; is the maximum consumption during peak period of users before DR.
The initial value in the previous section is further modified in the following three cases:
Table 1 correction of
| situation | |||
| conditions | It satisfies the structure condition, but not the incentive condition | It satisfies the structure condition and the incentive condition | It satisfies the incentive condition, but not the structure condition |
| 或 |
The formula can be expressed as:
![]() The purpose of taking their maximum value is to transfer as many elastic loads as possible during the peak period of users under incentive conditions. The corresponding electricity price incentive:
The purpose of taking their maximum value is to transfer as many elastic loads as possible during the peak period of users under incentive conditions. The corresponding electricity price incentive:
![]() Where: is the peak – valley price difference.
Where: is the peak – valley price difference.
3.3. Market Electricity Purchase Costs
If it buys a lot of electricity directly from the power generation enterprise, the selling company gets a lower unit price. The company will also receive certain fund subsidies from state policies in response to the national call for “energy conservation and emission reduction”.
Therefore, the cost of electricity purchase in the selling company market can be expressed as:
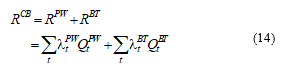 Where: and are respectively the electricity purchase fees from the power generation enterprise and subsidy fees. and respectively the unit price of electricity and the purchase quantity. and respectively refer to the subsidized unit price and subsidized power quantity.
4. Multi-objective Optimization Model
4.1. Multi-objective Function
From the perspective of selling company, promote the implementation of active demand response purpose is to seek to maximize the profit of the enterprise itself, in market competition to use price leverage and incentive policy of demand response. From the perspective of power users, change the original electricity consumption mode to get lower electricity costs. Therefore, the multi-objective function of the contract price model can be expressed as:
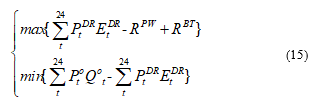 Where: and are the contract price and electricity consumption. is the total cost of purchasing power from the distribution network. is Subsidies for obtaining state policies. and are the electricity price before and after DR. and are the power consumption before and after DR. In order to facilitate calculation and comparison, it can be assumed that the total electricity consumption before and after the user participates in the demand response project is basically unchanged.
4.2. The Constraint
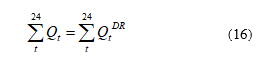
1.Total electricity consumption remains constant
In order to facilitate calculation and comparison, it can be assumed that the total electricity consumption before and after the user participates in the demand response project is basically unchanged:
 2.Contract threshold constraint
Energy threshold should be restricted within the contract price model, in line with the implementation of the contract price model under active demand response in actual situation.
 3.Price incentive constraints
As is known to 3.2, the implementation of the contract price model requires sufficient incentive level of electricity price. Therefore, the electricity price difference between peak and valley needs to meet the following constraints:
![]() 4.It is also necessary to ensure that after the implementation of the contract price model, the electricity charges of users will not increase, which is one of the principles of demand respond. And the DR revenue of the implementing company shall not be less than its market purchasing cost.
4.It is also necessary to ensure that after the implementation of the contract price model, the electricity charges of users will not increase, which is one of the principles of demand respond. And the DR revenue of the implementing company shall not be less than its market purchasing cost.
4.3. Model Solution Flow Chart
Using the method and model proposed in this paper, the multi-objective optimization function based on NSGA-II was solved by using MATLAB R2014a, and its model solution flow chart is as follows.
4.4. The Example Data
In this paper, the load data of 200 residents in a typical day in December 2006 were used as an example to simulate. Before the implementation of the contract price model, the unified price was 0.537 yuan/kw.h. The online price is 0.4 yuan/kw.h. The initial value =106.27*85%=90.32 kw.h, and =25.11 kw.h. At this point, the corresponding incentive condition electricity price difference is . In order to obtain better test results, the adjustment coefficient was determined to be =0.55, =5.50 after multiple tests.
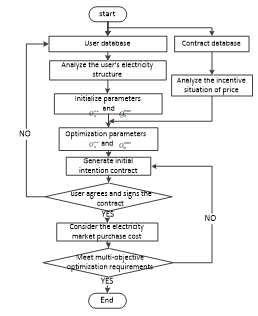 Figure 3 Flow chart of contract price model
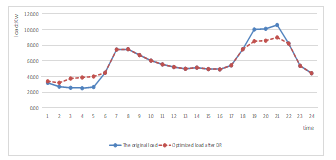 Figure 4 Variation curve of load after DR
5. Case Analysis
5.1. Multi-objective Optimization Results and Analysis
Figure 4 shows a load change after the DR. Obviously, after the contract price model, users’ peak-load is down and valley-load is increased. Thus it can be seen that the implementation of the contract price model does has good effect.
Table 2 changes in economic benefits of users
| object | state | fee | benefit |
| users | before DR | 743.92 | reduction of charges 97.11yuan |
| after DR | 646.81 |
Table 3 changes in economic benefits of company
| object | state | cost | fee | profits | benefit |
| company | before DR | 554.13 | 743.92 | 189.79 | Increase profits 33.59yuan |
| after DR | 423.43 | 646.81 | 223.38 |
From table 2 and table 3 can see users and selling company’s economic benefit is improved before DR. Users’ electric fee decrease after the DR model, which has a good incentive to users. After participating in DR, the profit of the selling company has increased, which satisfies the principle of long-term good and healthy operation of the selling company.
5.2. Taking into Account the Analysis of User Participation
This section continue to delve into in the contract price model after implementing, when users adopt different ways of load transfer, the power system load curve and the user itself and selling company caused by the comprehensive benefit of different effects.
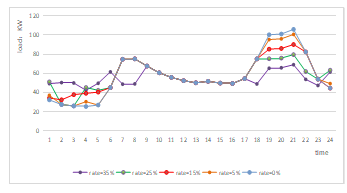 Figure 5 Load change curve under different consumption modes
By comparing the load curve under different power consumption modes in FIG.5, it is obvious that the higher the load transfer rate of the user is, the smoother the load level curve is, the more obvious the peak adjustment effect will be. It is also proved that the contract price model under the active demand response can achieve the effect of “cutting peak and filling valley” and optimizing energy allocation.
Further explore the economic benefits of users and selling company under different power consumption modes, as shown in table 4.8 and 4.9.
Table 4 Benefits of users under different modes
| Content | After the implementation of DR model | Original数据 | ||||
| Mode | One | Two | Three | Four | Five | empty |
| Rate | 35% | 25% | 15% | 5% | 0% | 0 |
| Charge
(元) |
567.41 | 624.63 | 656.99 | 672.05 | 680.04 | 743.91 |
| DR | 0 | 0 | 0 | 117.57 | 200.74 | empty |
| Total
charge费(元) |
567.41 | 624.63 | 656.99 | 789.63 | 880.78 | 743.91 |
| Benefit ) | 176.50 | 119.28 | 86.92 | -45.72 | -136.87 | 0 |
As can be seen from the above table, when users adopt higher load transfer rate, the benefits of power users become more obvious, and their electricity charges will be reduced. Therefore, it can be obtained that the contract price model can guide and assist users to participate in the actual implementation of DR. According to the contract content, the high fee of DR will urge users to abide by the contract, also can further develop users a sense of long-term good demand response.
Table 5 Benefits of company under different modes
| Content | After the implementation of DR model | Originalal | ||||
| Mode | One | Two | Three | Four | Five | empty |
| Rate | 35% | 25% | 15% | 5% | 10% | 0 |
| Cost | 423.43 | 423.43 | 423.43 | 423.43 | 423.43 | 554.13 |
| Total | 567.41 | 624.63 | 656.99 | 789.63 | 880.78 | 743.91 |
| Profit | 143.98 | 201.20 | 233.56 | 366.19 | 457.35 | 189.78 |
As can be seen from the above table, when users adopt different load transfer rates of electricity consumption, the selling company is in a profit state. When the electricity load transfer rate is lower, sell electricity profits will rise, this is because the default behavior of the users will lead to sell electricity market risk influence a company’s the normal operation of the enterprise, so the selling company charge users excess DR fees to compensate. Suggesting that the contract price model under active demand response can effectively guarantee a healthy and orderly operation of electricity market, and the further deepen the reform of the electricity market.
6. Conclusion
In this paper, a mathematical model of contract price under active response demand is established. On the basis of 24 node time TOU, this model introduces the mechanism of contract price, and uses the genetic algorithm NSGA-II to solve the multi-objective optimization. The simulation results show that:
- The model can effectively adjust the electricity consumption mode of users, promote the optimization of electric power market supply and demand balance, improve the stability of power grid operation, and the reasonable allocation of energy resources;
- The model can reflect the interests allocation problem between users and sell electricity company, and further develop the users’ initiative sense, embodies the superiority of the electricity market reform.
- Yoo T H, Ko W, Rhee C H, et al. The incentive announcement effect of demand response on market power mitigation in the electricity market[J]. Renewable & Sustainable Energy Reviews, 2017, 76: 545-554.
- Sharifi R, Anvari-Moghaddam A, Fathi S H, et al. Economic demand response model in liberalised electricity markets with respect to flexibility of consumers[J]. Iet Generation Transmission & Distribution, 2017, 11(17): 4291-4298.
- Reynders G. Quantifying the impact of building design on the potential of structural thermal storage for active demand response in residential buildings[J], 2015.
- Griful S R, Welling U, Jacobsen R H. Multi-modal Building Energy Management System for Residential Demand Response[C]. Digital System Design, 2016: 252-259.
- Saleh S A, Aldik A A, Castillo-Guerra E. Distributed energy storage unit-based active demand response for residential loads[C]. IEEE Industry Applications Society Meeting, 2017: 1-9.
- Mokryani G. Active distribution networks planning with integration of demand response[J]. Solar Energy, 2015, 122(3): 1362-1370.
- Yi D, Hui H, Lin Z, et al. Design of Business Model and Market Framework Oriented to Active Demand Response of Power Demand Side[J]. Automation of Electric Power Systems, 2017, 41(14): 2-9 and 189.
No related articles were found.