Perfect Molding Challenges and The Limitations “A Case Study”

Adv. Sci. Technol. Eng. Syst. J. 3(6), 489–495 (2018);
 DOI: 10.25046/aj030657
Driven by today’s market demand, semiconductor is pushing towards the zero-defect direction. The improvement demanded in semiconductor manufacturing is becoming increasingly challenging. In this paper, common molding defects comprise of voids, incomplete fills, and piping holes are studied systematically, focusing on three key areas: 1) Potential mold flow weakness; 2) Molding temperature stability; as well as 3) Defined pressure effects. The in-depth understanding of mold flow in the LF design is achieved via mold flow numerical tool. The numerical model prediction is verified by short shots and end-of-line auto vision data. Advance Process Control (APC) is adopted to measure the stability of key molding parameters like temperature, transfer profile and pressure. The mechanism of transferring the compound in relation to pressure is also analyzed and its effect to molding quality is also assessed. A methodical approach is utilized to understand the process and equipment built-in capabilities from two different equipment manufacturers. The real time transfer profile monitoring is activated for diagnosis of the system issue which leads to the finding of design error of a critical component. The dual temperature controller on one of the systems is analyzed to stabilize temperature for improved compound flow-viscosity control. The process limitations are assessed and transfer profiles are optimized to modify the melt front. By shifting the molding defects to non-critical location, the formation of void at the 500um diameter bonded wire loop peak will be avoided. The verification of potential negative impacts resulted from changes to improve voids, incomplete fills and piping holes are also included in this study. Up-front analysis by adopting numerical tool as a means of understanding the existing design and identifying improvement approach are proven to be useful.
1. Introduction
As today’s market requirement on semiconductor is moving towards the direction of zero defect. This demanding requirement has led to improvement not only at manufacturing process control but also at the mold design level without additional cost. The molding process is being chosen due to its high through put per cycle of production. Any imperfection of this process will lead to high quantity of rejections. Ishikawa diagram, Pareto analysis, and Taguchi design of experiments tools are often adopted to address the molding related issues [1,2] but lack of online feedback data to ensure sustainable quality becomes questionable. A computer-aided mold design tool with mold shot library built-in to reduce lead time and cost of mold tool design and fabrication has been formulated [3]. This developed methodology does not take into consideration the interaction effects of mold compound, process parameters, and design. In recent years, vacuum assisted molding has been accepted as a potential solution to reduce void formation [4,5]. However, this feature will incur higher running cost. The surge of introduction of Cu wire to replace Au wire due to high Au price [6] has leaded to new sets of bonding metallurgy and process issues. The effects are pre-mature failures and higher production yield losses [7-11]. Adversely, Cu wire brings along molding advantage of resistant to wire sweep due to its higher modulus. Thicker diameter wire can also provide high resistance to wire sweep during filling of mold cavities [12]. But, it can also influence the compound flow which can trap the air and cause mold voids.
In this paper, the potential pitfall of molding due to compound flow, temperature stability, pressure control, static DOE results, and interaction effects are being investigated using numerical tool, advance process data control, and in-depth understanding of equipment design.
2. Potential mold flow weakness
The design of package had played the main role that can influence the mold flow pattern [12]. Design of package included die size, wire size, number of wire, wire bonding pattern…etc. Figure 1 showed the DOE matrix for simulation, by using the Autodesk Moldflow.
 Figure 1. Experiment Matrix on different bonding Configuration
Simulation tool with time lapse comparison shows that, the completion of encapsulation process gives faster for bigger die size or higher wire density package as shown in figure 2.
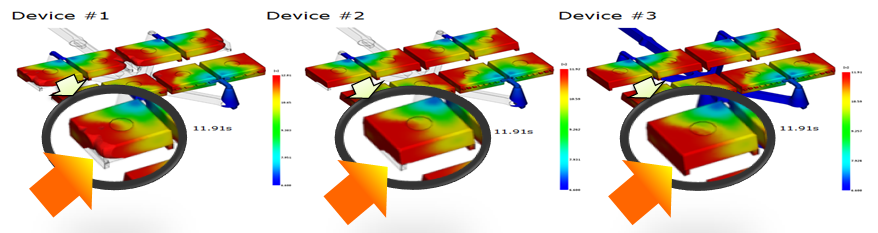 Figure 2. Experiment result on different bonding configuration
This had explained that with constant control on material (compound types), process method and process parameter (cavity temperature, transfer pressure, and transfer profile), package with bigger die size or higher wire density will experience the continuous transfer pressure from plunger after complete fill up the cavity [13]. Higher compactness on package occurs once the compound has been compressed with the set transfer pressure.
3. Temperature Control Sensitivity
Temperature control is one of dominant factors that can greatly affect molding quality [14]. Figure 3 showed the failure mode of mold void detected during production. The magnitude of mold void losses are significantly different by equipment types. “Equipment A” with pin gate concept shows much higher losses as compared to “Equipment F” which is standard mold concept as shown in Figure 4.
 Figure 3. Mold void defect mode
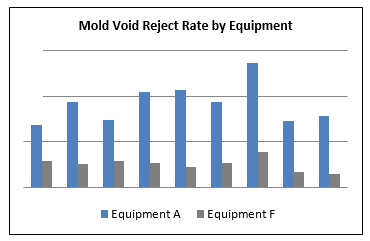 Figure 4. Mold void trend by equipment
Investigation shows that the temperature monitoring trend for “Equipment A” is instable compared to “Equipment F” as shown in Figure 5.
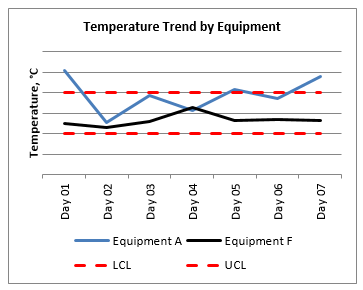 Figure 5. Temperature monitoring Trend
To understand the behavior of the temperature fluctuations, three areas of focus are defined:
1) Mold design;
2) Heater system; and
3) Robustness of Thermocouple wires.
Mold designs of these two types of equipment are assessed. Figure 6 showed the standard molding concept. The mold runner flow across the rows through the leadframe. The runner which is removed later at the degate station together with the cull. For the standard mold design, mold cavity temperature is stable and sustainable as top cavity and bottom cavity are same temperature setting on solid piece of metal.
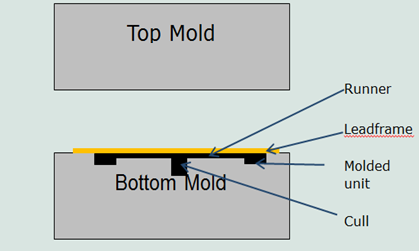 Figure 6. Standard mold design
Figure 7 shows pin gate molding concept. The mold runner flow through a middle plate, middle plate is a moving part whereby it will de-cull the runner and cull during mold open. Due to the middle plate which is moving part and no heater element attached on it, the temperature is always unstable with +/- 5 degree fluctuation caused by heat losses during mold process cycle.
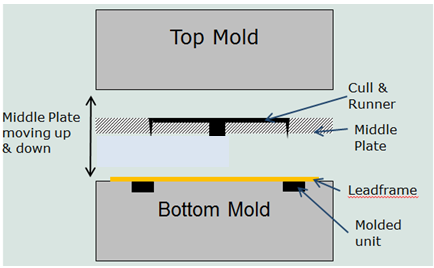 Figure 7. Pin gate mold design
Further investigation found that two individual heater controls are designed into this molding system one on mold housing and the other on mold chase. This leads to complexity of temperature synchronization of two controls: heating and cooling ones [16]. Figure 8 showed the schematic illustration of the heating and control of pin gate molding system. The heater locations and thermocouples and their number can cause the response time to delay for the heaters to turn on or off. All these factors have caused the fluctuation of the temperature of equipment A to wider ranger. Within a molding system, there are four presses. Figure 9 showed temperature variations within a press and between press-to-press.
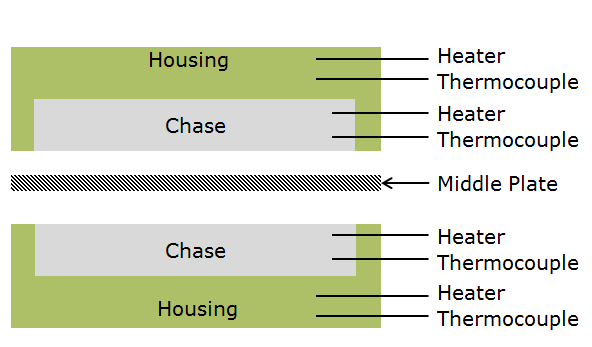 Figure 8. Two individual heaters in one mold press
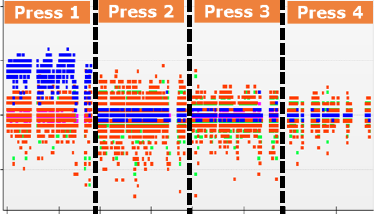 Figure 9. Recorded online temperature variations for four molding presses
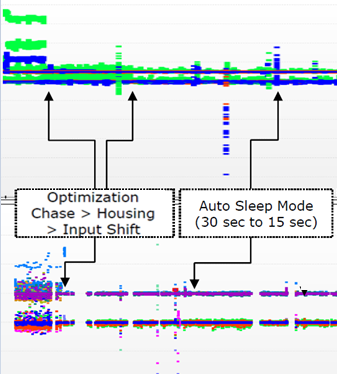 Figure 10. Mold temperature monitoring results after actions taken
After empirical data collection, analysis of the data, and understanding the molding hardware, two key actions are formulated to overcome the design limitations: a) Single housing heating by disable chase heater to eliminate the temperature control synchronization, and b) Minimizing the waiting time for auto sleep mode to minimize the heat losses at middle plate and cavity. With the two key actions taken, mold temperature has been stabilized as shown in Figure 10.
Figure 10 also showed that sporadically mold temperature can fluctuate on a wide range. Thermocouple wire connector design is the third weakness observed, which can cause unstable temperature. The existing design with thin thermocouple wire attached to TC connector which is easy to spoil if there are any mishandling during install. An enhanced connector design which is more solid and user friendly being introduced into the new molding system. The robust and user friendly connector will not be only replaced by the existing one used in the production floor, but new machine will be introduced with this new connector.
4. Transfer Pressure
In addition to molding temperature, transfer pressure is another key controllable process parameter which can greatly influence the molding quality. In this paper, molding equipment F is used to study the effect of transfer pressure due to its equipment with online real-time pressure monitoring. In this equipment platform, transfer pressure in is monitored under a system called Final Transfer Pressure Control (FTPC). It measures the applied pressure and stops the transfer movement when the required transfer pressure has been reached.
4.1. Process Monitoring Fundamentals
Figure 11 shows a transfer pressure graph in which the transfer position is against the transfer pressure.
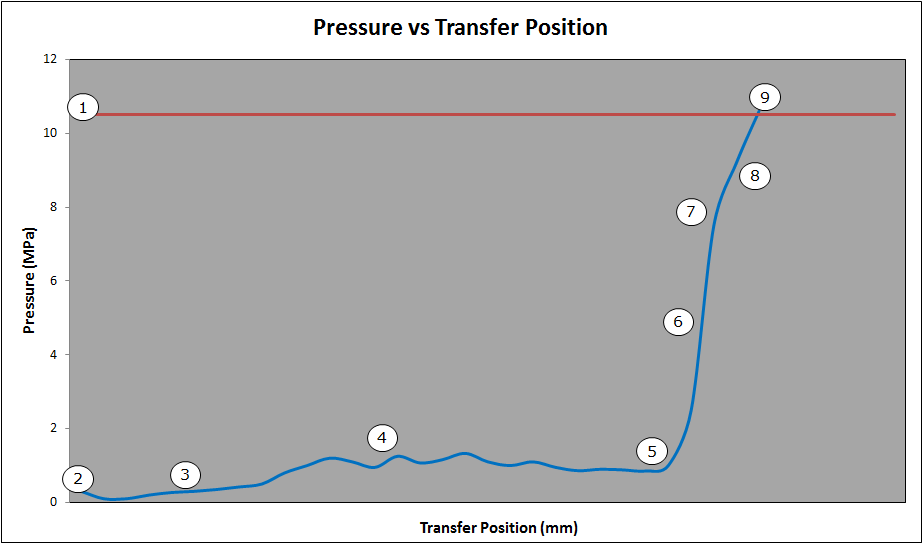 Figure 11. Transfer pressure graph
A description of the event taking place at each number in figure 11 is given below:
- Red line is transfer pressure set point (i.e. 10.5 MPa).
- After compound pellets are loaded into the press and they were heat up while the mold closes, the transfer starts moving from its start position which is called pellet load position.
- There will be a light pressure built up because of the resistance of the plungers in the sleeves and partly melted pellet is pushed up in the sleeve.
- The compound melts and the transfer moves further up. During the transfer movement, the pressure slightly increases because fluid compound goes through the runners and the narrow gates, which are expected having some resistance.
- During this transfer process stage, all compound is melted and the pressure built up is caused by the resistance of the compound in the runners, at the gate and in the package.
- Now, the cavities are completely filled, the air is pushed out through the air vents and the pressure starts to build up in the package. The position from which the line starts rising rapidly equals the cull height.
- During the fast increase of the pressure, the plunger springs are compressed beyond the spring preload pressure.
- From this point, the transfer starts compressing the spring.
- At the final stage, the plunger springs are compressed. The slope of the line depends on the type of spring used in the mold. The transfer move stops when final transfer pressure (required packing pressure) reaches the set point, mold process is completed.
4.2. Transfer Pressure Mechanical System
The transfer pressure mechanical system is dictated by two critical components: 1) Plunger beam and 2) plungers as shown in Figure 12.
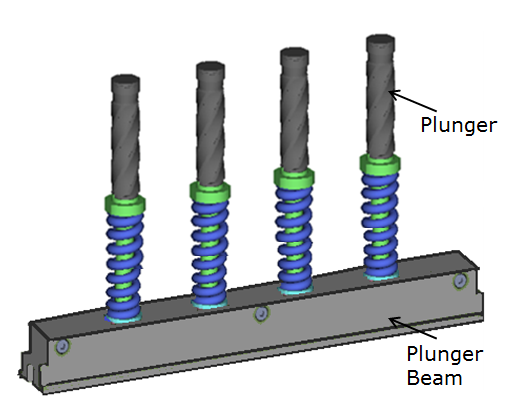 Figure 12. Plunger and plunger beam for molding compound transfer
4.3. Plunger Beam and Plunger
Figure 13 showed the cross section view of an assembled plunger system. The plungers are fitted under a pre-defined tension by means of the compression spring (C). Different spring diameters (recognizable by color type) are used, depending on the required spring force and transfer pressure. The higher part of the plunger (F) is screwed to the lower plunger part (shoulder pin (E) and spring (C)) by means of a long socket screw (D).
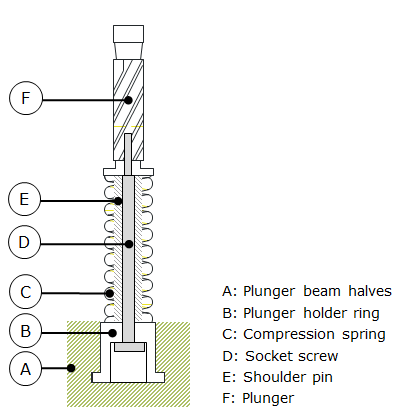 Figure 13. Cross sectional view of plunger beam and plunger
4.4. Transfer movement
The transfer movement consists of four critical pre-set positions. The first position is the starting position which is in compound pellet load position. The second position is the pellet crush position. At this position, the plunger beam waits until the pellet preheat time has finished. The third position is the “Cull Height” (CH) position. Generally, at this point, the plunger cannot move up higher and the cavities are completely filled. But, the transfer movement is not yet applying pressure to epoxy. The end position is the plunger move up to the CH position but the plungers themselves cannot go higher because the cull is blocking this. However, the transfer beam upward movement will cause the cull to compress further by the flexible spring. Figure 14 showed the four critical positions of plunger beam and plunger positions.
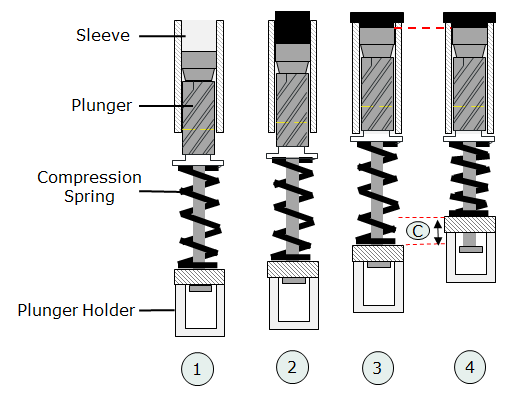 Figure 14. Four critical plunger beam and plunger positions
Cull height setting is one of the crucial parameters that can influence the compactness of the package. However, when the cull height parameter is set lower than the actual cull height, this may deform the product with deform dammar. Therefore, the set end position must be always lower than the cull height. If not, the maximum transfer pressure cannot be attained.
4.5. Transfer Pressure Effects
Transfer end pressure can go higher through the setting of higher plunger position. Different spring type used can deliver different transfer end pressures which purely depend on the cavity designs. When the transfer pressure is too low, this may cause an incomplete fill and air in the package. When the pressure is too high, this may cause die damage or compound leakage. For this paper a case study of plunger beam movement effect on final packing is examined. Figure 15 showed two molding defects due to insufficient transfer pressure.
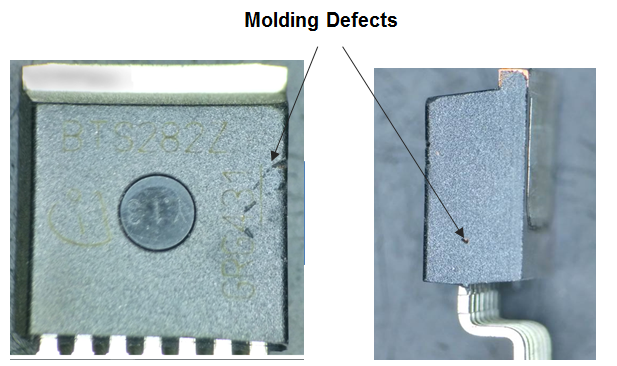 Figure 15. Two modes of molding defect caused by insufficient transfer pressure
The transfer movements and settings in section 4.4 are used as the base for the investigation. The frequent FTPC error triggering at the end filling stage has led to the finding; at the end position the plunger beam upward movement has obstruction. This incomplete final movement had prevented the final compactness of the compound to happen. The root cause of this incomplete plunger beam movement is resulted from fabrication error of plunger holder as shown in Figure 16 below.
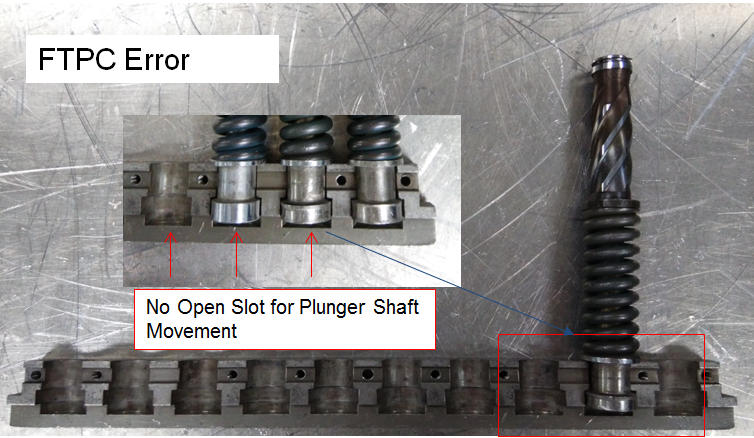 Figure 16. Plunger beam with un-through slot for plunger shaft movement
A new plunger holder with through slot was fabricated and installed into the molding machine as in Figure 17.
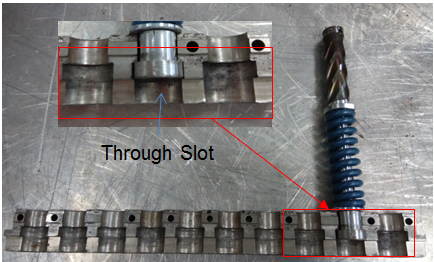 Figure 17. A plunger holder beam with through slot to facilitate free plunger movement
 Figure 18. Improvement of molding defects after the corrective action implementation
4.6. Transfer Pressure and Transfer Time Correlation
The effect of transfer time and transfer pressure on short mold and void formation during encapsulation is evaluated in this study. Both short mold and void formation during transfer molding process will affect the long term reliability [17-19] of the package being molded. The tool being used to visually quantity the defect of short mold and void formation is low power scope. Others primary molding process parameters such as top and bottom mold chase temperature, mold compound transfer time are fixed with nominal setting during the evaluation. To minimize the influence of the cleanliness of mold tool on the results, mold die cleaning and conditioning were performed prior to the test. The cleanliness is extended to all the air ventilation area, runner and pot area as well.
The transfer time is defined according to the recommended mold temperature from the melting viscosity curve for compound material A as shown in Figure19. Output response on short molding and void percentage rate are computed and samples are inspected under low power scope by one dedicated inspector. Table 1 and 2 show the Design of Experiments matrix for transfer pressure and transfer time respectively.
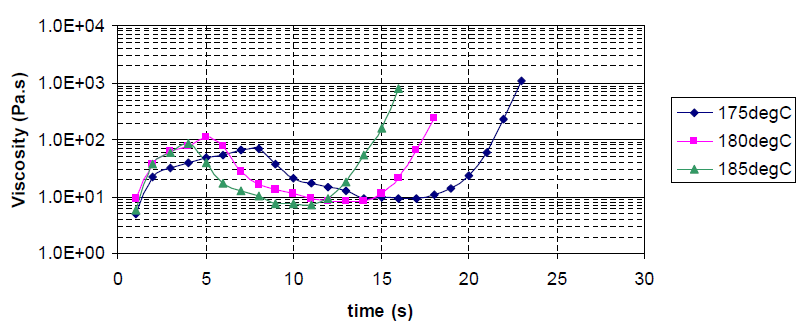 Figure 19. Melting Viscosity chart for compound material A
Table 1. Experiment Matrix of transfer Pressure
Table 2. Experiment Matrix of transfer time
High density manufacturing platform is utilized to carry the evaluation. DOE matrix 1 and 2 from Figure 21 show the short molding and void defect inspection results from high density lead frame. The DOE samples are molded with 2 different transfer pressure, low pressure and high pressure. The remaining others primary parameters are all set at nominal values. There is no significant improvement being observed in term of failure rate when transfer pressure increased from low to high with the fixed transfer time [16]. This confirmed that the air trap in the cavity is not due to insufficient compactness during the material transfer to cavity. To gain further understanding, short-shot analysis and mold flow simulation are carried out to further validate the void formation mechanisms and the final air trapped location.
Figure 20 shows the result of shot-shot simulation. It shows the similar behaviour where the air is trapped at end mold flow position and leads to short mold or void formation, which is matching with the current molding defect and location.
DOE matrix 3, 4 and 5 from Figure 21 show the short molding and void inspection result. No significant difference was observed from the matrix 3,4 and 5. According to the viscosity curve, control parameter is the optimum point to achieve the most “liquefy” mold compound flow during the transfer of compound to cavity. The optimum processing parameters, transfer mold is locked at existing parameter for further DOE.
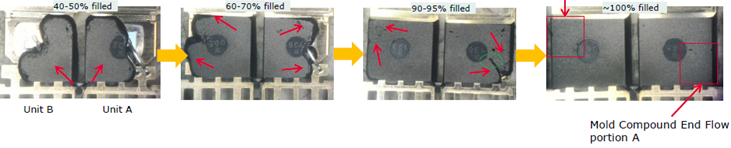 Figure 20. Short-Shot simulation result
 Figure 21. DOE Matrix result for transfer pressure and transfer time
5. Conclusion
In order to improve the molding processing and reduce the rejection by more than 10%, the following three areas have to be focused: 1) enable only single temperature control instead of dual temperature control to stabilize the temperature. 2) To overcome the challenge of molding process, consideration of internal product structure‘s design such as wire size, die size, number of wires, and wire orientation which can cause unwanted mold defects. In addition, up-front analysis by adopting numerical tool to understand the existing design and improvement options are proven to be useful. 3) Fix the fabrication error of the plunger holder to overcome the incomplete plunger beam movement which resulted insufficient transfer pressure. On top of that, online process monitoring such as Advance Process Control (APC) is not only useful to control the process but also a good tool to diagnose the design weakness.
- K.A.Z. Abidin, K.C. Lee, I. Ibrahim and A. Zianudin, “ Problem Analysis at A Semiconductor Company: A Case Study on IC Packages”, Journal of Applied Sciences, 11 (2011) 1937-1944.
- J. Antony, “Taguchi or classical design of experiments: A Perspective from practitioner” Sensor Rev., 26 (2006) 227-230
- M.R. Alam, M.A. Amin, and M.A. Karim, “A Computer-aided Mold Design for Transfer Molding Process in Semiconductor Packaging Industry” ScienceDirect Procedia Manufacturing 21 (2018) 733-740
- T.S. Lundstrom and B.R. Gebart. “Influence from process parameters on void formation in resin transfer molding’, Polymer Composite Polymer Composites, 15 (1994) 25-33
- V.R. Kedari, B.I. Farah, K.-T. Hsiao, “Effects of vacuum pressure, inlet pressure, and mold temperature on the void content, volume fraction of polyester/e-glass fiber composites manufactured with VARTM process”, Journal of Composite Materials, 45 (2011) , 26, 2011 2727-2742
- T.J.S. Anand, K.Y. Chua, Y.S. Leong, W.K. Lim and M.T. Hng, “Microstructural and Mechanical analysis of Cu and Au interconnect on various bond pads” Current Applied Physics 13 (2013) 1674 – 1683.
- M.S. Patel, C.P. McCluskey, and M. Pecht, “Effective decapsulation of copper wire-bonded microelectronic devices for reliability assessment, Microelectronics Reliability 84 (2018) 197-207.
- M.S. Krishnanramaswami, G. McCluskey, M. Pecht, “Failure mechanisms in encapsulated copper wire-bonded devices”, IEEE 23rd International Symposium on the Physical and Failure Analysis of Integrated Circuits (IPFA), 2016.
- V.B. Willems, “Early fatigue failures in copper wire bonds inside packages with low CTE green mold compounds”, 2012 4th Electronic System Integration Technology Conference, 2012, http://dx.doi.org/10.1109/estc.2012. 6542110.
- D. Andrews, L. Hill, A. Collins, K.I. Hoo and S. Hunter, “ Copper ball bond shear test for two pad aluminum thicknesses, 2014 IEEE 16th Electronics Packaging Technology Conference (EPTC), 2014, http://dx.doi.org/10.1109/eptc.2014.7028415.
- S. Manoharan, S. Hunter and P. McCluskey, “Bond pad effects on the shear strength of copper wire bonds, Electronics Packaging Technology Conference (EPTC), 2017 IEEE 19th, IEEE, 2017, December, pp. 1–6.
- L.T. Tan, C.H. Lee, Y.Y. Teo and B.H. Lim, “Perfect Molding Challenges and The Limitations”, IEEE 19th Electronics Packaging Technology Conference (EPTC).
- H. Ardebili and M. Pecht, “Encapsulation Technologies for Electronic Applications”, William Andrew, Oxford 2009.
- E. Ridengaoqier, R. Fujiki, S. Hatanaka and N. Mishima, “Study on estimation of void ratio of porous concrete using ultrasonic wave velocity”, Journal of Structural and Construction Engineering, 83 (2018), 943-951.
- G.M.C. Magalhães, G. Lorenzini, M.G. Nardi, S.C. Amico, L.A. Isoldi, L.A.O. Rocha, J.A. Souza and E.D. Dos Santos, “Geometrical evaluation of a resin infusion process by means of constructal design” International Journal of Heat and Technology, 34 (2016) S101-S108.
- M. Kubouchi, H. Sembokuya, S. Yamamoto, K. Arai and H. Tsuda, “Decomposition of amine cured epoxy resin by nitric acid for recycling”, Journal of Society in Materials Science, Japan. 49 (2000) 488–493.
- N.M. Li, D. Das and M. Pecht, “Shelf life evaluation method for electronic and other components using a physics-of-failure (Pof) approach”, Machinery Failure Prevention Technology (MFPT) Conference, MFPT, 2017.
- N.M. Li and D. Das, “Critical review of US Military environmental stress screening (ESS) handbook”, Accelerated Stress Testing & Reliability Conference (ASTR), IEEE 2016, 1-10.
- F.P. McCluskey, N.M. Li and E. Mengotti, “Eliminating infant mortality in metallized film capacitors by defect detection”, Microelectronics Reliability 54 (2014) 1818–1822.