Spectral Grid Impedance Identification on the Low-, Medium- and High-Voltage Level – System Design, Realization and Measurement Results of Grid Impedance Measurement Devices

Adv. Sci. Technol. Eng. Syst. J. 4(1), 8–16 (2019);
 DOI: 10.25046/aj040102
The frequency dependent grid impedance at the terminals of an electrical supply grid is an essential parameter for power quality and grid feedback analysis. In this contribution the identification of the grid impedance is achieved using spectral excitation currents at the corresponding grid connection point, which generate measureable changes in the grid voltage spectra. Different measurement systems based on this method have been successfully realized for the low- and medium-voltage level. A measurement system for the high-voltage level is currently being realized. The application of the measurement systems are facing quite different external framework conditions leading to specific system designs for each measurement device. The spectral grid impedance identification on these voltage levels is done through fast switching of an ohmic load with power electronic. The requirements and setup of the grid impedance measurement systems are outlined and measurement results on the low- and medium-voltage level are presented and discussed. The systems can be used to evaluate grid connection points and to verify other active or passive grid impedance identification methods on different voltage levels.
1. Introduction
This paper is an extension of work originally presented in 2017 at the IEEE Power & Energy Society General Meeting [1]. The extensions consider essential aspects on the relationships of the grid impedance and the influence of harmonics on the grid voltages, especially in relation with renewable energy systems. Additionally the measurement results and possible benefits are described in more detail. The harmonic requirements are discussed in relation to the experimental results. Further on a new possible measurement procedure for an improved grid integration of renewable energy systems is presented. Finally the connection aspects and structure of the devices are explained in more detail.
The share of decentralized renewable energy systems will continue to grow in the upcoming years. Their share in the total electricity generation in Germany is targeted to rise up to 80 % by 2050. This changes the power flows in the grid, which have an effect on the grid voltage levels, the loads of the grid equipment and the protection technology. Therefore, a strategic grid reinforcement, grid optimization and grid expansion is required to master the future challenges.
The electrical characteristics of a point of common coupling (PCC) are determined by the grid voltage and the internal impedance at the PCC. At the fundamental frequency these parameters define the short circuit power and hence the capacity of the PCC. To evaluate harmonics above the fundamental frequency of power systems connected to the PCC, the spectral characteristic of both parameters are needed. In most cases the grid voltages can be easily measured and spectrally analyzed. The grid impedance at the fundamental frequency can be approximately obtained from grid simulation programs. It is typically not possible to determine the grid impedance above the fundamental frequency through simulation because this requires detailed spectral models of the power system utilities. The spectral models however are often not available or just valid for low frequencies. Therefore an exact determination of the spectral grid impedance over a wide spectral range can only be accomplished by measurement.
The frequency-dependent grid impedance can be used to evaluate network perturbations (harmonics, flicker) [2]. At the Helmut Schmidt University, measurement devices for the determination of the time- and frequency-dependent grid impedances at the low- , medium- and high-voltage level have been developed [3], [4], [5].
2. Relevance and interrelation of the grid impedance
The grid impedance is a complex variable that describes the resulting voltage uplift or voltage drop when power is fed into the grid or power is taken from the grid. It is composed of the proportions of the individual impedances of the used grid equipment. In the following, the 50 Hz component of the grid impedance of a grid connection point / point of common coupling (PCC) in the medium-voltage grid is described. It essentially consists of the higher-level 110 kV grid, the 110/10 kV transformer and the medium voltage cable, shown in Fig. 1. For this purpose, one ohmic and one inductive component are used.
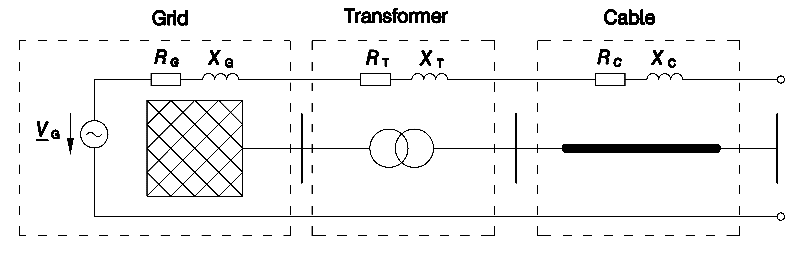 Figure 1. Schematic of grid equipment
2.1. Superordinate 110-kV-Grid
2.2. Medium-voltage cable
The impedance of the medium-voltage cable depends on′ the corresponding length′ as well as the resistance coating C and reactance coating C.
2.3. Grid impedance at the point of common-coupling
PCCk,PCC = PCC2
Fig. 2 shows the grid impedance as well as the short circuit apparent power of a PCC as a function of increasingSk,PCCcable lengthZPCC.
It shows the indirect proportionality between and . This relationship plays the decisive role in the calculation of the permissible voltage change by connection of loads or generation units.
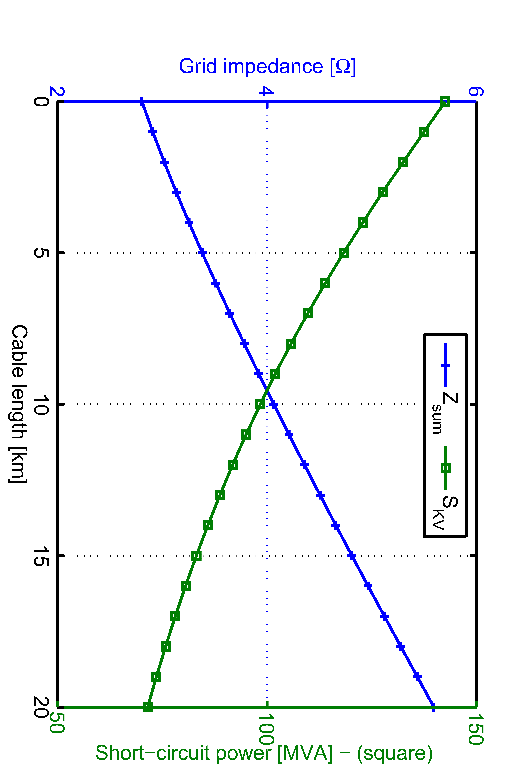 Figure 2. Characteristic of grid impedace (solid) and short-circuit power (dashed)
2.4. Voltage change
According to the technical guideline for the connection of power feed-in and over- / under-excited operation respectively). The voltage change is a functiona ratio smaller than 50, a closer look is necessary, since the power generation unit has more influence on the grid voltages. For this,
Table 2: Selected limitation values for certain harmonics at low-, medium- and
Solving this relationship to the maximum apparent power of the generation unit that can be operated at the corresponding PCC, and using thePCC ohmic and inductive components of the grid
impedance , yields:
a,max = | ∙ cos(Δ a) ∙− PCC2 ∙ sin( )|
PCC a PCC a
cosItcana be= observed1 that for a power feed-in with a power factor of , only the resistive component is relevant for the voltage uplift.
3. Grid feedback
There are a number of standards for ensuring the proper operation of electrical power generation units and electrical loads connected to the power grid. At the PCC, the grid voltages must meet certain criteria that are understood by the grid quality. Failures and outages of the energy supply grid (long and short-term outages) fall under the security of supply. In reference with the grid impedance, in particular the voltage form and the influence of generating units and consumers on the grid voltages are of interest. The grid voltages should be ideally sinusoidal and have a constant frequency (50 or 60 Hz). Grid perturbations due to harmonics (also intermediate and subharmonic), voltage fluctuations and unbalances as well as transients (also voltage dips and overvoltages) reduce the grid quality. Grid perturbations result from non-linear equipment and switching operations. Especially the increasing proportion of power electronics in many devices and also renewable energy systems can lower the power quality by taking or feeding in non-ideal sinusoidal currents. The permitted limits for the harmonic currents and also for the harmonic voltages must not be exceeded [8]. Harmonics can have several bad effects in the electrical energy supply network:
- Reduction of efficiency
- Destruction of insulation
- Reduction of lifetime (early failure of insulation)
- Thermal overload of equipment
- Malfunction of protection and measuring devices
- Attenuation and distortion of signals (eg frequency remote control, grid communication…)
As the number of power electronics within consumers and power generation units connected to the electrical energy supply grid increases, the effects increase. With measured frequency characteristics of the grid impedances, the grid perturbations can be better and more objectively evaluated. Resonances in the frequency characteristic of the grid impedances can be detected at an early stage.
In general, high short circuit power and hence a small grid impedance value results in lower voltage drops when connecting loads, and also in a low voltage uplift when connecting power generation units as well as in reduced grid perturbations.
Table 4 summarizes limits for the allowable harmonic voltages at the low, medium and high voltage levels. The harmonic limits of standard EN50160 describe the minimum requirements for PCCs. They are therefore higher than the values of the technical guidelines for power generation units, including renewable energy systems ([7], [9]). Deviating from these limitation values can be tolerated by grid operators with higher values in subareas of their electrical grids in coordination with customers if a negative influence on consumers and power generation plants can be avoided.
| Vν/Vn at low- | Vν/Vn at | Vν/Vn at | Vν/Vn at high- | ||
| Order | and medium- | medium- | high-voltage | ||
| voltage level | |||||
| ν | voltage level | voltage level | level (acc. to | ||
| (acc. to [9]) | |||||
| (acc. to [8]) | (acc. to [7]) | [8]) | |||
| 5 | 6.0 % | 0.5 % | 5.0 % | 0.25 % | |
| 7 | 5.0 % | 1 % | 4.0 % | 0.5 % | |
| 11 | 3.5 % | 1 % | 3.0 % | 0.5 % | |
| 13 | 3.0 % | 0.85 % | 2.5 % | 0.4 % | |
| 17 | 2.0 % | 0.65 % | tba. | 0.3 % | |
| 19 | 1.5 % | 0.6 % | tba. | 0.25 % | |
| 23 | 1.5 % | 0.5 % | tba. | 0.2 % | |
| 25 | 1.5 % | 0.4 % | tba. | 0.15 % | |
When connecting high power wind farms via HVDC systems to the high-voltage level (especially in the offshore area), the harmonic emissions of the entire system must be considered up to a frequency of 10 kHz [9]. In addition, the THD (Total Harmonic Distortion) is used to assess the power and voltage quality of renewable energy systems:
At the medium voltage level, the V must be below 8 % [7]V. At the high voltage level, no limit value is specified for the in [9] and [8]. Furthermore, limitation values for the short- and long-term flicker must be complied, which were especially relevant for older directly coupled wind energy systems and have higher values than current systems using inverters.
The basis of the limitation values for harmonic voltages and currents is the assumption that the grid impedance consists of an ohmic and an inductive part, as described in section 2.1. However, capacitive elements in the grid equipment as well as non-linear behavior of consumers and power generation units with power electronics lead to a strong deviation from this assumption and to the occurrence of resonance frequencies. At these resonant points the limitation values can be exceeded due to power feed-in of renewable energy systems. Even instabilities can occur. In this case, the power must be reduced and possibly additional filters must be installed.
The design of grid-side and internal filters can be improved with knowledge of the grid impedance [10]. The internal control of the voltage and current regulators used in the inverters can also be adapted to the network impedance to avoid possible current fluctuations and instability problems [11].
4. Basic Principle of applied Grid Impedance Measurement Method
Several methods have been introduced to measure the grid impedance. They can be categorized into invasive and non-invasive techniques. Non-invasive techniques assess natural power flow variations caused by fluctuating loads or generators with statistical methods. An example of a grid impedance estimation with a statistical methods can be found in [12]. However, in most cases a high precision over a wide frequency range cannot be achieve with these methods.
Commonly used invasive techniques inject harmonic or interharmonic current signals to a PCC. In [13] an inverter system is used to measure the grid impedance on the low-voltage level by sweeping the frequency of the injected current signals in the range from 100 Hz to 10 kHz. Inverter based grid impedance measurement methods are applied almost exclusively on the low-voltage level. To measure the grid impedance at medium- or high-voltage level with this method, the inverter systems need to have very high output power. Further on, the inverter system is coupled with a special transformer to the grid. Transformers with high rated power that offer the necessary broad frequency range are not available on the market and have to be specially designed, which makes this method complex and cost-intensive. On the medium-and high-voltage level active switching of transformers [14] or capacitor banks [15] have been commonly used to identify the grid impedance with good results. The switching has been done by circuit breakers with a number of maximum cycles of operations, which strongly reduces the possible repetition rate. Further on, the duration of the generated excitation pulse signals are very short and the pulse amplitude depends on the switching moment, which cannot be controlled accurately with the circuit breakers. Therefore the spectral excitation of these current pulses is only sufficient at certain frequencies and cannot be varied in practice. These drawbacks can be overcome by generating pulsed current signals with power electronic switches and ohmic loads.
As shown in Fig. 3 a power electronic switch is used to pulse an ohmic load in order to excite the grid. The advantage of this method compared to switching loads with circuit breakers lies in the flexibility of the pulse patterns that can be applied to the power electronic switch. The voltages and currents of the first interval where the switch is open (subscript 1) and the second interval where the load is pulsed by the switch (subscript 2) are transformed into the frequency domain with FFT-algorithms. In the frequency
 Figure 3. Grid impedance measurement with pulsed ohmic load
Strategies to excite the grid with pulsed current sequences can be found in [16], [17] and [18]. With periodic pulse signals the grid impedance can be precisely measured at specific frequencies.
Spectral ranges of the grid impedance may be measured with a frequency sweep of periodic pulse signals. Depending on the spectral range and number of steps this method can be very time consuming. Another option is to switch the load with random pulse patterns. The resulting current signals have broad frequency spectra but with comparatively low amplitudes. In order to obtain good measurement results several measurement iterations in succession using random signals can be used.
On the low-voltage level with a four-wire system the pulsed current signals can be generated sequentially between two conductor lines or between a conductor line and the neutral line to measure the corresponding loop impedance parameters. Further on, equivalent line impedance parameters can be calculated out of the loop impedance parameters [18]. In three -wire systems as on the medium- and high-voltage level the loop and equivalent line impedance parameters can be measured in the same way. It is also possible to determine coupling impedance parameters between the lines with this method [4].
5. System Design and External Technical Parameters for the Realization of the Measurement Devices
The most important relevant technical parameters for the realization of the grid impedance measurement devices are given by the structure of the grids:
- Nominal voltage
- Grid structure
- Typical short-circuit powers
These parameters have to be compromised with the application and the definition of the subsequent measurement results:
- Frequency range of interest (only 50 Hz or spectral range)
- Repetition rate of measurements (in order to evaluate time changes)
- Measurement accuracy
- Framework conditions:
- Price
- Transportation
- Grid connection
Technical Requirements
The power electronic switch is directly connected to the terminals of the different voltage systems. At the low-voltage level (0.4 kV) the effort is relatively low since there are single power electronic components e.g. Mosfets or IGBTs that fully offer the necessary blocking voltage. On the medium-voltage level (20 kV) a series connection of multiple power electronic components is required in order to achieve the high blocking voltages. At the high-voltage level (110 kV) there is an enormous effort. An extremely high demand of power electronic devices is necessary.
Another aspect concerns the spacing between parts within the measurement devices which are subjected to the grid voltages and other parts that are connected to ground, refer to Table III. At the low-voltage level a compact design on a printed circuit board is possible. At the medium- and high-voltage level this is not possible
Table 3: Overview of selected permitted isolation distances in air according to
| Highest voltage | Minimum distances (line to | |
| of facility | earth and line to line) | |
| 90 mm (indoor) | ||
| 12 kV | 120 mm (indoor) | |
| 160 mm (indoor) | ||
| 160 mm | ||
| 24 kV | 220 mm | |
| 270 mm | ||
| 123 kV | 900 mm | |
| 1100 mm | ||
Grid Connection
The grid connections of the measurement systems are realized by circuit breakers so that possible short-circuits within the devices can be disconnected. On the one hand the dimensions and costs of the measurement devices for the different voltage levels strongly deviate. On the other hand the effort and costs for the connection to the grid also deviate severely. At the low-voltage level the power switch is very compact and grid connection can be done with simple cables and connectors. At medium – and high-voltage level the design, weight and laying of the cables as well as the necessary mountings are more complicated. Mounting of the sealing ends has to be done by specialized technical personnel. Especially at the high-voltage level the effort and costs are extremely high.
Organization Aspects
Dimensions and weight of the different grid impedance measurement systems vary to each other. At first the transportation of the systems differentiates a lot. The device for the low-voltage level can be easily carried. The measurement system for the medium-voltage level requires a small truck with a crane for transportation. The very large measurement container for the high-voltage level needs a heavy-weight transportation and for its placing a special crane. Additionally the area for assembly has to be considered. The measurement system for medium- and high-voltage level have to be put on solid ground, so that in some cases a fundament is needed. In order to connect these measurement devices to the grid the personnel requires qualification to obtain the authorization to connect and disconnect the devices to the grid.
6. Practical Realizations
Based on the method stated in section 4, measurement systems for the low- and medium-voltage level have been realized to measure the spectral grid impedance. Further on, a measurement system for the high-voltage level is currently being realized.
6.1. Low-Voltage Level (0.4 kV)
Fig. 4 shows the grid impedance measurement system for the low-voltage level. The systemab(jω) canbc (measurejω) theca(jcomplexω) loop impedance parameters and as well as
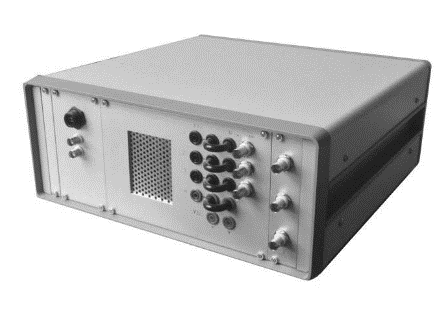 Figure 4. Grid impedance measurement system for the low-voltage level
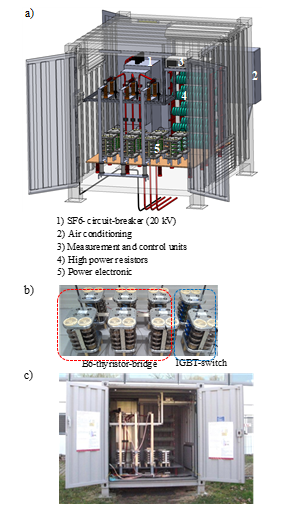 Figure 5. 3D CAD model (a), photo of the power electronic grid excitation cirucit (b) and photo of the medium-voltage measurement container
6.2. Medium-Voltage Level (20 kV)
The setup of the grid impedance measurement system for the medium-voltage level is illustrated as a 3D-CAD model in Fig. 5 a). Fig. 5 c) shows a photo of the system. All components have been installed within a type-tested container. Additionally, to the power electronic circuit (Fig. 5 b)) and the load resistor a circuit-breaker, highly precise voltage and current transducers, high-voltage fuses, overvoltage suppressors, an air-conditioning system and a control and data recording system are installed in the system.
In most cases medium-voltage grids are operated with isolated or compensated starpoints. There is no neutral line/point explicitly available to identify the grid impedances. Therefore the method used on the low-voltage level is adapted, so that only the three conductor line impedance parameters are determined [19]. The system can measure the complex loop- and line impedance parameters in three-wire systems up to 20 kVrms in the frequency range from DC to 20 kHz. The measurement device generates asymmetrical pulsed current signals between two outer conductor lines, whereby every combination can be sequentially pulsed. The maximum pulse amplitude can be varied from 1 Apeak up to 100 Apeak. The measured loop impedance parameters can then be
The power electronic grid excitation circuit is shown in Fig. 6. The B6-thyristor-bridge allows to select two outer conductor lines at a time. Then the IGBT-switch is pulsing the load resistor in order to excite the grid in the frequency region of interest. Each thyristor consists of 8 thyristors in series. The IGBT-switch is build up out of 16 IGBTs connected in series. The high power resistor can be varied in its resistance value in order to adapt the grid excitation current to the short-circuit power at the measurement point.
 Figure 6. Grid impedance measurement circuit on the 20 kV medium-voltage level
 Figure 7. Schemetic circuit diagram for the gird impedance measurement on the 110 kV high voltage level
Fig. 6 shows a 3D-CAD model and photos of the current construction status. The power electronic circuit and the load are installed within a special tank filled with Ester as insulation medium. Each diode in the schematic diagram consists of 6 diode-stacks with each having 12 diodes in series. In total there are 432 diodes in the tank. The IGBT is built up of 15 stacks with each stack containing 6 IGBTs (90 in total). The peak current of the power electronic amounts to 200 A resulting in a possible peak grid excitation current of 22 MW. The temperature rising has to be observed and compensated by an air-conditioning system. The number and time length of the grid excitation correlates with the thermal energy and can be controlled by the measurement software system.
- SF6-circuit-breaker (110 kV )
- Tank filled with ester as isolation medium
- Power electronic modules
- High power resistors
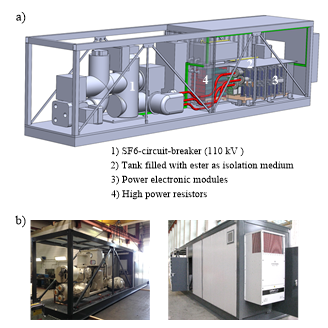 Figure 8. 3D CAD model of 110 kV grid impedance measurement system (a) and photos of the current construction status (b)
Basic specifications of the measurement systems for the low-, medium- and high voltage level are stated in Tab. I. It can be seen that dimensions, weight and costs are highly deviating.
6.3. High-Voltage Level (110 kV)
The grid excitation circuit for the high-voltage level is shown in Fig. 7. In comparison to the medium-voltage level there is a B6-diode bridge in combination with an IGBT and a resistive load. The B6 -diode-bridge offers a simpler design and does not require control signals. Therefore the selection of the outer conductor lines has to be realized by the power switch.
7. Measurement Results and Relevance for Grid Integration
On weekdays, there are generally noticeably different frequency profiles of the grid impedances than on weekends. There are also fluctuations between midday, evening and night hours. For the evaluation of grid perturbations, the frequency dependent grid impedance below 2 kHz (40th harmonic) is especially relevant. The attenuation and frequency of the resonance points can vary greatly over time. At low attenuation, the parallel resonance has a lower frequency width but higher magnitude and at high attenuation vice versa. The damping is mainly determined by the local electrical loads. For Flicker, the 50 Hz grid impedance is crucial, where a single measurement is sufficient, since this usually varies only slightly in time. For the evaluation of harmonics a measurement of the frequency dependent grid impedance over several days or partial weeks is necessary. In particular, if temporally fluctuating feed-in capacities of renewable energies are to be investigated.
Table 3: Specifications of the grid impedance measurement systems for different voltage levels
| Low-Voltage | Medium- | High-Voltage | ||
| Parameter | Voltage Level | |||
| Level (0.4 kV) | Level (110 kV) | |||
| (20 kV) | ||||
| Dimensions | 0,5×0,4×0,2 m | 2,9×2,5×2,5 m | 12,2×2,5×2,7 m | |
| (L×W×H) | ||||
| Weight | 7 kg | 3,65 t | ~26 t | |
| Excitation | 1–20A | 1–100A | 200 A | |
| current | ||||
| Device costs | ~8.000 € | ~200.000 € | ~2.500.000 € | |
| Connection | 0 € | ~10.000 € | ~500.000 € | |
| costs | ||||
7.1. Low-Voltage Level (0.4 kV)
Fig. 9 shows the frequency characteristics of the loop impedances between the conductor lines (“a”, “b” and “c”) and the neutral line (“N”) measured at a low-voltage PCC. The absolute values are increasing with frequency and show some weak parallel and series resonances. Due to a high number of single phase loads there are strong asymmetries in the characteristics. Up to a frequency of about 30 kHz the frequency characteristics are quite similar, but at higher frequencies especially the phase angles show large differences. Some resonances vary over time caused by load profiles, which especially change the damping of resonances. This effect is illustrated in Fig. 10.
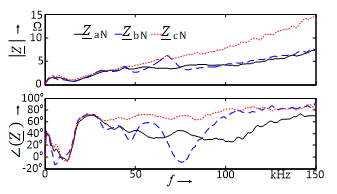 Figure 9. Absolute values and phase angles of the impedances between the conductor lines (“a”, “b” and “c”) and neutral line (“N”) measured at a low-voltage PCC
The first two parallel and series resonance points are below
- kHz and are more attenuated during the day than at night. Reason could be a higher number of switching power supplies on the grid and thus higher cross-capacity due to computers and office equipment. Figure 10 shows the temporal variation of the first parallel resonance at approximately 1.6 kHz. It results from the interrelation of transformer and line inductances as well as capacities of cables and loads.
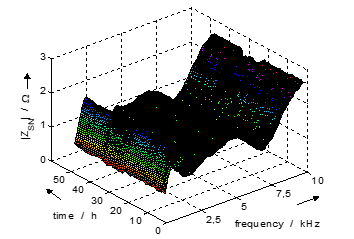 Figure 10. Absolute value of the loop impedance |ZaN| (conductor line “a” to neutral “N”) hourly measured over 3 days at a low-voltage PCC
7.2. Medium-Voltage Level (20 kV)
Fig. 11 presents the frequency characteristics of the loop impedance parameters measured at a medium-voltage PCC (20 kV). Only small asymmetries appear in the characteristics due to the geometric construction of transformers and power lines. The variation in time and frequency of the positive sequence component is displayed in Fig. 12. Two parallel resonance points can be seen at about 3.8 kHz and 12 kHz with high absolute values of about 400 Ω and 300 Ω, where the phase angle amounts to 0°. Series resonances can be seen at about 7.5 kHz and 15.5 kHz with local minimum impedance values and phase angles of 0°.
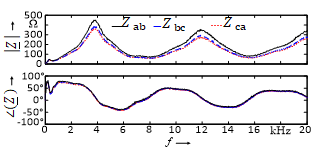 Figure 11. Absolute values and phase angles of the loop impedances between the conductor lines (“a”, ”b” and “c”) at a 20 kV medium-voltage PCC
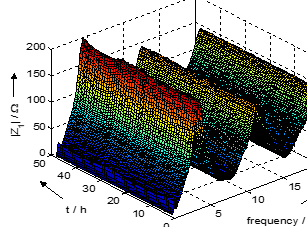 Figure 12. Absolute value of the positive sequence component |Z1| from DC to 20 kHz hourly measured over two days at a 20 kV medium-voltage PCC
Especially resonances in the frequency range below 1 kHz change over time with a day-night cycle. This effect can be seen in more detail in Fig. 13. The first parallel resonance point at 250 Hz (5th harmonic) shows higher peaks at night and more attenuation with less absolute values in the daytime.
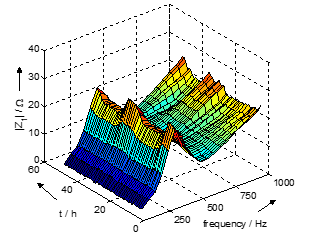 Figure 13. Absolute value of the positive sequence component |Z1| from DC to 1000 Hz hourly measured over two days at a 20 kV medium-voltage PCC
7.3. Relevance for Grid Integration
The measurement of the grid impedance can contribute to an improved grid integration of renewable energies. Its knowledge allows a more accurate calculation of the harmonic propagation in the grid. Currently, estimation methods based on measured RMS values of the injected currents are mostly used [2], [7], [9]. But when connecting renewable energy systems to the grid, two sources of harmonics should be considered in general. On the one hand, the renewable energy systems feed harmonic or inter-harmonic currents into the grid. On the other hand, the existing pre-load of the grid with harmonic voltages must be considered. With the frequency-dependent grid impedance and the complex values of the injected currents, the harmonic emission of renewable energies can be determined more accurately. Early detection of resonant frequencies and locations in the frequency characteristics of the grid impedances at the PCC can be used to better select grid equipment when connecting renewable energies. The knowledge of resonance points at the PCC is decisive for the determination of the pulse frequency in the used inverter. It can be varied within certain limits, whereby problems with excessive harmonic voltages at the affected frequencies can be avoided. Operation with variable pulse frequencies can reduce the dependence of the harmonic content on the operating point. Furthermore, the internal power and harmonic controllers can be better adapted to the grid. Power fluctuations and instabilities can be avoided. A lowering of the harmonic voltages can be achieved.
Additionally existing and possibly additionally required filter systems, as well as the renewable energy systems themselves and their inverters, can be designed more efficiently for the PCC. In this way, grid-side and internal filter systems and current controller loops can be better adapted to the PCC in advance as well as in the case of existing renewable energy systems. The dimensioning of a passive filter presupposes knowledge of the grid impedance or its assumed knowledge as well as the harmonic content of the grid. Temporal variations must also be considered in order to avoid resonances, as this can make the overall system unstable. The grid impedance is also needed for the design of active filters and their stable operation.
Furthermore, the maximum possible feed-in power of a PCC can be determined, as a result of which possibly additional systems can be connected to it. In summary an improved grid integration of renewable energy systems could look like this:
- Measure the source voltages at the PCC with the identification of the existing harmonic voltage spectra
- Measurement of the frequency dependent grid impedances with the developed grid impedance measurement systems
- Identification of resonance points
- Determination of the maximum grid connection capacity
- Establishment of a mathematical model of the grid
- Selection and dimensioning of suitable cables and equipment for connection of renewable energy systems
- Simulation of the grid connection model and the plant certificate or if available a harmonic model of the renewable energy systems and the selected equipment
- Detection of possible problems at resonance frequencies and, if necessary, adaptation of the pulse frequency of the inverter
- Optimized design of filter systems for low harmonics
- Optimized design of current controllers used within the inverter to avoid stability problems
- Connection of additional renewable energy systems if limitation values have not yet been reached
8. Summary
This paper presents the challenges and the realization of three measurement devices for the grid impedance identification on the low-, medium- and high-voltage level. Their measurement results allow to determine the grid capacity of points of common coupling (PCC). The grid impedance at the fundamental frequency is directly related to the short-circuit power, so that conclusions about the tolerable connection power for loads or generation units can be stated. Then the measured frequency characteristic can be used to assess the grid feedback and propagation of harmonics especially within the context of an increasing share of renewable energies and their effect on the grid voltages. At first the used measurement method based on the pulsing of a known load using a special power electronic switch concept is described. The grid is excited in the frequency region of interest and the generated current and voltage transients are used to calculate the grid impedance. Then the applications of this method to the low-, medium- and high-voltage level are outlined. Due to the different voltages and short-circuit grid powers as well as grid structures there are quite different concepts necessary. Based on the experience of the small device for the low-voltage level, a 10-feet measurement container for the medium-voltage level has been built. Additionally the development of a 40-feet measurement container for the high-voltage level is introduced. These devices are compared with each other. Finally measurement results on the low- and medium-voltage level conclude this contribution. An improved grid integration of especially renewable energy systems can be enabled. With these novel devices a validation of other grid impedance measurement devices based on different methods can be achieved.
In the future the miniaturization of the presented measurement devices will be further investigated and pursued.
- H. Langkowski, M. Jordan, T.T. Do, D. Schulz, “Spectral Grid Impedance Identification on Different Voltage Levels – Challenges and Realization,” 2017 IEEE PES General Meeting, July 16-20, 2017, Chicago, 2017.
- D. Schulz, Power Quality – Theory, Simulation, Measurement and Assessment (in German), VDE-Verlag, Offenbach (2004), ISBN 3-8007-2757-9.
- H. Langkowski, M. Jordan, T. Do Thanh and D. Schulz, “Grid impedance determination – identification of neutral line impedance,” 21st International Conference on Electricity Distribution CIRED, Frankfurt, 6-9 June 2011.
- H. Langkowski, T. Do Thanh, M. Jordan and D. Schulz, “Grid Impedance Identification considering the Influence of Coupling Impedances,” IEEE International Symposium on Industrial Electronics (ISIE 2010), Bari (Italy), 4-7 July 2010.
- M. Jordan, H. Langkowski, T. Do Thanh and D. Schulz, “Frequency Dependent Grid-Impedance Determination with Pulse-Width-Modulation-Signals,” IEEE 7th International Conference-Workshop Compatibility and Power Electronics CPE 2011, Tallinn (Estonia), 1-3 June 2011.
- K. Heuck, K.-D. Dettmann, and D. Schulz, “Elektrische Energieversorgung”, Vieweg, 9th Edition, Wiesbaden, 2013.
- BDEW, “Technical Guideline for Power Generation Plants at Medium-Voltage Grid”, (in German), BDEW, Berlin, 2008.
- DIN EN50160, Characteristics of the Voltage in Public Electrical Power Supply networks, (2011).
- VDN, Technical Guideline for EEG Power Generation Plants at High and Highest Voltage Grid (in German), VDN, Berlin (2004).
- H. Langkowski, T. T. Do, and D. Schulz, “Grid Impedance Determination – Relevancy for Grid Integration of Renewable Energy Systems”, IEEE IECON-09, Porto (2009).
- M. Liserre, R. Teodorescu and F. Blaabjerg, “Stability of Photovoltaic and Wind Turbine Grid-Connected Inverters for a Large Set of Grid Impedance Values”, IEEE Transactions on Power Electronics, Vol. 21, No. 1, Jan. 2006.
- R. Langella and A. Testa, “A New Method for Statistical Assessment of the System Harmonic Impedance and of the Background Voltage Distortion,” 9th International Conference on Probalistic Methods Applied to Power Systems IEEE, Stockholm, Sweden, June 2006
- A. Knop and F. W. Fuchs, “High frequency grid impedance analysis with three-phase converter and FPGA based tolerance band Controller,” Compatibility and Power Electronics (CPE’09), Badajoz, May 2009
- C. Xie, S.B. Tennakoon, R. Langella, D. Gallo, A. Testa, and A. Wixon,“Harmonic impedance measurement of a 25 kV single phase AC supply system,” Proceedings of Ninth International Conference on Harmonics and Quality of Power, Orlando, vol. 1, pp. 214-219, 1-4 Oct. 2000.
- M. Nagal, W. Xu, and J. Sawada, “Harmonic impedance measurement using three-phase transients,” IEEE Transactions on Power Delivery, vol. 13, pp. 272-277, January 1998.
- M. Jordan, T. Do Thanh, H. Langkowski and D. Schulz, “Strategies for Frequency Dependent Grid Impedance Measurement at the Medium- and High-Voltage Level,” 5th International Ege Energy Symposium and Exhibition (IEESE-5), Denizli, 27-30 June 2010.
- M. Jordan, F. Grumm, H. Langkowski, T. Do Thanh and D. Schulz, “Online Network Impedance Identification with Wave-Package and Inter-Harmonic Signals,” XII International School on Nonsinusoidal Currents and Compensation 2015 (IEEE), Lagów (Poland), 15-18 June 2015.
- H. Langkowski, M. Jordan, T. Do Thanh and D. Schulz, “Grid impedance determination – identification of neutral line impedance,” 21st International Conference on Electricity Distribution CIRED, Frankfurt, 6-9 June 2011
- T. Do Thanh, T. Schostan, T. Dettmann and D. Schulz, “Nonsinusoidal Power Caused by Measurements of Grid Impedances at Unbalanced Grid Voltages,” Proceedings of the IEEE conference of the International School on Nonsinusoidal Currents and Compensation ISNCC, Lagow, 10-13 June 2008