State Estimation based Echolocation Bionics and Image Processing based Target Pattern Recognition

Adv. Sci. Technol. Eng. Syst. J. 4(1), 73–83 (2019);
 DOI: 10.25046/aj040108
This paper deals with the theoretical aspect of bat echolocation and bionics, and image processing-based target recognition and identification methods. The state estimation methods utilizing the linear rustic filters such as fixed gain and Kalman filters are studied and implemented for echolocation bionics for estimating the LOS distance. A complete mathematical modeling and simulation of bat dynamics and its prey are presented upon which the relative LOS distance is reconstructed with state estimators and less RMS errors. Also, target recognition and identification using Optical, IR Digital Night Vision and Thermal camera is studied and implemented at different environmental conditions to demonstrate the superiority of thermal camera.
1. Introduction
Since the dawn of the Strategic Defense Initiative (SDI), different types of threats and the complex defense system architectures have always been a confrontation to the target detection and tracking. In this context, detection is always prior to tracking without which the aerospace guidance and control is practically impossible [1]. In fact, this is true for civilian sensors such as Primary and Secondary Surveillance Radars to control incoming and departing airplanes, as well as, for military sensors to perform a sequence of successful tasks [2]. The degree of target detection and tracking varies from single sensor to multiple sensors which led to multi sensor fusion for multi object tracking. Intelligence, Surveillance and Reconnaissance (ISR), missile guidance and control, remote sensing and oceanography, computer vision and robotic applications are the few wide variety of applications utilizing from single sensor to multiple sensor detection and tracking [3]. Based on the type of threat and nature of attack many integrated solutions have been introduced to confront with the threat. One such an example is U.S. National Missile Defense system. Aurgus and Cerebrus are the FLIR designed integrated systems for border surveillance with 24/7 situational awareness [4]. Apart from RADAR, Optical and Thermal technology, Bat acoustic detection system, a new technology was introduced for target localization and identification. Echolocation bionics [5], [6] based on the bat technology utilizing the acoustic echo is a process of determining the relative range and velocity, bearing angle and size of the target. In fact, echolocation bionics has the superior advantages and success rate compared to other detection and tracking technologies that made it helpful in civil and military applications. However, irrespective of any given dynamic situation and the type of technology, the designated track has to be followed by a closed loop system tracker for airborne interception or ground attack that requires high performance data association algorithms. The purpose of data association and processing algorithms is to mitigate the high degree of uncertainty associated with the target motion and the environmental conditions resulting from system noise and measurement noise [7] [8]. With these insights, this paper presents the theoretical advancements in echolocation bionics and, tracking and filtering of bat acoustic signal that could enhance the performance of echolocation bionic sensors. On the other hand, this paper also focuses on application of image processing techniques using Finite Impulse Response filters as an added extension to the echolocation bionics. Two-dimensional FIR filters are the most profoundly used filters for image data processing from a given particular optical device. Image data processing techniques such as image sharpening and smoothing, detecting edges in a particular image clustered with many features, and contrast improvement are necessary to apply for agiven 2D image data in the presence of noisy environments. All these techniques are applied to visualize the data as being the key objective in modern computational sciences. Data visualization is not an easy operation as how it has been in a perfect daylight conditions. In poor visibility, capturing and processing of image data and its visualization is quite daunting and a difficult task. However, there are optical and thermal sensors that can enhance processing of an image even in poor visibility conditions. In this paper, the image of a drone is captured by a digital night vision camera with built-in IR mode and a thermal camera to examine the effects with a 2D FIR filter. This paper presents the superiority and the performance of individual sensor in detection and enhancement, and recognize the patterns in the captured images. Section 2 presents the echolocation bionics and state estimation. Section 3discusses the sensor specifications and test images of target. Section 4demonstrates the image processing based target recognition and identification methods.
2. Echolocation and Tracking
Usually, the mouth (nose) of bat is for broadcasting echolocation and its ears were used as receiving antennas. The emission system of bat is an adaptive waveform where each pulse consists of eight signals. Four long-constant frequency (CF) and four short constant frequency modulated (FM) harmonics [9]. The speed information is obtained by CF component and the FM component determines the detection and imaging. Whenever a bat gets closer to its stationary prey, due to Doppler Effect the echo frequency becomes higher than the emitted pulse [10]. At the same time, the pulse density becomes larger and larger which is shown in Figure 1 describing the attack process of a bat and the adaptive waveform conversion on the top left.
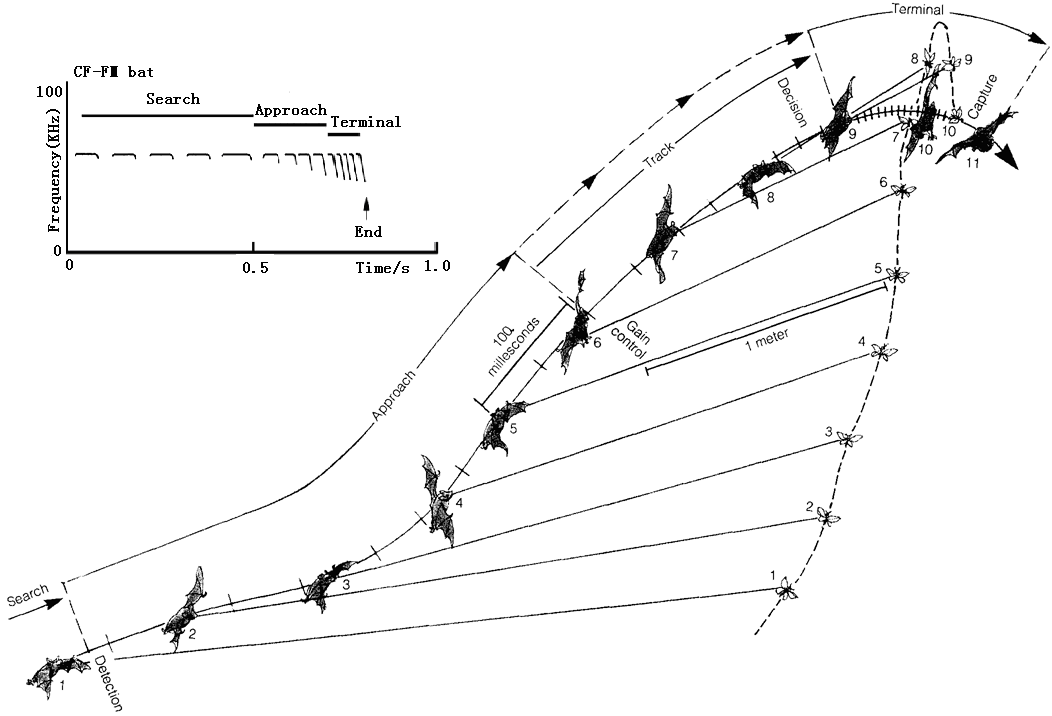 Figure 1.Bat intercepting its prey [10]
A three dimensional simulation of a bat sonar beam while attacking its prey, and the two dimensional spectrogram sequence of the bat echolocation relative to the target [11] is shown in Figure 2. Initially the bat searches for its prey using its directional beam and once the prey is detected the target is locked with the sonar beam. The bat while hunting to its prey decreases the number of echoes it emits using automatic gain control.
For the purpose of simulation and based on the literature available as represented in the Figures 1 and 2, the three dimensional motion of the bat is considered as a spiral motion and the prey or the target is stationary. The position and the velocity of the target are almost negligible when compared to the motion of the bat. It is assumed that the bat has already received the passive observation of the target and the simulation shows the hunting of the bat toward its prey. The relative position which is also known as line of sight (LOS) between the bat and the prey is considered for tracking using different state estimators and the performance evaluation of each estimator in terms of RMS error measure. Using the flat earth approximation [12], the target and its prey are described in a Spherical Coordinate system [13] upon which the position is illustrated in Cartesian coordinate system for 3D target tracking. Therefore, the finite dimensional representation [14] for the target and the prey model, as well as, the LOS system measurements [15] are modeled by
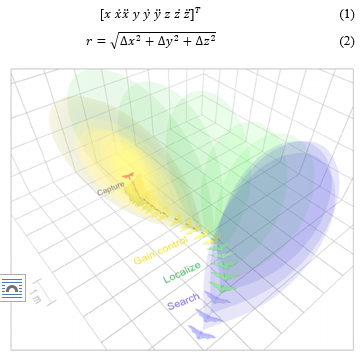 Figure 2. Approach methods of bat [11]
Equation 1 describes the 3D motion characteristics of bat and its prey in terms of position, velocity and acceleration. Equation 2 presents the relative position or the line of sight distance between the bat and its target. Figure 3 shows the motion characteristics [16] that are utilized in state variable form and all the motions are simulated in MATLAB.
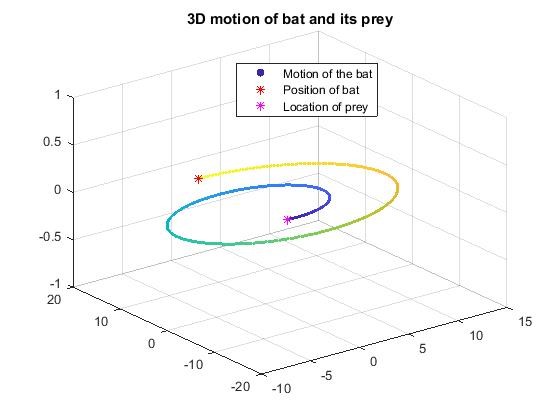 Figure 3. Bat its prey motion dynamics
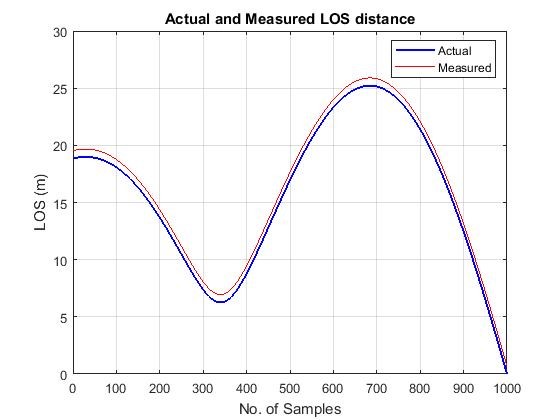 Figure 4.Relative LOS distance
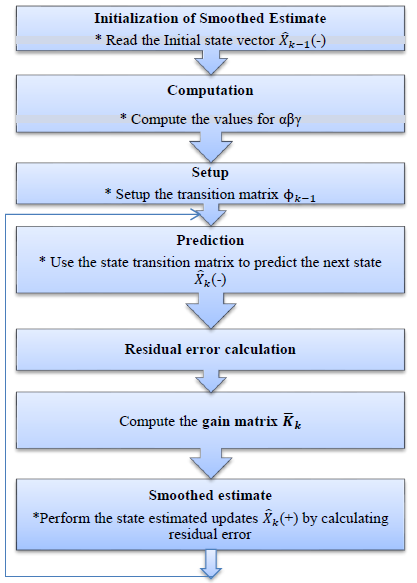 Figure 5. Fixed gain filter recursive flow diagram [19]
2.1. State Estimation of Line of Sight
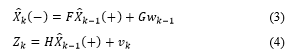
The difference in position between the bat and its prey is considered as the line of sight (LOS) distance for which a popular finite-dimension approach known as state estimation is utilized in this paper for predicting and correcting the LOS distance. Therefore, the generic representation of a kinetic model [17] is given by
 Two different filters namely fixed-gain andKalman filters are studied and implemented for LOS estimation. Before examining each filter, the underlying assumption made is portraying the measurement acoustic noise as zero-mean Gaussian (ZMG) as shown in the Figure 4 with a known standard deviation.
2.2. Linear Rustic Filters
Assuming that the system is a linear time invariant [18], the first class of rustic filters namely fixed gain and Kalman filters are implemented for which the process flow diagram for each filter is shown in Figures 5 and 6. A one dimensional third order filter is adopted for the LOS estimation.
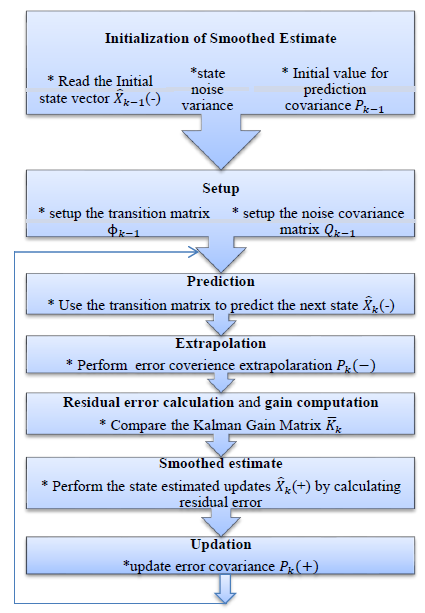 Figure 6. Kalman filter recursive flow diagram [19]
Table 1 Simulation Parameters
| Sampling Interval (T) | 0.01 sec |
| Measurement Noise Variance | 0.035 |
| Process Noise Variance | 0.5 |
2.3. Simulation Analysis
For the purpose of simulation, it is assumed that both bat and prey are in the vicinity with a radius of maximum of 25 meters. The simulation parameters are shown in Table1.
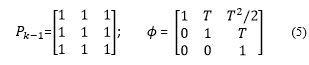
The initial values of prediction covariance and transition matrix are employed as follows:
 To ensure the performance of each estimator the error analysis in LOS distance is computed using RMS error given by the Equation 6.
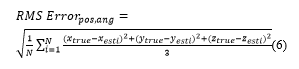
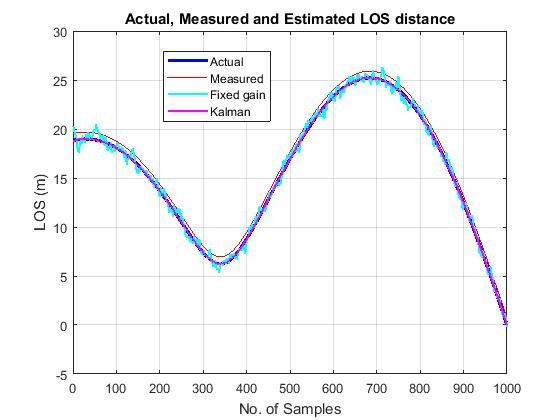 Figure 7. Actual, Measured and LOS distances
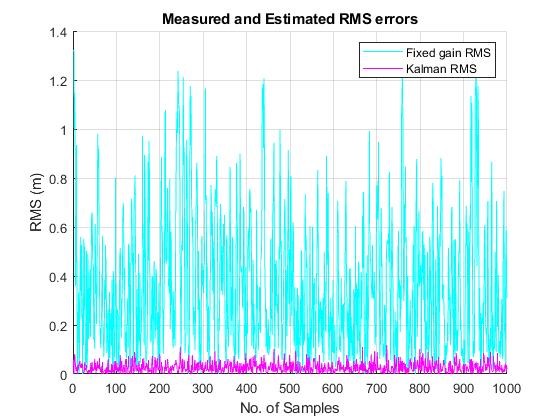 Figure 8. RMS Errors
Figure 7 shows the tracking performances for LOS distance. The principal function of these trackers is for better signal reconstruction by reducing measurement noise with less residual. The performance of each filter estimates is shown from Figure 8. It is found that the efficiency of fixed gain filter is highly reliable upon the filter gain coefficients which are solely depend upon the smoothing coefficient that varies from zero to one. A value of 1 is chosen for heavy smoothing and low value for less smoothing. Whereas the Kalman filter has a better estimate than fixed gain filter because the Kalman gains are computed dynamically. In other words the Kalman gain matrix is determined from the state error variance as well as from measurement and noise variances adjusts adaptively. The Kalman filter computes its own state error uncertainty estimates while observing a new measurement. Also as it is mentioned [20] if the new measurement noise error variance is bigger than the state error variance, the Kalman filter will place less emphasis on the new measurement than if the state error is larger than the measurement error. On the other hand the simple fixed gain filter computes the filter gains based on assigned smoothing coefficient. This effect and the superiority of Kalman filter over fixed gain estimator can be seen in RMS errors shown in Figure 8. The performance of the fixed gain and Kalman filters serves as best linear estimators for reducing mean squared errors in LOS distance. The next section deals with the target recognition and identification using image processing techniques. From the Figure 8 and using the equation 6 the RMS errors for measured, fixed gain and Kalman filter is found to be 1.5350 m, 0.3119 m and 0.0206 m, respectively, and are shown in Table 2.
Table 2: Thermal Camera Specs
| LOS RMS errors | |
| Filter type | RMS error |
| Measured | 1.5350 |
| Fixed gain filter | 0.3119 |
| Kalman filter | 0.0206 |
Table 3: IR Digital Night Vision Camera Specs
| Sensor Type | Technical Specs | |
|
Digital Night Vision |
Sensor | CMOS Sensor, Max. 24 MP |
| Lens | Fixed lens, F/3.2, f=7.5mm | |
| Focus Range | Normal: 1m ~ infinity | |
| Image | Resolution: FHD, 3Mp – 24 Mp | |
| Video | Resolution: FHD (1920˟1080) – VGA | |
| Night Vision range | <3.0 m | |
|
IR LED Illuminator |
No. of LED | 198 |
| IR range | 300-400 feet (100-130 meters) | |
| Light beam angle | 45-60 degree | |
| Wavelength | 850nm | |
3. Sensor Specifications
3.1. Night Vision Camera
A night vision digital video camera is employed for capturing the images to post process the images in the MATLAB. The night vision camera selected for this experiment belongs to a class of image intensifier (I2) device. Also, a CMVision IR infrared illuminator is added to the night vision camera for more illumination of the target drone. The important technical specifications [21] of the two devices are given in Table 3.
3.2. Thermal Camera
A Seek CompactXR thermal imaging camera designed for smart phone is utilized in this research work. The purpose of using a thermal camera is based on their ability to detect and track in extreme pitch black conditions.They are more sensitive to temperature variations. Designed with over 32,000 thermal pixels, the CompactXR will sense the temperature illumination and displays on the smart phone installed with the Seek thermal app. The important technical features [22] of the thermal sensor are given in Table 4.
Table 4: Thermal Camera Specs
| Technical Specs | |
| Sensor | 206˟156 thermal sensor |
| Field of View (FoV) | 200 narrow FoV |
| Operating distance | 1,800 ft (548 m) |
| Detection range | -400F to 6260F |
| Wavelength | Long Wave Infrared (7.2 – 13 Microns) |
3.3. Target Drone and Platform Setup
A 4 channel X5C 2.4GHz remote control quadcopter is used as a target drone. The size of the drone is 16.5 x 12.2 x 3.8 inches. Although, this drone is designed with built-in 6 axis gyroscope with 3600 3D eversion and throwing flight function, the target drone was made to hang on a wallas well as tree for the sake of simplicity in simulation. A tripod mounted with different sensors shown in Figure 9 is used to capture the images of the drone at different light conditions.
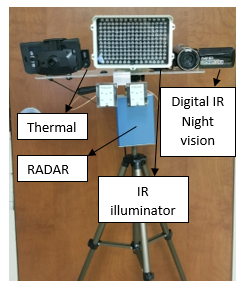 Figure 9. Sensors Tripod
To better understand the image processing techniques, two different environmental backgrounds are considered and the performance of each device is observed. The first set of images is taken with a dark background and the second set of images is taken as the target drone blended to the outside environment.
- First set of Images
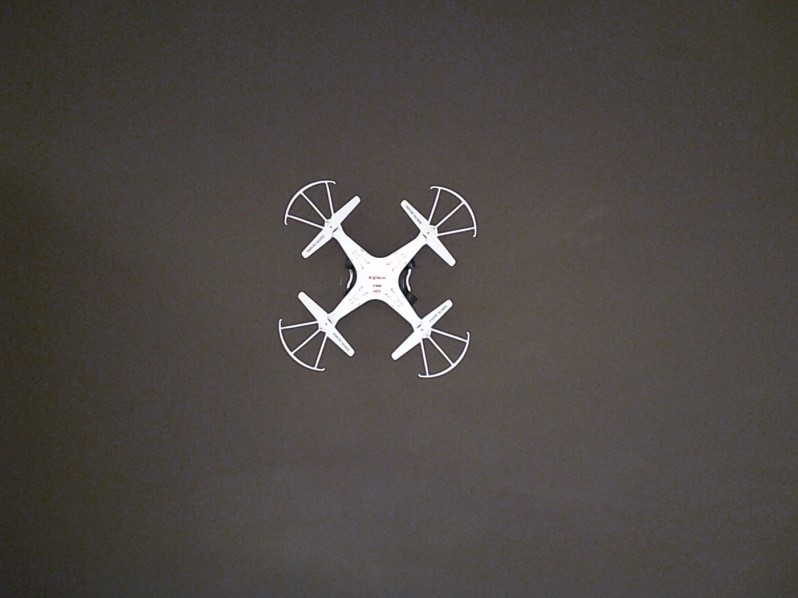 Figure 10. Test image with dark background
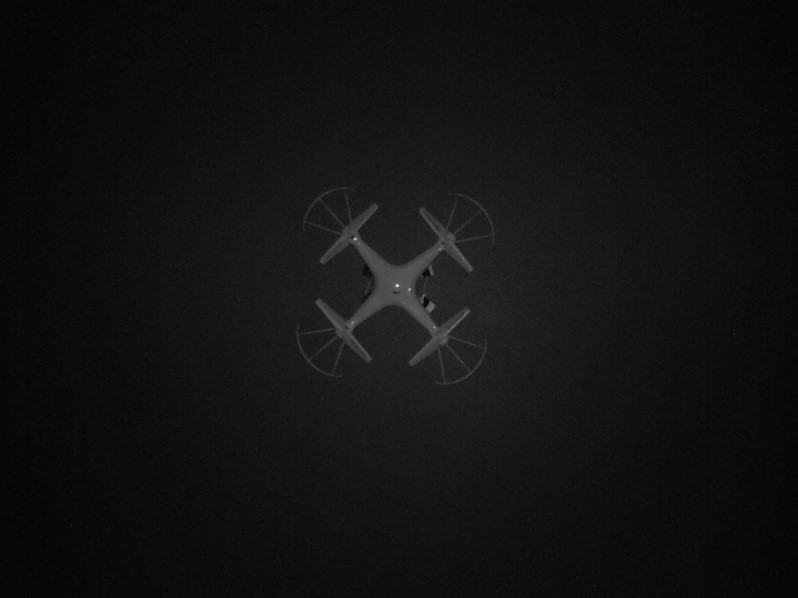 Figure 11. Test image in night vision
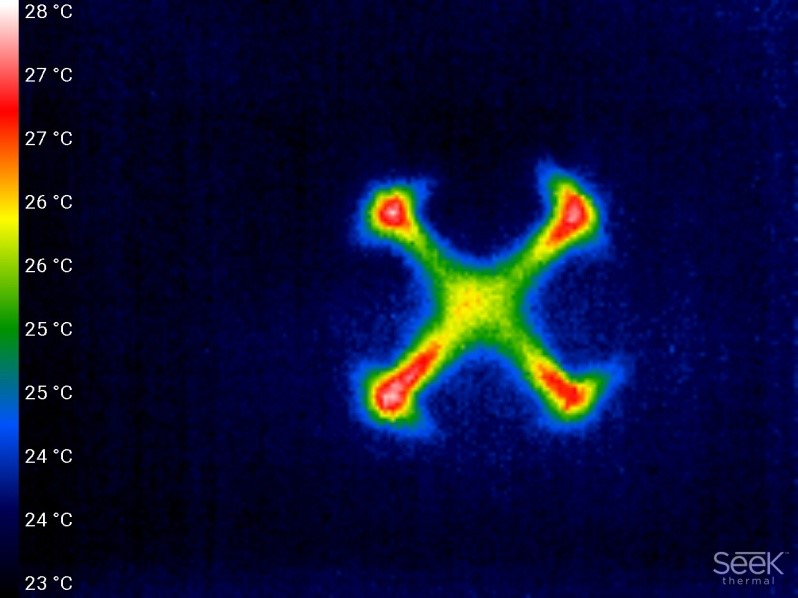 Figure 12. Thermal image
- Second Set of Images
 Figure 13. Test image when target blended to the background
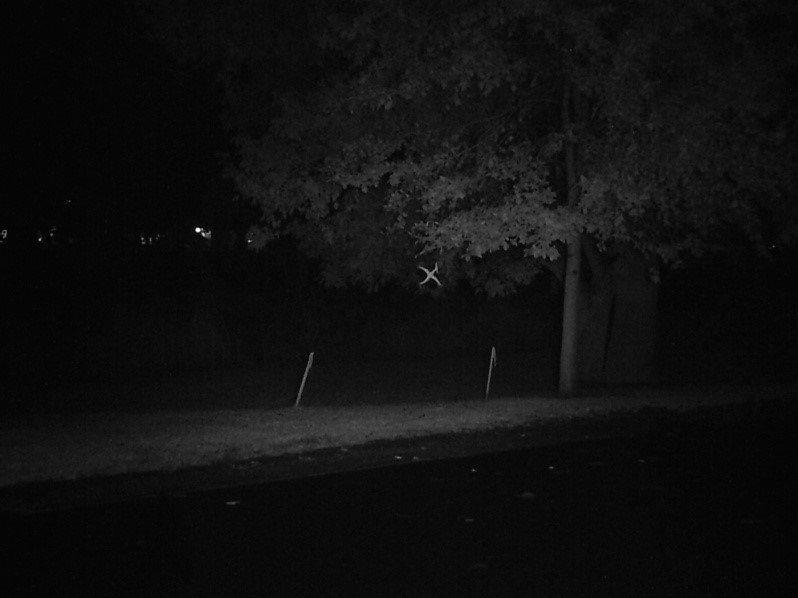 Figure 14. Figure: Test image in night vision
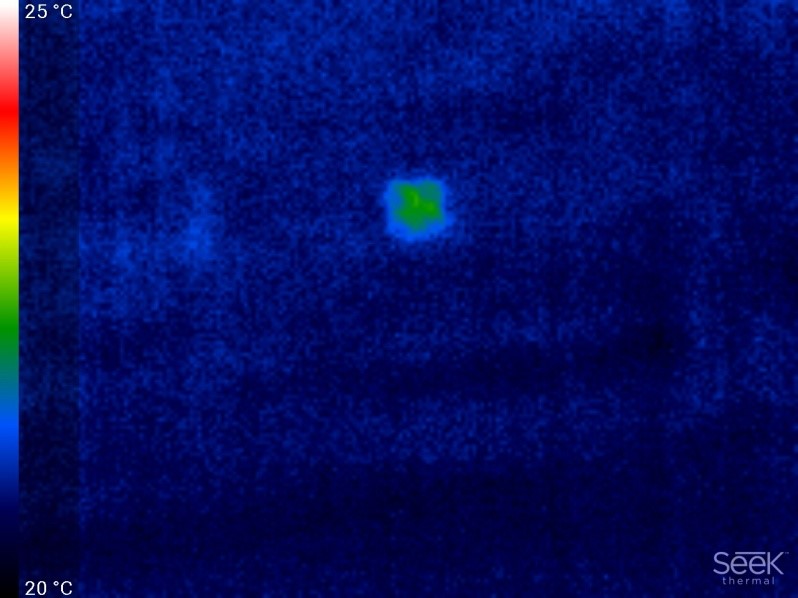 Figure 15. Thermal image
The heat dissipated by the motors of the drone can be easily seen in Figures 12 and 13. The next section deals with the numerical simulation analysis by utilizing the edge detection, image sharpening, smoothing, and contrast enhancement techniques [20].
4. Numerical Simulation Analysis
Each pixel element representing the brightness on the corresponding location in an image is an 8-bit number and can be combined with the adjacent pixels through simple weighted average. Also, the texture of the image as well as sharpness, resolution and contrast can be altered. Moreover, the importance of feature extraction using a signal processing filter known as template detector can also be applied to an image to extract the features like edges of a drone when blended into the surrounding clutter. For the regions where there is a perfect match between the template and pixel, the template detector produces high output for those regions. In the neighborhood of diversity of drones, the computer will be able to recognize one drone from the other using vision feature in which the 2D digital filter or the convolver has become the main processing tool. The core function of a 2D filter is to combine the local pixels with the weights to output the filtered image brightness. It can be expressed as
where, is the processed image brightness and are the weights. Based on the solid foundation of 2D FIR filters, the moving average technique has originated as a fundamental process for brightness computation that utilizes weighted average of the neighborhood pixels. The visual effects such as alteration of image focus, image contrast and sharpness can also be implemented with 2D filters. They can enhance and reduce the texture features in an image. One of the simple illustrations of a 2D FIR filtering process is pixilation or pixel decimation where all the pixels are replaced by the average of the pixels of original higher resolution image. This technique is often applied in television broadcast to obscure some offensive images and blur the selected areas.
4.1. Edge Detection
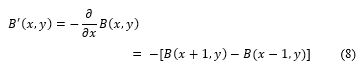
One of the wider applications of a 2D FIR filter is edge detection to enhance boundaries or the shape of an object in an image.As 2D FIR filtering being a prominent application in computer pattern recognition, determining the edges of a target in a particular image can extract important features such as its size and shape. The target considered here is a drone in the image captured by digital night vision and thermal camera. A gradient filter which is an example of an edge detector is applied in the direction of positive x-gradient. Since it is undesirable to produce an output image offset by half a pixel in the desired gradient direction, a symmetric finite-difference approximation is typically used to avoid the unwanted offsets. It is given by the equation
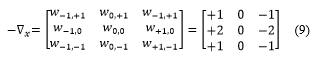
 The effect of the negative sign in front of the equation 8 is shown in Figures 16, 18 and 19. These are the observations performed by an edge detector using a gradient with directional derivatives. The disadvantage of these directional derivatives is the presence of the inherent noise. As this method is solely based on a finite difference method, there will always be a random noise associated because ofthe difference computation between the two pixels. The finite difference method tends to amplify the noise and averaging the pixels tends to smooth out the image noise. However, apart from these deficiencies, the noise can be suppressed by adding more pixels in the filter. This can be accomplished by simply averaging the derivatives based on the choice of direction. If it is in x-direction, the derivatives in the adjacent rows will be averaged, else the adjacent columns in y-direction. The choice of filter weights when the gradient is in the negative x-direction are given by the equation
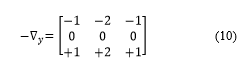
 Equation is known as kernel operator that has an ease of rotation based on the desired gradient direction. In essence, the negative kernel operator in upward (positive) y-direction is given by equation
 There are different 2D based gradient kernel operators available with respect to size and complexity, and finite-difference approximation based higher order filters. Any two-dimensional image data with gradient information is useful for automatic detection to identify and extract the geometric features. These directional derivative gradients applied either in the x (toward right) and y (upward) axis are essential for detecting the edges in a particular orientation of an image. However, the complete geometric features of an image in all directions, i.e., all edges of a particular object in an image are needed for the application of this paper. Indeed, by detecting all edges simultaneously, the important features such as shape and size, as well as orientation can be determined. A widely used conventional edge detection technique known as Sobel edge detection is utilized in this paper for identifying the target object which is the drone in the test images. A Sobel edge detector first calculates the spatial derivatives in each x-and-y directions. Thereby, it sums their squares and computes the square root. This complex process can be avoided by Kirsh operator which is very less complex in nature. Instead of computing the square root of the sum, the Kirsh operator estimates the neighborhood gradients and calculates the maximum absolute value to produce an edge detected output. Figures 16, 17 and 18 show the application of Sobel edge detection combined with Kirsh operator approximation depicting the significance of edge detection for feature extraction. Moreover, apart from the various features of these images that are useful for pattern recognition analysis, these edge detection techniques are also applicable to enhance the image visual quality.
4.2. Image Enhancement
Typically, these edge detectors are considered as high-pass filters through which the random changes in spatial brightness could be seen. On the other aspect, the sharpness of an image to its highest acuity can be enhanced by amplifying the higher frequencies and attenuating the lower frequencies. A rotational invariant Laplacian operator is applied for the test images shown in Figure 10, 11, 13 and 14 to perform this operation and is given by
![]()
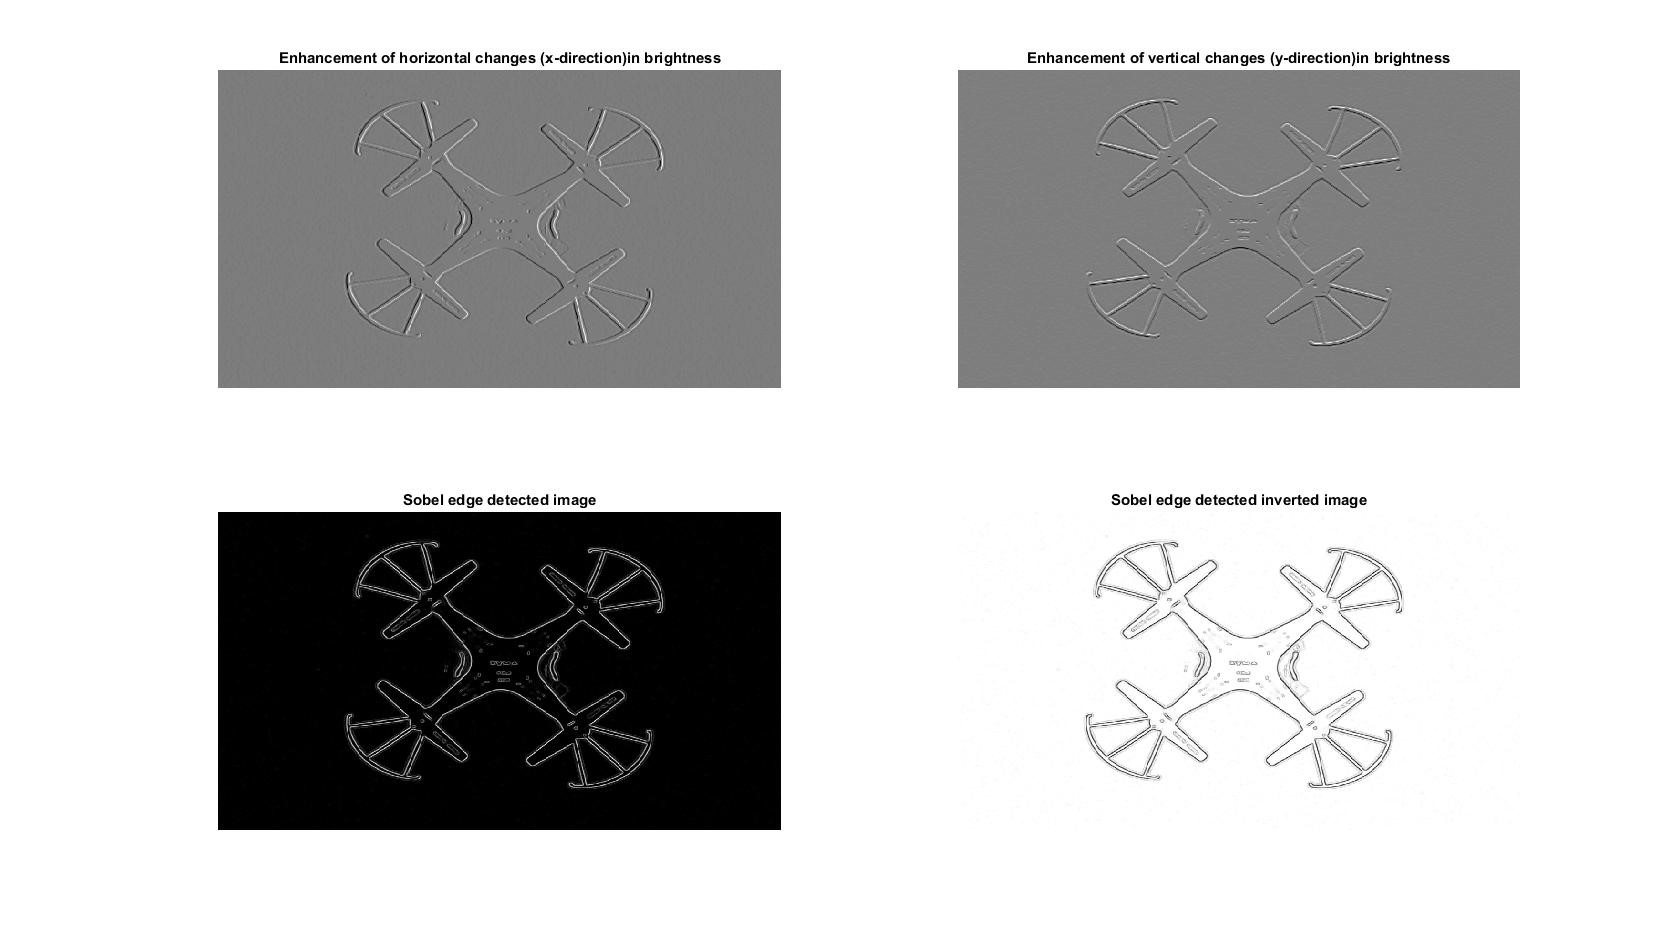 Figure 16. Enhancement and edge detection of optical image
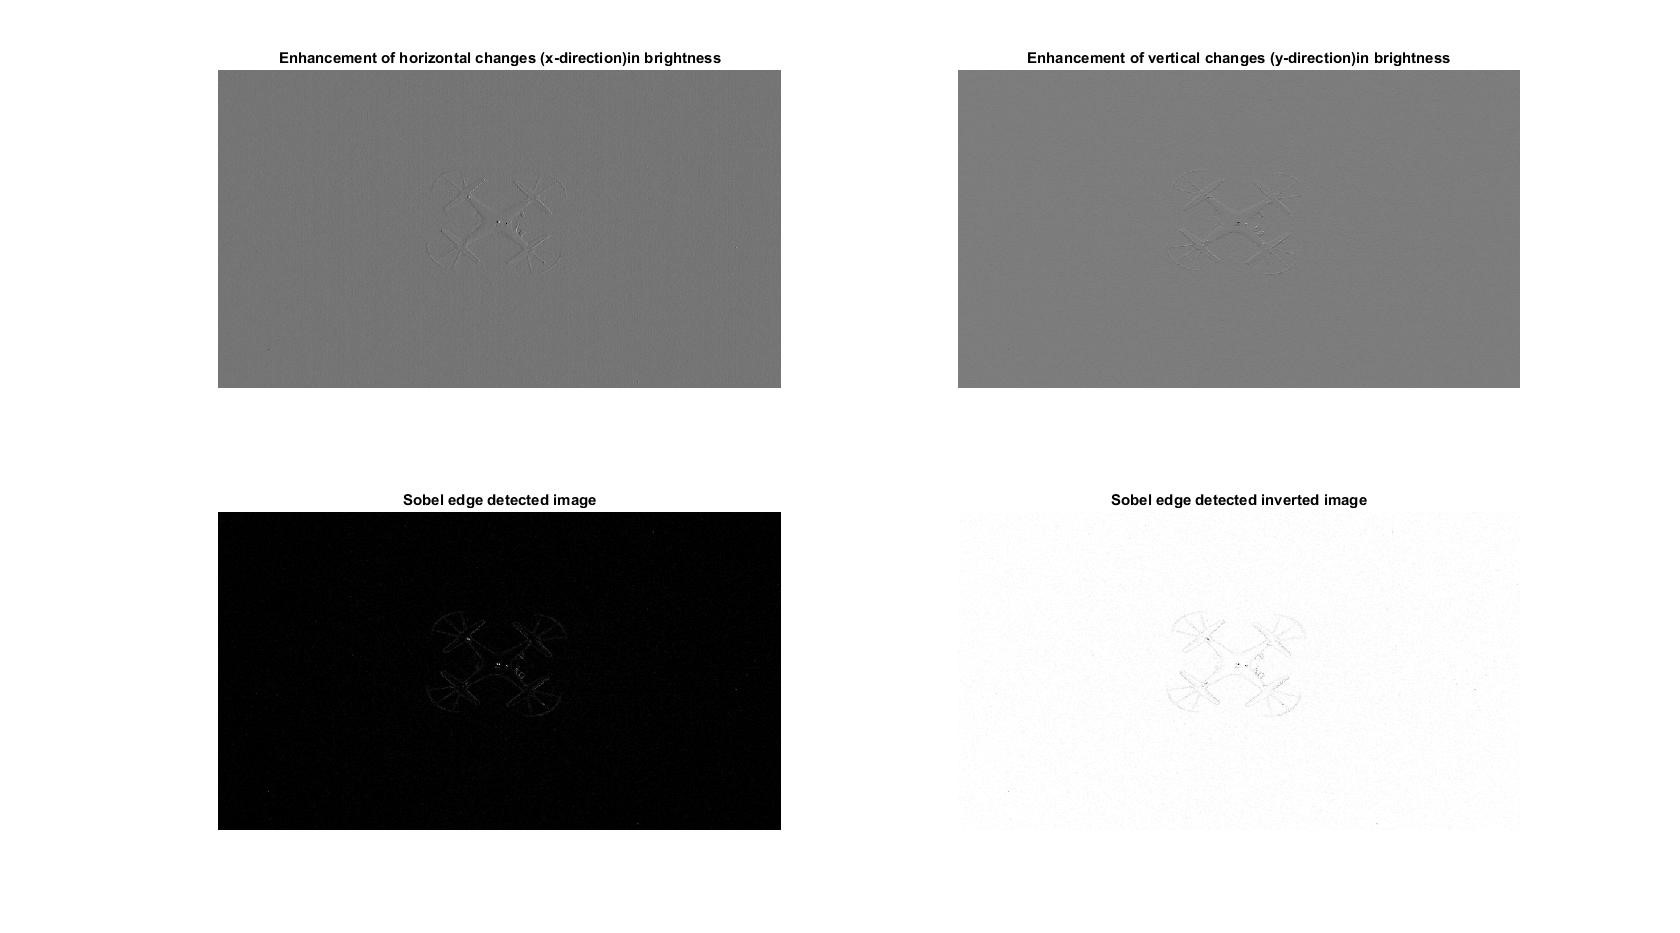 Figure 17. Edge detection of night vision image
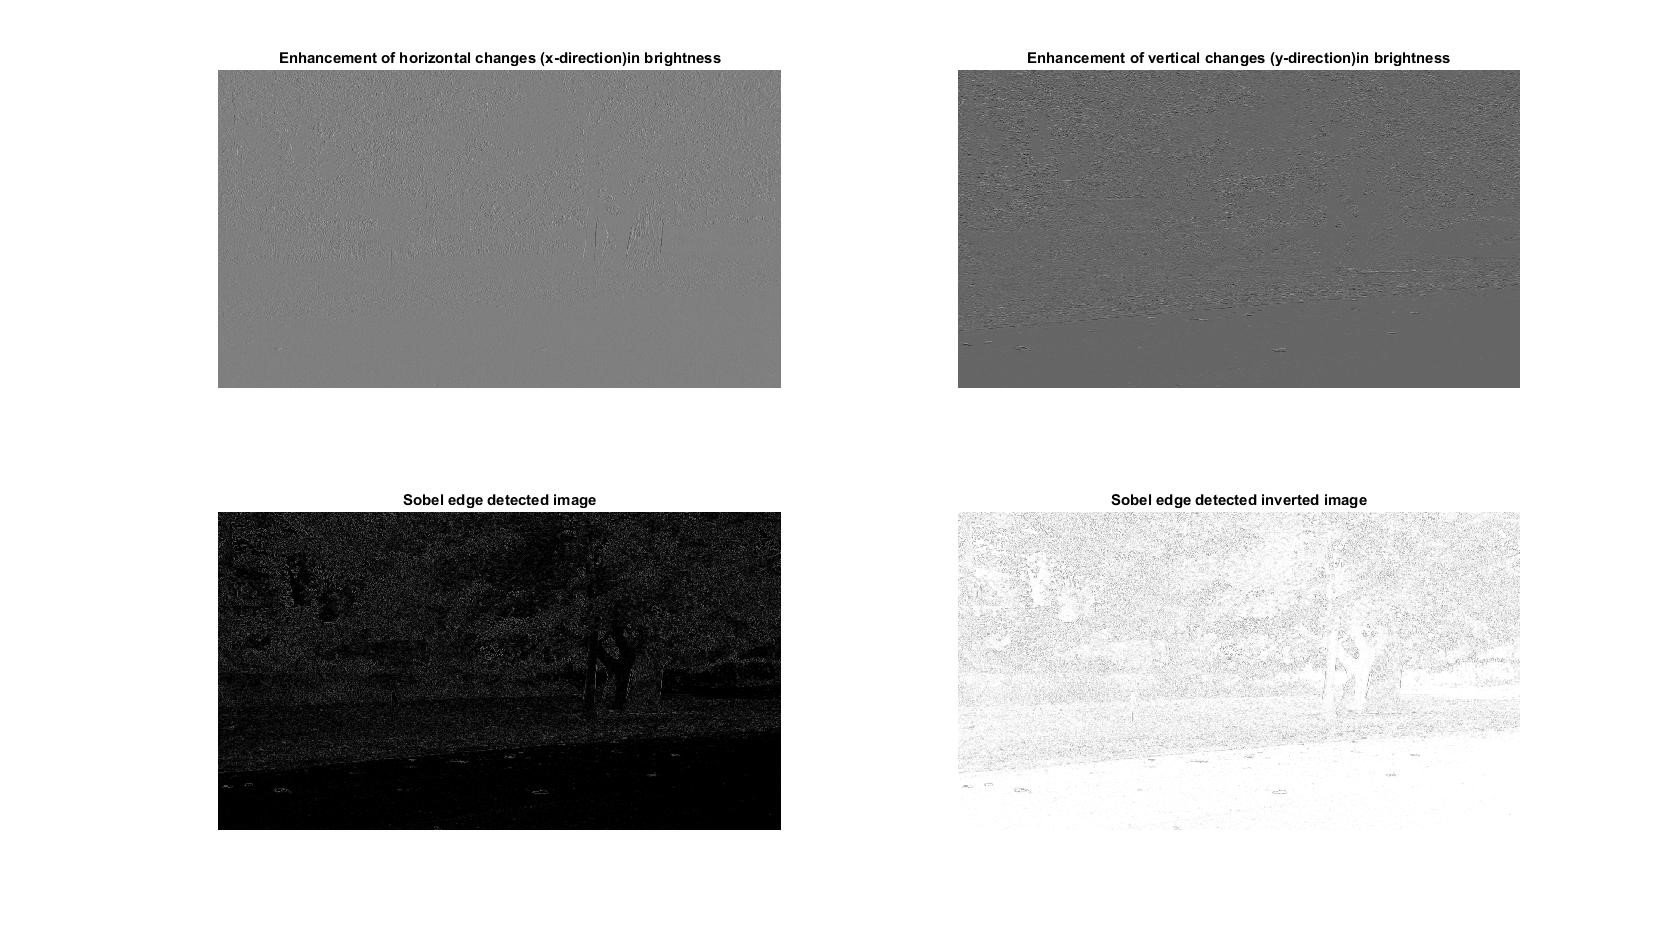 Figure 18. Edge detection of optical image
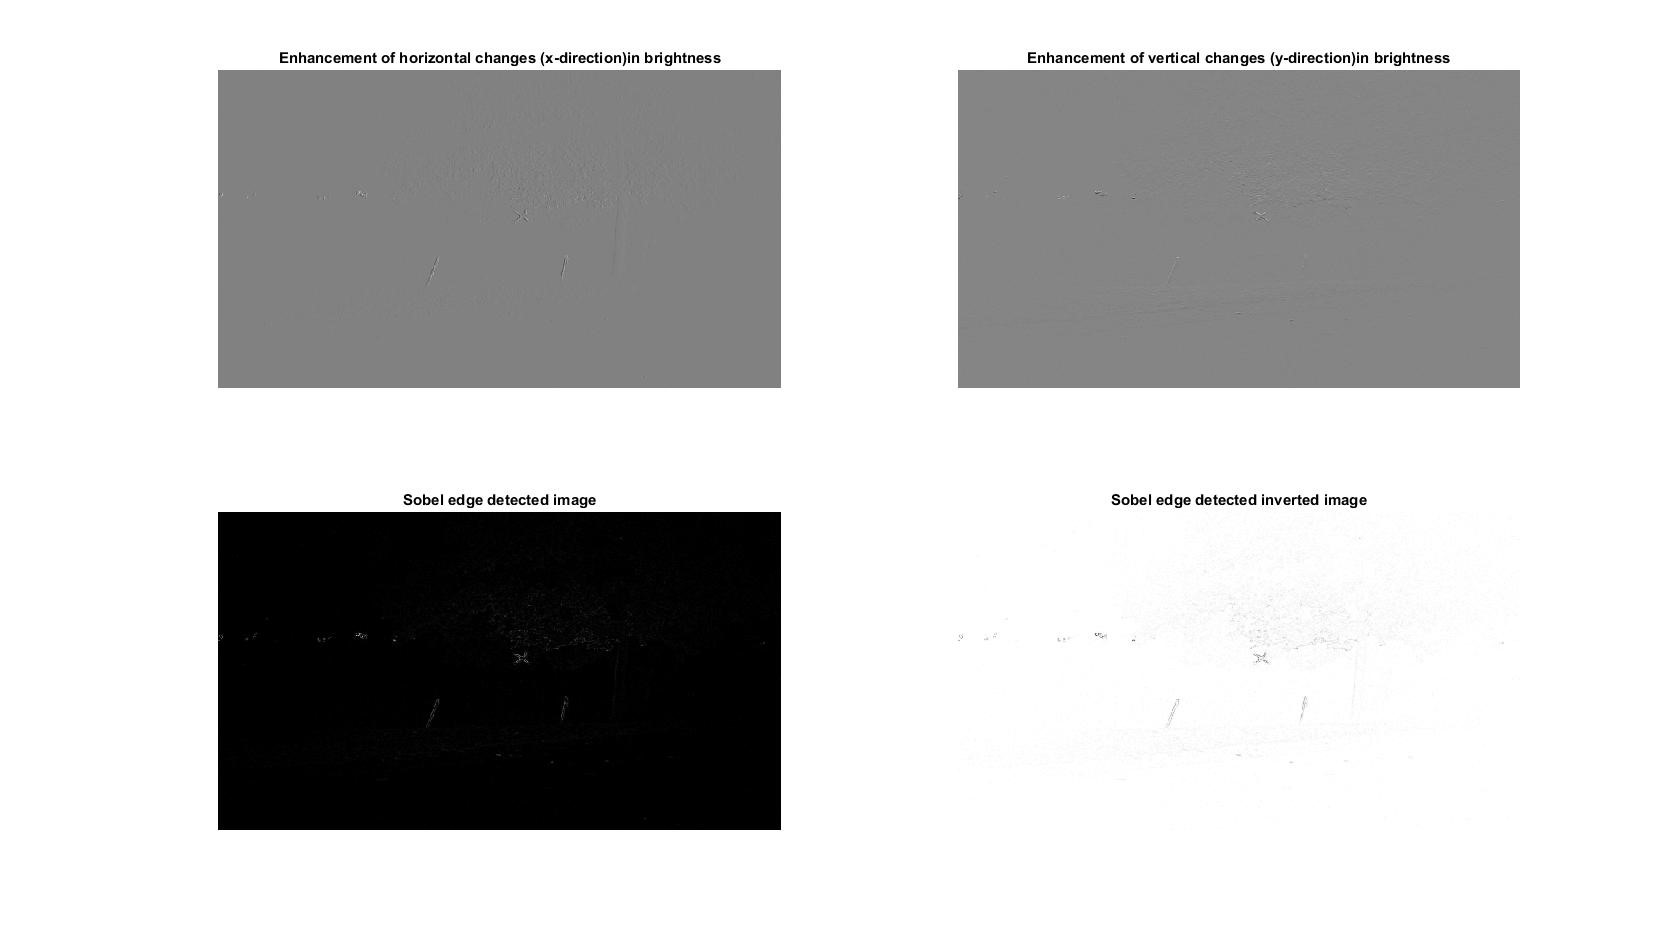 Figure 19. Edge detection of night vision image
The Laplacian operator employs finite difference method in summing up the x-direction and negative (second) derivatives in y-direction expressed as
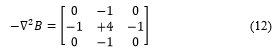 In order to reduce noise by considering all eight neighboring pixels as is the case in the edge detector, the addition in the diagonal components are done to negative Laplacian given by
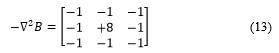 Based on the finite differences, equations 11, 12 and 13 are known as normalized operators for approximating a negative Laplacian operator. The normalization was done in such a way that the average brightness in the image is not shifted. The advantage with the Laplacian operator is that it will cancel the varying brightness however, it makes the image noisier as the random variations are amplified by the operator from pixel to pixel. Moreover, the edge enhancement and the image sharpening are done by adding the output image of the negative Laplacian operator to its original image. Although, it adds noise, the high frequency spatial components are enhanced by image sharpening filter, though the filtered image doesn’t look like the original image. Hence, in this case an unsharp filter can be utilized to improve the sharpness of an original image by adding or subtracting some percentage to the original image.
4.3. Image Sharpening
The digital un-sharp filter is done either by adding or subtracting the Laplacian filtered image to the original or by subtracting the low-pass-filtered image from the original. The image which is added or subtracted to the original in place of the Laplacian image is considered as the high frequency image. Another less noisy approach is the Laplacian of Gaussian (LOG) filter in which first the image is low pass filtered to remove noises and Laplacian is applied. In essence, as the 2D convolution operation of the filter is associative, the LOG smoothing filter result can be used as the 2D FIR filter. The LOG function is given by
![]() where, x and y can vary from -1 to +1 pixel. Assuming σ=0.66, the unshrpen operator is given by
where, x and y can vary from -1 to +1 pixel. Assuming σ=0.66, the unshrpen operator is given by
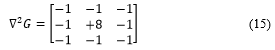
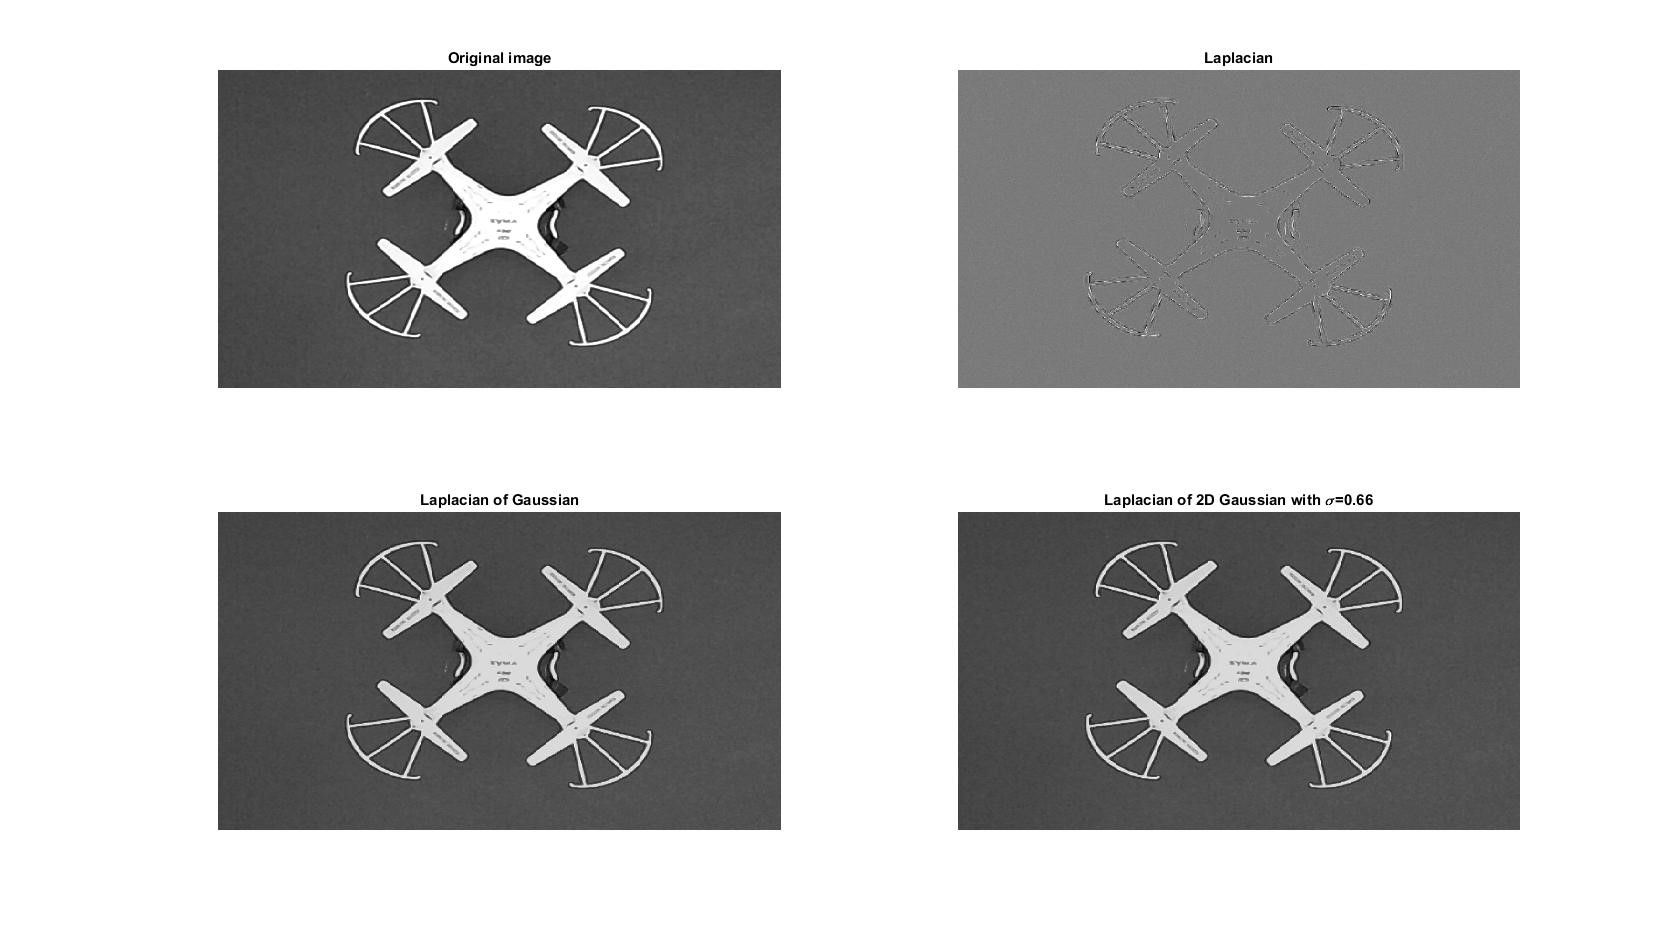 Figure 20. Image enhancement of optical image
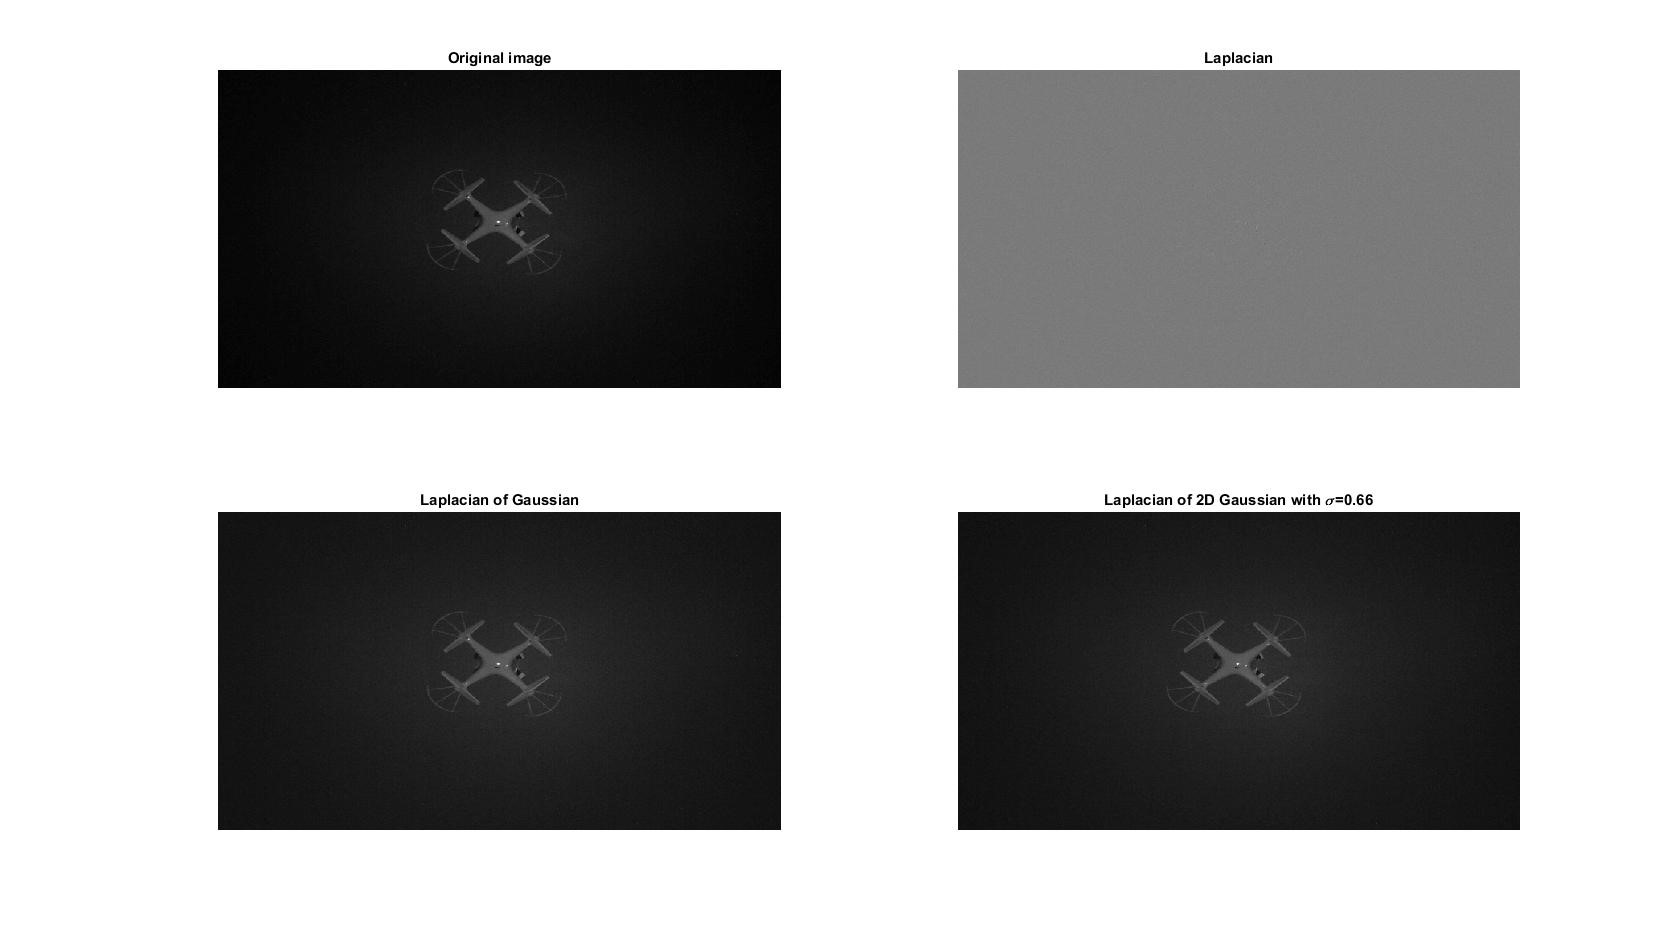 Figure 21. Image enhancement of night vision image
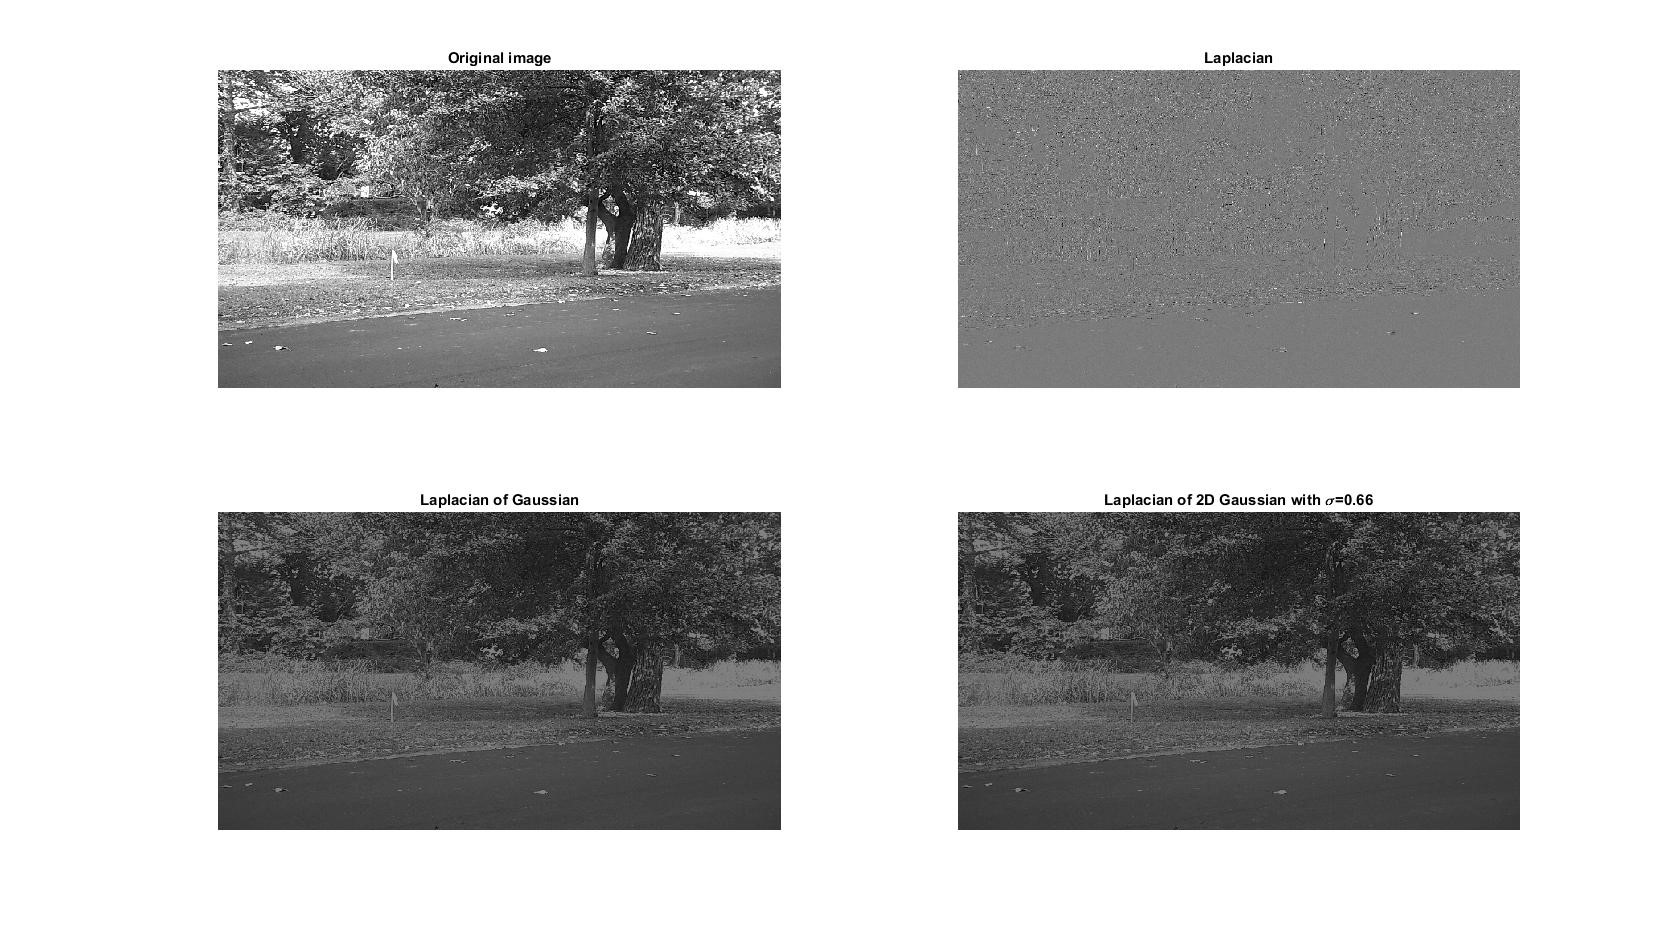 Figure 22. Image enhancement of optical image
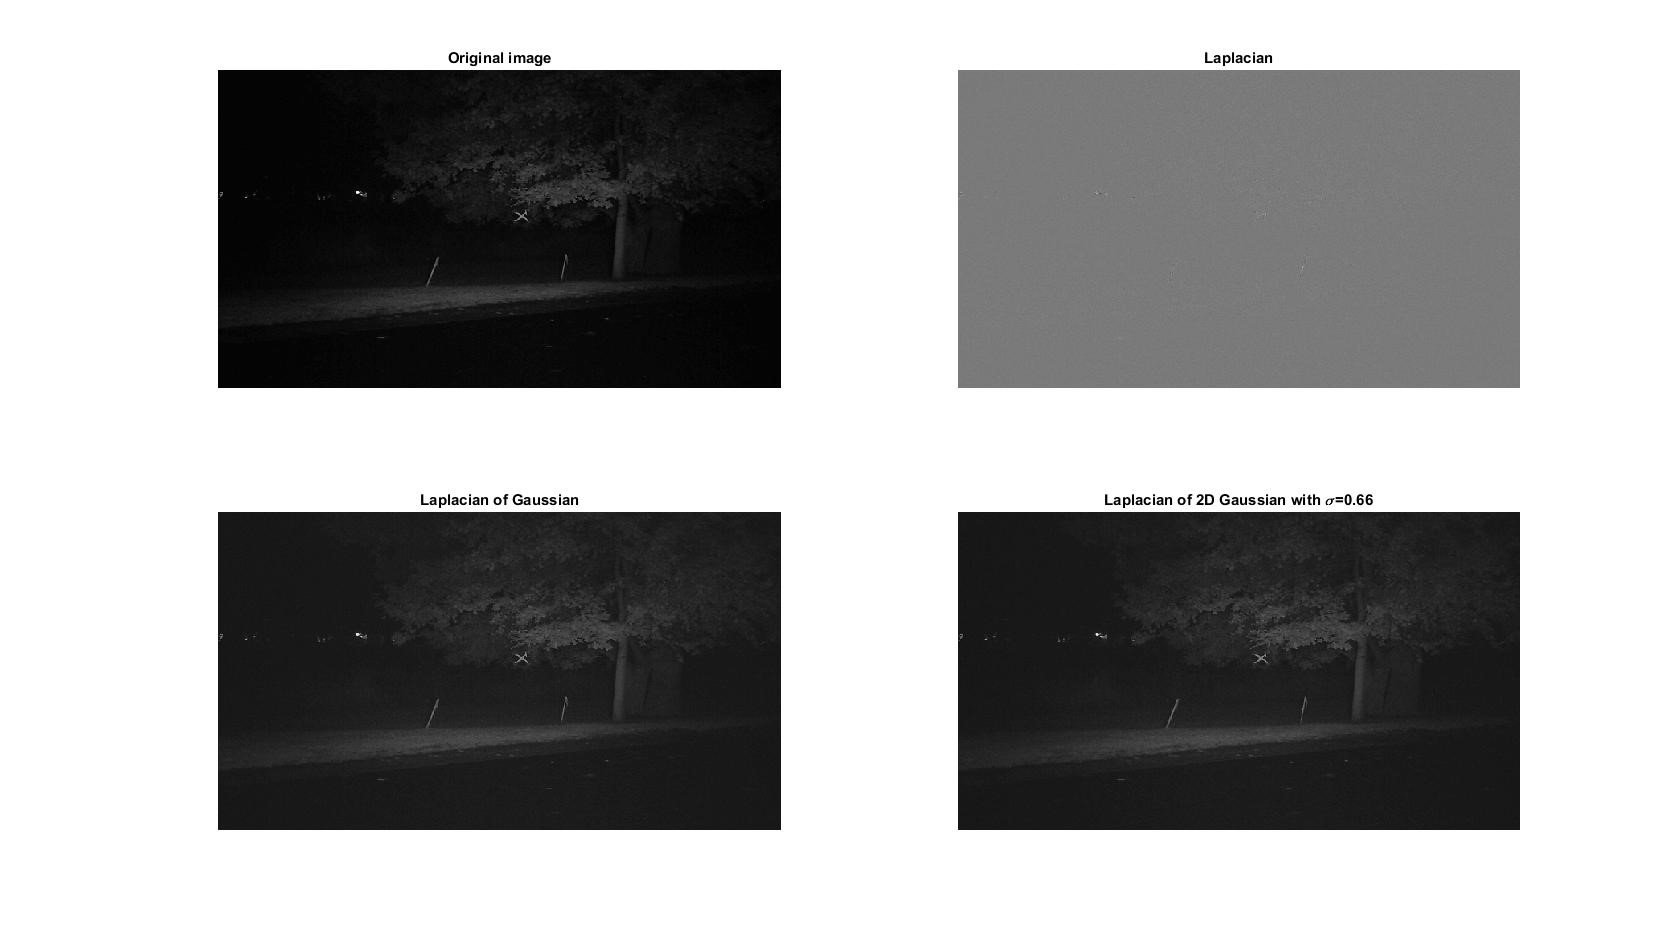 Figure 23. Image enhancement of night vision image
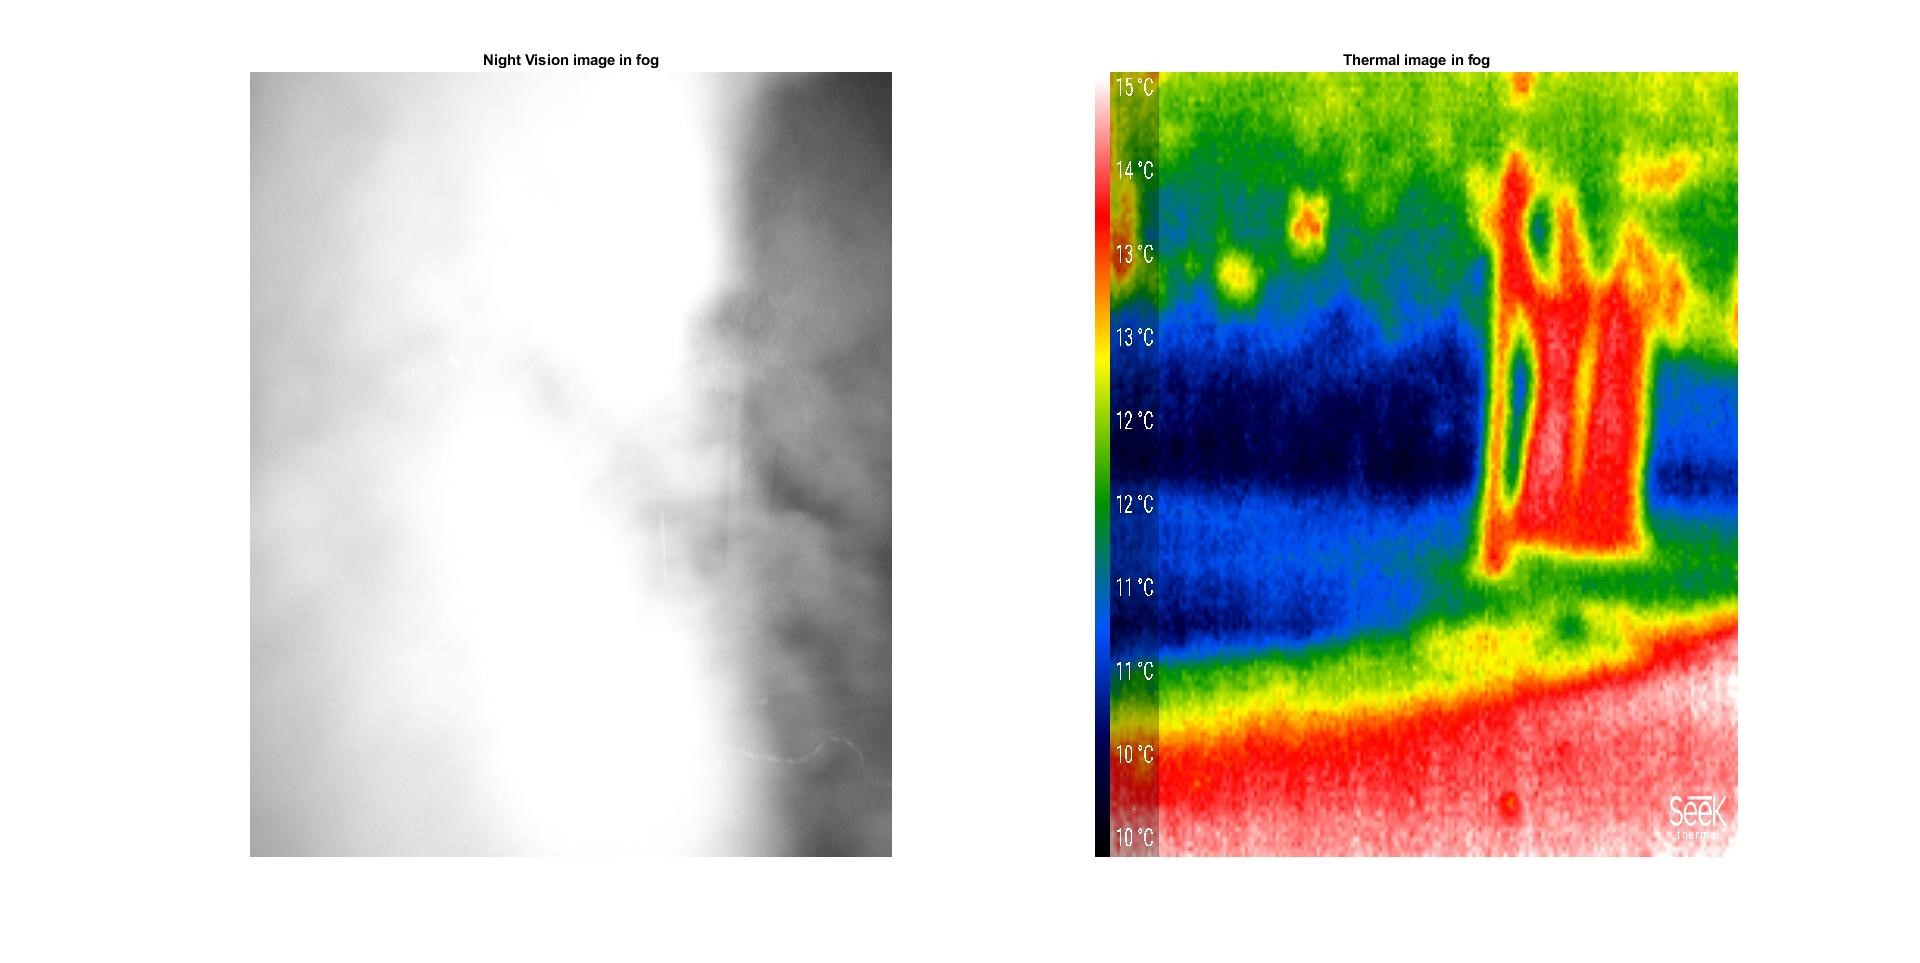 Figure 24. Comparison of night vision and thermal vision in dense fog
Conclusion
This paper deals with the advancement of echolocation bionics and its importance for analyzing and preying upon the target. The mathematical modeling and simulation of bat and its prey is developed upon which the tracking of LOS distance using different state estimators is presented. The RMS error shows the superiority of state estimators for better reconstruction of the signal with less residual. Also, the second half of the paper presents the image processing based techniques to identify the target drone in different places at different environmental situations using multiple sensors. Figure 24 demonstrates the advantages of thermal sensor over digital IR night vision cameras in the midst of fog showing that the thermal sensors can detect the heat signatures, whereas, night vision cannot penetrate through fog.
- R. B. Mahafza, Radar Systems Analysis and Design UsingMATLAB, Chapman& Hall/CRC, 2016.
- B-N. Vo, et al, “Multitarget Tracking”, in Wiley Encyclopedia of Electrical andElectronics Engineering, Wiley, 2015.
- K.Yildiz, “Electronic Attack and Sensor FusionTechniques forBoost-Phase Defense againstMultiple Ballistic Threat Missiles”,Master Thesis, NavalPostgraduate School Monterey, 2005.
- CommandSpaceCereberus Datasheet, www.FLIR.com, FLIR systems Inc., 2015
- C. Miranda, C. J. Baker, and K. D. Woodbridge, “Knowledge-based resource management for multifunction radar”, IEEE Signal Processing Magazine, 23(1), 66-76, 2006.
- R. Joseph, Next Generation Intelligent Radar. 2007 IEEE Radar Conference, 2007, 24(1):7~10.
- Ji Zhang, Yu Liu, “Single Maneuvering Target Tracking in Clutter Based on Multiple Model Algorithm with Gaussian Mixture Reduction”, Journal of Applied Research and Technology, Vol. 11, October 2013.
- David SR Kondru, I Mohan Krishna., “Kalman Filter based Target Tracking for Track While Scan Data Processing”, 2nd IEEE International Conference on Electronics and Communication Systems (ICECS), 2015. Pages: 878 – 883.
- Binbin, CHENG, Research on Bionic Processing for Auto-Adaptive Radar Waveform, [Doctor Thesis], Tsinghua University, 2009.
- CHENG Bin-bin, ZHANG Hai, ZHANG Xiaoping and LI Hesheng, “Bats’ Acoustic Detection System and Echolocation Bionics”, 2012 IEEE Radar Conference,08 June 2012, Atlanta, GA, USA.
- Corcoran AJ, Wagner RD, Conner WE (2013) Optimal Predator Risk Assessment by the Sonar-Jamming Arctiine Moth Bertholdia trigona. PLoS ONE 8(5):e63609. doi: 10.1371/journal.pone.0063609.
- Paul Zarchan., Tactical and Strategic Missile Guidance, AIAA, Vol.239, 2012.
- Andeggs, “3D Spherical Coordinates”, https://en.wikipedia.org/wiki/Spherical_coordinate_system#/media/File: 3D_Spherical.svg, 4th Aug 2009.
- Mohinder S. Grewal and Angus P. Andrews, Kalman filtering theory and practice using MATLAB, 2nd Edition, 2001 Wiley & Sons, Inc
- Robert M. Rogers, Applied Mathematics in Integrated Navigation Systems, AIAA Education Series, July 2000.
- Weisstein, Eric W. “Helix.” MathWorld-A Wolfram Web Resource. http://mathworld.wolfram.com/Helix.html
- N. Shimkin, Estimation and Identification in Dynamical Systems, Lecture Notes, Fall 2009, Department of Electrical Engineering, Technion-Israel Institute of Technology
- Pierre Minvielle, “Decades of Improvements in Re-entry Ballistic Vehicle Tracking”, IEEE Aerospace and Electronic Systems Magazine, Volume 20, Number 8, August 2005.
- David SR Kondru, I Mohan Krishna., “Kalman Filter based Target Tracking for Track While Scan Data Processing”, 2nd IEEE International Conference on Electronics and Communication Systems (ICECS), 2015 Pages: 878 – 883.
- David C. Swanson, Signal Processing for Intelligent Sensor Systems with MATLAB®, pp. 95-101, Second Edition, CRC Press, 2011 Taylor and Francis Group.
- User’s Manual, Digital Camcorder with IR Night Vision, WEILIANTE Co.,Ltd.
- Compact Series User Manual, Seek Thermal, https://www.thermal.com/uploads/1/0/1/3/101388544/compact_series_user_manual-web.pdf