Fuzzy Logic Implementation for Enhanced WCDMA Network Using Selected KPIs

Adv. Sci. Technol. Eng. Syst. J. 4(1), 114–124 (2019);
 DOI: 10.25046/aj040112
The paper focused on the implementation of fuzzy logic technology for improved Wideband Code Division Multiple Access (WCDMA) network using selected Key Performance Indicators (KPIs). Empirical and analytical methods were principally deployed for the study analyses. Empirical analyses were conducted on two designated networks which are MTN and AIRTEL observed with high network traffic to evaluate their network performances using the selected KPIs. Analytical method was further deployed to improve on the observed limited performance. Five (5) geographical locations within Owerri metropolis were selected for the measurements due to the perceived high density from end users; they include Aba road, FUTO road, Onitsha road, Orlu road and Wetheral road. Selected KPIs include Receive Signal Level (RXLEV), Call Setup Success Rate (CSSR), Call Drop Rate (CDR) and Call Completion Success Rate (CCSR) were used to evaluate the various performance characteristics of the networks based on the QoS. Results obtained from the field measurements computed using the selected KPIs could not meet up with any of the Nigeria Communication Commission (NCC) thresholds. A proposed Fuzzy Logic technique was introduced to the system while varying the congestion load characteristics for different environments using the following parameters; mean bit rate, mean burst rate, network statistics and retainability. An average of 10.2% increase in the system throughput was observed from the proposed system over the existing system.
1. Introduction
The discovery of Wideband Code Division Multiple Access (WCDMA) network has provided lots of ease in mobile transactions ranging from voice and data applications to internet surfing and other online operations. The importance attributed to this invention has led to the high demand of the network. In [1], observed the high traffic evident in the network was due to the increased number of subscribers which had contributed to incessant poor quality of service delivery. Due to this high influx of subscribers, the network performance of WCDMA systems began to deteriorate ranging from poor network coverage, constant block/drop calls (Poor call initialization and Handover), call/ network congestion and poor retainability/internet services. Hence, resulted to various degrees of complaints from the subscribers.
Owing to the observations, prompted the need to carry out extensive analysis on the performance of WCDMA network. The study considered basically two prominent networks viz MTN and Airtel in the South Eastern part of Nigeria (Owerri metropolis in Imo State), characterized with greater number of subscribers. Evaluation of their network performances would be achieved in the study using a prominent criterion known as Key Performance Indicators (KPI). KPI is an important tool for network performance evaluation. It is classified as a minimum set of metrics used for tracking system progress towards a performance target [2]. The essential tool for the KPI assessment is the Quality of Service (QoS). Quality of Service is defined as the collective effect of service performance, which determines the degree of satisfaction of a user [3]. Some selected KPI’s for the study include Receive Signal Level (RXLEV), Call Setup Success Rate (CSSR), Drop Call Rate (DCR), and Call Success Rate (CSSR). The Congestion control mechanism was another factor analyzed in the study. Analytical approach was also implemented using intelligent fuzzy logic model to enhance the QoS of WCDMA network using the selected KPI techniques.
2. Literature Review
In [4], compared the performance of various KPIs that were used by the Nigeria Communication Commission (NCC) for rating QoS using drive test approach. The results obtained were used to compare the NCC KPIs target. The outcome showed that virtually all the networks could not meet the NCC target. The works of [5] studied the “compromise between network performance and end user satisfaction over UMTS Radio interface using an empirical investigation in Asaba Delta state”. The KPIs used were CDR, CSSR, HOSR, ESA and NRR. Five clustered ranging from 1-5 were considered in their analyses. Drive test was used to conduct measurements in the cellular network of study. The research work assessed the End User satisfaction by estimating the blocked calls probability (Pblock) and dropped calls probability (Pdrop) data by Psatisfied = 1- Punsatised where Punsatisfied = Pblock + Pdrop. The results obtained from the operators when compared with the NCC performance benchmark only made 20% in cluster 1-3 and 60% in cluster 4-5 respectively, which were generally below expectation and unsatisfactory. The authors of [6] carried out the study on “End-User Satisfaction Assessment Approach for Efficient Network Performance Monitoring in Wireless Communication Systems”. Nontrivial technique for extracting implicit and useful information from existing data sets were implemented. The KPIs used were CSSR, CDR. The results obtained showed that only one operator could meet the NCC threshold at a specified time period. The works of [1], developed software Engineering Approach in Mitigating QoS Challenges in Mobile Communication Networks in Nigeria”. The investigations showed minimal congestion amongst the four network studied. None of the operators met the NCC threshold for HOSR, most of the operators met the NCC target for Call Completion Rate (CCR) and in the overall performance, GLOBACOM was found to be the best. Furthermore, a Software engineering approach was developed for the system optimization. A Congestion Control in Asynchronous Transfer Mode (ATM) Network by [7] was proposed, introducing a KPI parameter (Call Completion Success Rate (CCSR)) into an existing fuzzy logic system to regulate network instability in the ATM network. CCSR was proposed as a parameter indicator which sends signal whenever congestion occurs in the system. The authors observed that if the incoming calls are 75%, the CCSR could send signal to fuzzy policer to retain 30% and allow 45% to pass. On the other hand, when the network is free, it signals the fuzzy policer to allow the number of 30% calls to pass. The introduction of CCSR parameter guaranteed network quality by controlling congestion. It does so by monitoring what happens at the end user or receiver end. And as such ensures that calls are made successfully without distortion. The proposed work of [7] provided a mitigation upgrade due to the introduction of one KPI (CSSR) parameter indicator. Hence, this study traded the approach adopted by the authors of [7] and executed it in WCDMA networks realized using four (4) KPIs viz: RXLEV, CSSR, CDR and CCSR. The selected KPIs were relatively considered to evaluate the levels of congestion in the network.
QoS-Based Key Performance Indicators (KPIs)
Determination of the service quality parameters exposes operators to the following issues [8].
- Detecting probable errors in Base Station Subsystem (BSS) hardware and providing utilization of physical resource
- Taking necessary actions in order to determine radio network problems and to optimize the network; such as frequency assignment, adjusting antenna tilt and changes in some other paramete
- Observing system behaviors and changes in the system; such as traffic load, congestion, and successful attempts.
- Estimating the traffic load and network expansions, in parallel with increasing number of mobile user
- Comparing the network with the competitors and providing better quality user
- Comprehension of the condition of the market and following new technologie
The relationship between QoS and KPIs is shown in Figure 1.
Selected Key Performance Indicators for the study include [9]
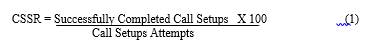
- Call Success Setup Ratio (CSSR): This is ratio of total number of completed calls to the total number of call attempts.
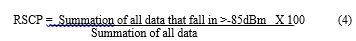
 Call Completion Success Rate (CCSR): This indicator can be derived either from network statistics or from drive test statistics. The indicator takes into account the fact that all failures are either drops or unsuccessful call set ups. It is a good parameter for evaluating the network accessibility and retainability as perceived by the customers. The indicator is derived using the expression:
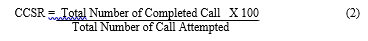
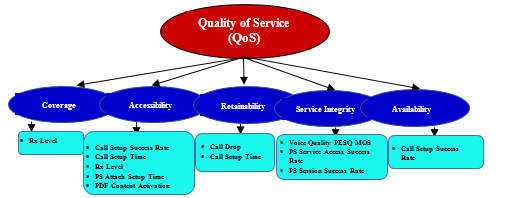 Figure 1 Relationship between QoS and KPIs [8]
Table 1: Threshold for Network performance KPI’s [1, 10]
| Key Performance Indicators | CDR
% |
CSSR
% |
CCSR
% |
CSFR
% |
HOSR
% |
HOFR
% |
RSCP (dBm) | Ec/lo (dBm) |
| NCC Threshold value in % | 2 | 98 | 96 | 4 | 98 | 2 | -85 | -9 |
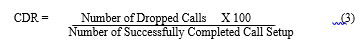
- Call Dropped Rate (CDR) : It is the total number of calls dropped (not ending as desired by the user)or forced call disconnection by the network due to various reasons within the licenses own network.
 Received Signal Level (RXLEV): This is referred to as the received signal level at the input of the mobile device. For WCDMA network it is in RSCP
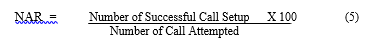
 Network Accessibility Ratio (NAR): This is the probability that a mobile user will establish a successful voice communication between the two ends of the network within a given condition. It is also expressed as the call setup rate. It is represented as:
 Network Retainability Ratio (NRR): It is the ratio between the number of successful calls and number of normally terminated calls. It is also the probability that an active call come to an end successfully in a network.
![]() KPI’s Benchmark for Network Providers by NCC
KPI’s Benchmark for Network Providers by NCC
Table 1 shows some of the Network Performance KPI’s and their percentage threshold levels set by Nigeria Communication Commission (NCC).
3. Methodology
The Empirical Analyses were carried out to ascertain the actual level of Network Performance based on observations and measurements taken from the studied networks end-user perspectives. An Analytical Approach was implemented as a mitigation measure using fuzzy logic technique.
3.1. Outdoor Measurement Analysis
Drive test was used to obtain the call statistics which was also used to calculate the KPI’s. Statistic information of the network was obtained as relevant evaluation parameters for system optimization. The materials/tools used in the research study include Laptop, TEMS Phone(SONY ERRICSSON W995 TEMS POCKET), Data cable, Global Positioning System (GPS), TEMS Investegation Software, MapInfo Professional and MATLAB.
A HP labtop of core i3, 2GB, 500GB was used to install softwares such as MapInfo Professional, and TEMS Investigation used for the simulation analyses.The data cable, Sony Erricson Phone, and GPS were all connected on the the labtop. TEMS Phone: Sony Erricsson W995 Tems Pocket was used. Tems Pocket is a phone-based test tool developed for measuring the performance and quality parameter of wireless networks. The tool collects measurements and event data for network monitoring. TEMS Phone was used to access the services of WCDMA from the end users to the provider. A data cable was used to access the basedband transmission of WCDMA service from the transmitter to the receivers. It was used to connect the Sony Errcson W995 TEMS pocket to the Labtop. The Global Positioning System (GPS) is a network of orbiting satellites that sends precise details of their position in space back to earth. The signals are obtained by GPS receivers, such as navigation devices and are used to calculate the exact position, speed and time at the vehicles location. It was used to determine the position of the mobile station to an accuracy of about 5 meters. TEMS Investegation Software was used to measure, analyze and optimize the mobile networks. It was also used to establish a good knowledge of the availability of the WCDMA network, and features about the quality of service. MapInfo Professional is a geographical information system software that was used for the mapping and location analysis of the network. It enabled us to visualize, analyze, interpret and output the WCDMA network data to reveal the quality of service relationships, pattern and treads. Figure 2 shows the MapInfo Professional. Matlab tool was chosen as a good programming software for the analysis.
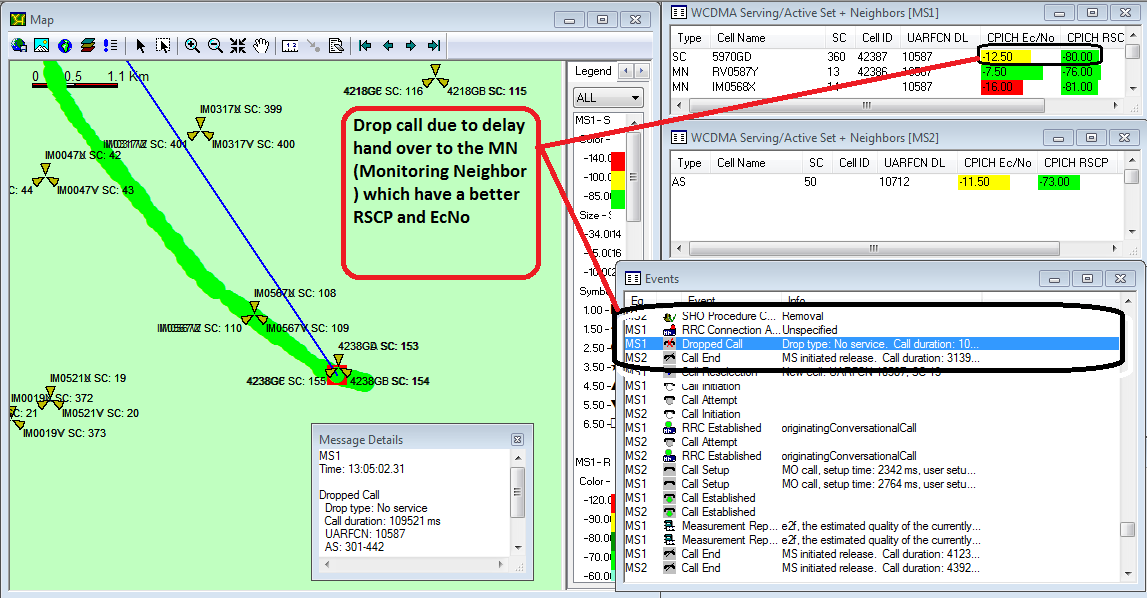 Figure. 2 MapInfo Professional
The flowchart representation of the proposed system is illustrated in Figure 3
3.2. Drive Test Set Up
All the components were connected appropriately to the laptop. The first tool to be connected to the laptop was the dongle which gives a license to the TEMS interface on the system. It should be noted that even though the TEMS interface could be opened without the dongle, a drive test cannot be carried out because the TEMS phone with which calls are made can never be
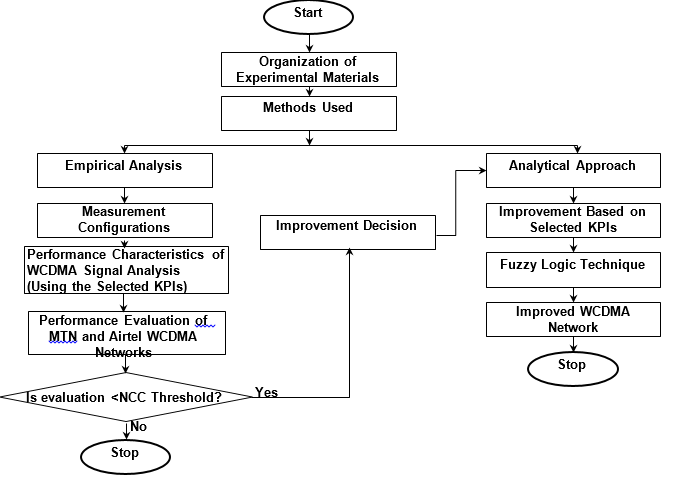 Figure 3 flow chart representation of proposed approach
Table 2: Call summary for MTN network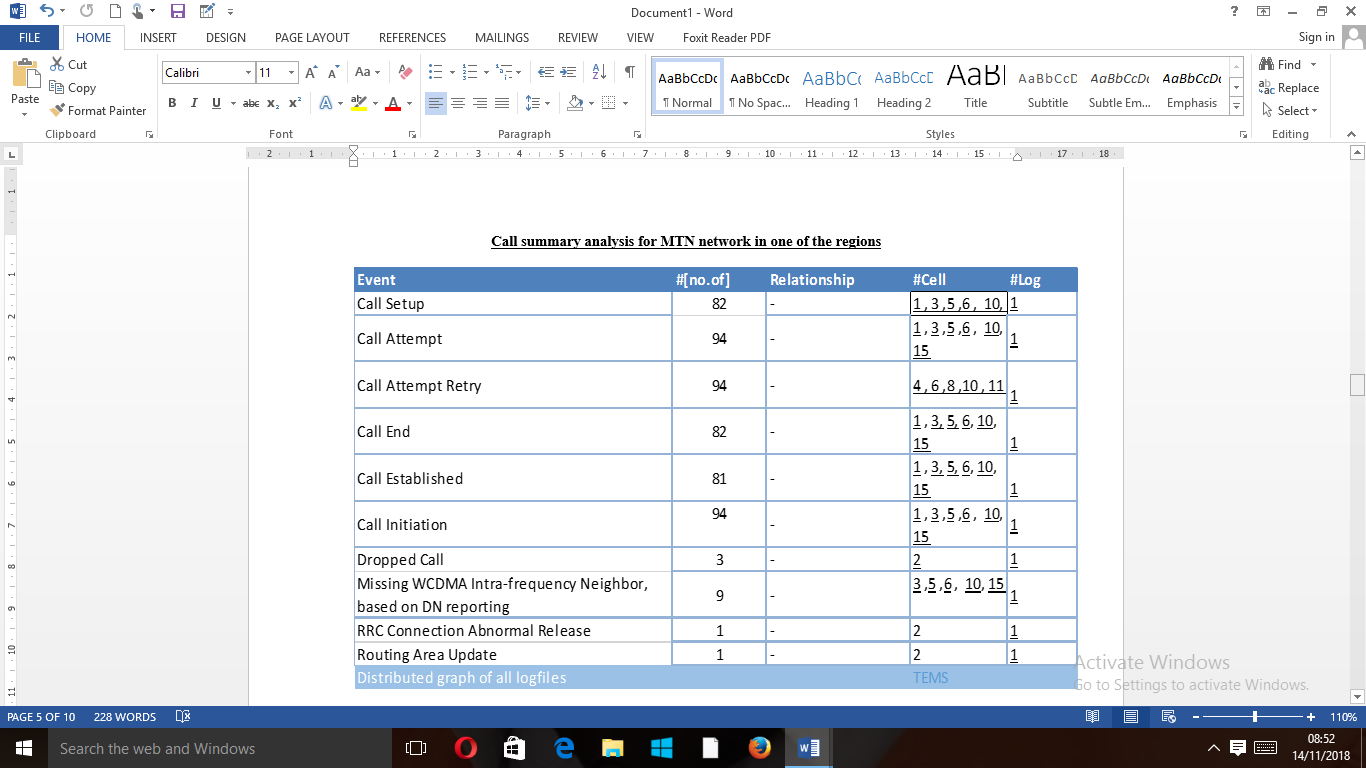
Table 3: Call summary for AIRTEL network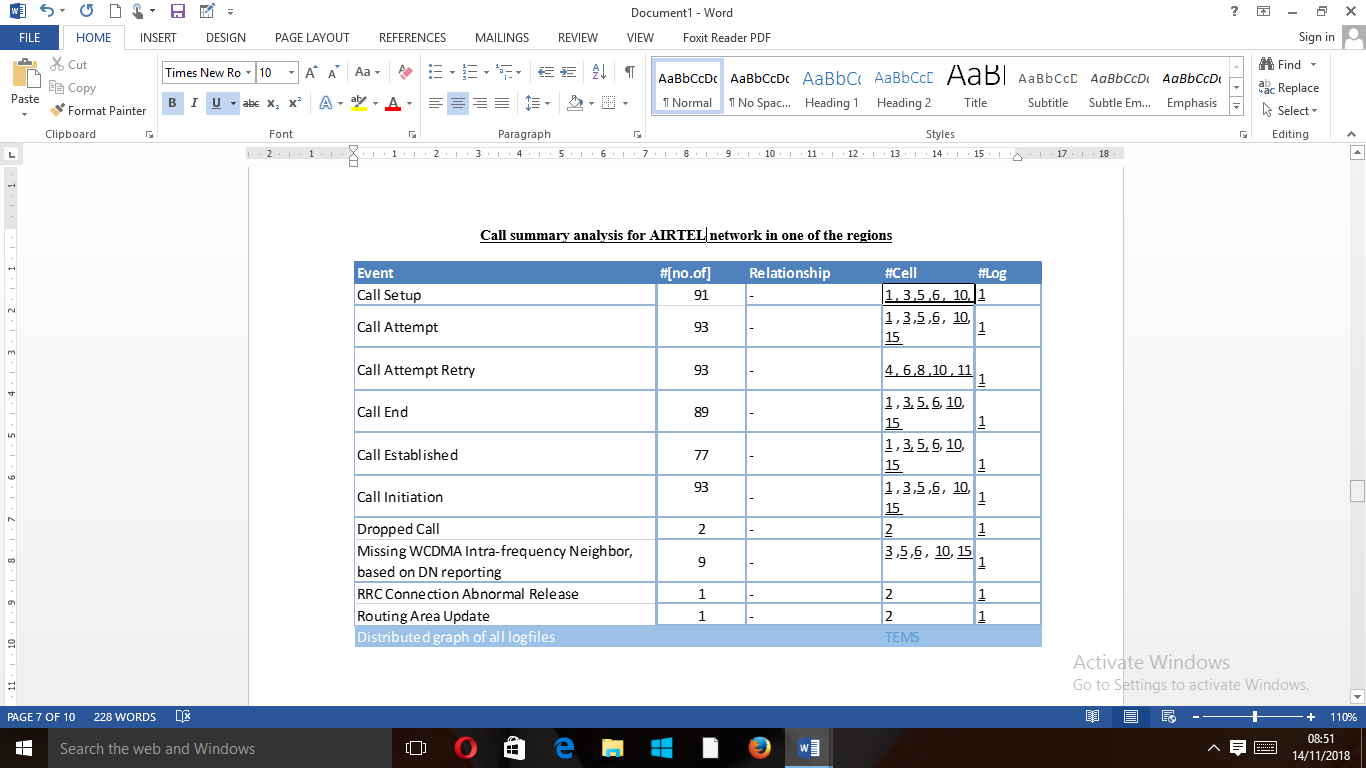
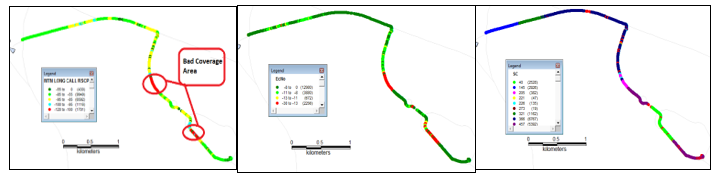 Figure 4: Represent MTN LONG calls on various parameters (RSCP, ECLO and SC)
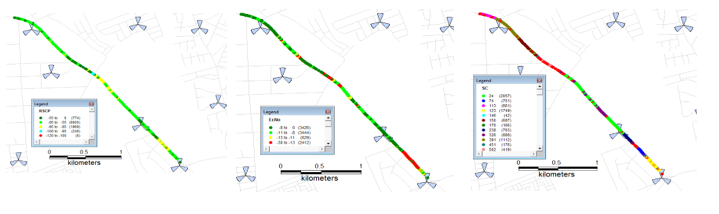 Figure 5: Represent AIRTEL LONG calls on various parameters (RSCP, ECLO and SC)
viewed and accessed. The first step is to power ON the laptop after which the dongle will be connected to it through one of the Universal Serial Bus (USB) ports. The next step requires connecting the TEMS phone through the phone’s USB cable and the GPS. The dongle allows accessibility to these two pieces of equipment. One of the good things about TEMS is the audio capability which helps to quickly detect any disconnected component. This is achieved with the encrypted voice in the TEMS which loudly interprets any of the components that has been disconnected. The laptop is always connected to an inverter which provides constant electricity for the laptop in other to overcome the battery drainage due to the number of connected components. A folder was created where the data will be saved (Log file) during the measurement. Tables 2 and 3 show call summary analyses of MTN and AIRTEL networks conducted in one of the regions while Figures 4 and 5 represent the long calls evaluations obtained from the measurements.
3.3. The System Algorithm
The algorithm for the proposed system are as follow:
Step one: Detect call arrival rate of the system.
Step two: Compute the status of queue bit rate of the system.
Step three: Evaluate the queue capacity of the system with the arrival rate of the incoming calls.
Step four: Estimate the state of the queue burst rate of the network.
Step five: Pass or drop calls using the pass/ drop switch that is regulated by the Fuzzy police.
Step six: Store the drop calls on the buffer storage device.
Step seven: Fuzzy congestion controller coordinates, analyzes and evaluates the performance analysis of the Network and the QoS using KPIs.
The proposed system deployed four KPIs which are RXLEV, CDR, CCSR, and CSSR as shown in figure 6, to be monitored at the receiver’s front end. This helps the policer to make a more robust decision in passing or dropping of calls.
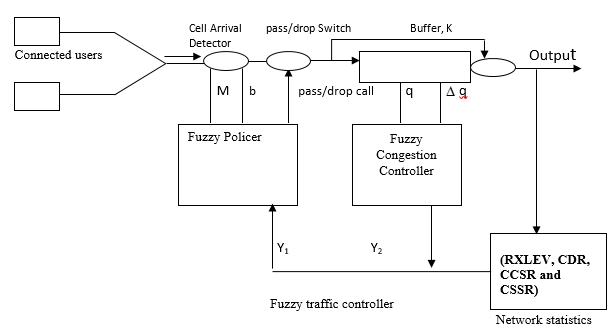 Figure 6 Structural Design of the proposed system
Components of the proposed Fuzzy Logic implemented
- Fuzzy Congestion Controller: The Fuzzy Congestion Controller (FCC) goal is to simultaneously police mean rate and reject bursts while relieving and preventing congestion. Cells are passed or dropped based on an evaluation of conformance to the traffic contract and negotiated traffic parameters.
- Cell arrival detector: The objective of the Fuzzy Police (FP) is to police the mean rate and reject bursts. The Fuzzy Police (FP) performs its job by continuously evaluating the compliance/violation level of two parameters; i.e. the ratio of up-to-date mean bit rate to negotiated mean bit rate and ratio of up-to-date mean burst length to negotiated mean burst length. It then decides on the drop rate to be imposed on the cells based on the collective evaluation of the compliance/violation level of the two parameters.
- Pass/drop switch: This extension provides the Fuzzy Police (FP) with more information thereby enabling it to carry out more accurate decisions on passing or dropping cells.
- Fuzzy Police: The fuzzy police proposed in this study is a window-based control mechanism, in which the maximum number of cells that can be accepted in a specific window of certain length is a threshold that is dynamically updated by inference rules. The fuzzy police’s task is to ensure that the source complies with negotiated mean rate over the duration of the connection.
Fuzzy variable input/output specifications
Fuzzy Input/output Specification for the existing system describes the term sets used to define each input parameter.
Input Specification
The input specifications of the system consists of five-inputs. The input values for the first network controller are as follow:
- ratio of up-to-date mean bit rate to negotiated mean bit rate (Al)
- ratio of up-to-date mean burst length to negotiated burst length (A2)
- State of the network (y):
- Term set for queue length T(q) = { Empty (E), Full (F) }
- Term set for queue-length change rate T(Δq) ={ Negative (N), Positive (P) }
- Term set for rate control T(y) = { Decrease (D), No Change (NC), Increase (I)}
The system outputs are as follow:
- State of the network (y):
- Call Drop (yi). The up-to-date value is calculated by averaging all previous values up to the most current value.
- QoS based on KPIs (y):
Rules Set of Proposed Fuzzy Logic System
Rule one: if Bit rate is complying and burst length is complying and State of network is positive and QoS based on KPIs is positive then drop rate is Pass.
Rule Eighteen: if Bit rate is violate comply and burst length is violate and State of network is Negative and QoS based on KPIs is Negative then Drop rate is Drop.
The proposed flow mechanism is shown in Figure 7.
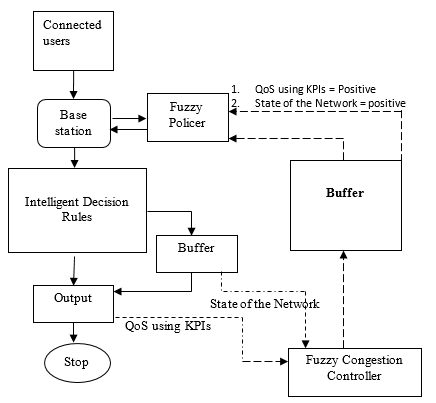 Fig 7: Flow Mechanism of the Proposed Fuzzy Logic System
| Input | Outputs | |||
| Term set for queue length T(q) | Term set for queue-length change rate T(Δq) | State of the network | QoS based on KPIs | Term set T(c)
|
| Empty (E) | Negative (N), | Decrease (DC) | Staying on the network (SN) | Drop |
| Full (F) | Positive (P) | No Change (NC) | Not Staying on the network (NSN) | Between pass and Drop |
| Increase (I) | Pass | |||
Table 4: Fuzzy Input /Output Specifications
The flow mechanism of the proposed system consists of the connected users, Base station, Fuzzy Police, Intelligent Decision Rules, buffer, and the fuzzy congestion controller. The connected users send and receive calls through the base station. The fuzzy police control the incoming calls in the base station. It ensures that the queue capacity in the base station is not exceeded. So it allows some calls to flow through and stores the unpermitted calls to the buffer. After which the cell is free to accommodate more calls, the stored calls in the buffer will be allowed to flow through the network. The fuzzy controller controls the stored calls in the buffer to prevent interference, collision and congestion. It also monitors the call retainability (CCSR, CSSR, CDR, RXLEV) of the system and gives a feedback of what the users are experiencing so that the system re-adjusts itself to correct the problem by adjusting its transmission rate. The retainability is the overall network that indicates if the services are unreliable, reliable or unsatisfied and satisfied.
Table 4 shows the design specification for the system which consists of input and output designs. The Fuzzy input variable used the “term sets” to describe Term set for queue length T(q) = { Empty (E), Full (F) }; Term set for queue-length change rate T(Aq) = { Negative (N), Positive (P)}; The state of the network is represented with term set for rate control T(y) = {Decrease (DC), No Change (NC), Increase (I)}.The forth reused input is represented with the term set for network retainability rate as T(y2)= {Staying on the network (SN) Not Staying on the network (NSN)}.
The output is the membership function for the term set T(c) which are Drop (D), Between Pass & Drop (BPD) and Pass (P). Uncertainty in the network system may result to drop calls, calls between pass & drop and pass all calls. The value for Drop (D) calls will be set to zero for total drop of all calls, BPD set to a value within [0, 1] but closer to 1 for dropping a fraction of cells, and passing all calls set to 1. The simulation parameters are represented in Table 5.
Table 5 Simulation Parameters
| Source Parameters | Packetized Voice |
| Peak rate, P | 32 Kbps |
| Mean rate, m | 11.2Kbps |
| Burst Size, b | 26 cells |
| Silence period, µ | 0.65 S |
| Burstiness, ß | 2.85 |
| Fuzzy Parameters | Values |
| Mean Bit Rate | Range [1 1.5] |
| Mean Burst Length | Range [1 1.5] |
| Network State | Range [-1 1] |
| Call Completion Rate | Range [-1 1] |
| Call Drop Rate | Range [-1 1] |
| Call Setup Success Rate | Range [-1 1] |
| Receive Signal Level | Range [-1 1] |
| Queue Length | Range [0 1] |
| Queue Change Rate | Range [-1 1] |
| Out put | Range [0 1] |
| NumRules | 24 |
4. Results
Figures 8 to 12 represent Bar Charts displayed for comparison of the following: Call completed success rate, Call Setup Success Rate, Call Network Accessibility, Service Retainability, Call Drop Rate along Aba road, FUTO road, Onitsha road, Orlu road, Wetheral road respectively and the NCC threshold.
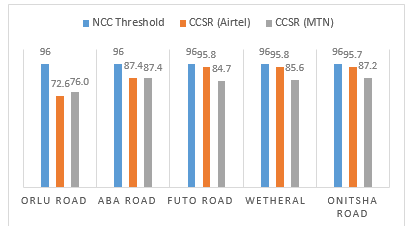 Figure 8 Bar Chart for comparison of call completed success
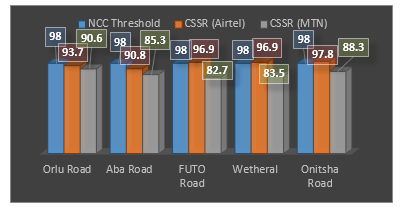 Figure 9 Bar chart representation of benchmarking of Call Setup Success Rate
The results obtained from the analyses of the drive test on the Received Signal Coded Power of the designated networks is shown in Table 6. Figure 13 illustrated the percentage coverage reliability of the RSCP.
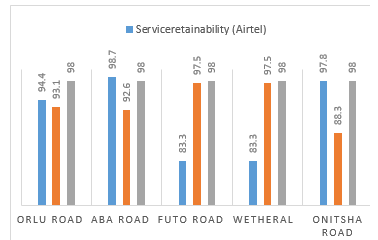 Figure 10 Bar chart representation of MTN and Airtel Call Network Accessibility
The summary result for network drive test conducted on the designated paths on coverage quality of service is shown in Table 7. Figure 14 demonstrated a graphical view of the system performance relative to the NCC threshold
4.1. Simulation Results Using Fuzzy Technique
A simulation was carried out to analyze the performance of the proposed Fuzzy Policer (FP) and Fuzzy Congestion Controller (FCC) in policing and controlling traffic flow within Virtual Channel Connections (VCCs) passing through a network node. The simulation interface of the proposed system is shown in Figure 15(a) and (b).
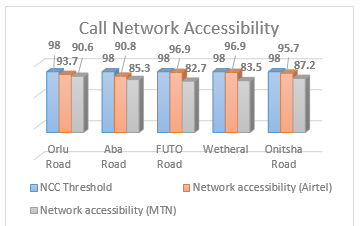 Figure 11 Bar chart representation of MTN and Airtel Service retainability
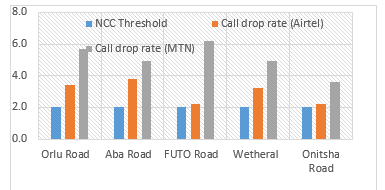 Figure 12 Bar chart representation of MTN and Airtel Dropped Call Rates
Table 6: Drive test results of the two WCDMA networks on the Received Signal Coded Power.
| Orlu Road | Aba Road | FUTO Road | Wetheral Road | Onitsha Road | ||||||
| Ranges (dBm) | MTN | Airtel | MTN | Airtel | MTN | Airtel | MTN | Airtel | MTN | Airtel |
| (-55 to 0) | 2.5 | 2.2 | 3.8 | 2.0 | 1.1 | 2.2 | 1.9 | 1.3 | 3.9 | 2.8 |
| (-85 to -55) | 44.9 | 35.4 | 46.2 | 33.9 | 25.1 | 31.6 | 45.3 | 38.9 | 34.9 | 44.1 |
| (-95 to -85) | 2.6 | 19.1 | 0.0 | 13.5 | 16.7 | 19.8 | 2.4 | 9.8 | 9.9 | 3.1 |
| (-100 to -95) | 0.0 | 0.9 | 0.0 | 0.6 | 2.8 | 2.7 | 0.4 | 0.0 | 1.3 | 0.0 |
| (-120 to -100) | 0.0 | 0.0 | 0.0 | 0.0 | 4.3 | 0.0 | 0.0 | 0.0 | 0.0 | 0.0 |
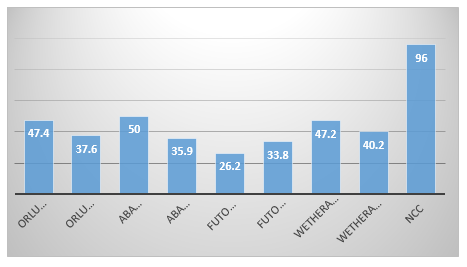 Figure 13 Bar chart of WCDMA Network coverage reliability of RSCP (%)
Table 7 Coverage Quality of Service for WCDMA Networks.
| Orlu Road | Aba Road | FUTO Road | Wetheral Road | Onitsha Road | ||||||
| Ranges (dBm) | MTN | Airtel | MTN | Airtel | MTN | Airtel | MTN | Airtel | MTN | Airtel |
| (-8 to 0) | 9.0 | 6.5 | 6.5 | 5.8 | 33.5 | 33.8 | 45.8 | 9.9 | 15.2 | 3.0 |
| (-11 to -8) | 32.7 | 45.6 | 24.2 | 51.3 | 39.3 | 46.1 | 28.8 | 32.3 | 32.8 | 22.4 |
| (-13 to-11 ) | 43.5 | 28.3 | 24.5 | 27.2 | 25.9 | 18.0 | 22.4 | 55.1 | 27.0 | 28.8 |
| (-20 to -13) | 14.8 | 19.5 | 44.8 | 15.6 | 1.4 | 2.1 | 3.0 | 2.6 | 25.0 | 45.8 |
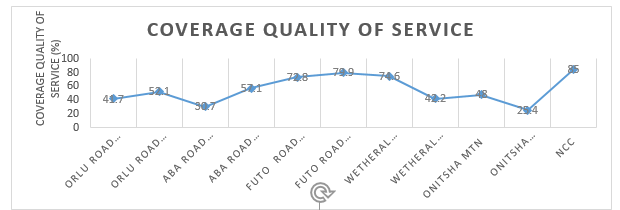 Figure 14 Coverage Quality of Service for WCDMA for MTN and Airtel Networks with the NCC benchmark.
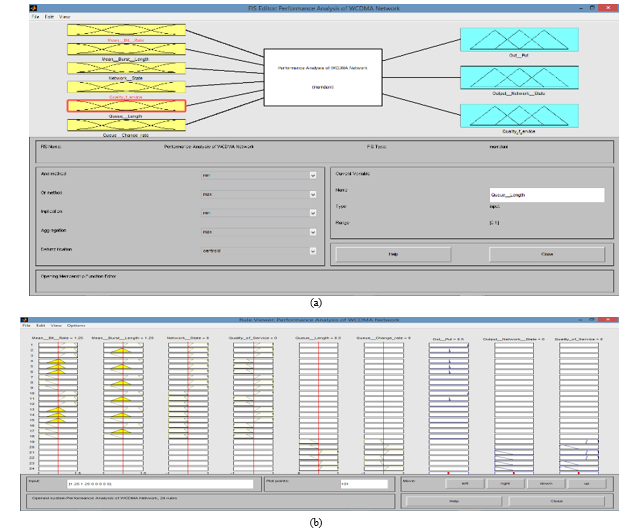 Figure 15 the Simulation Interface
Testing was conducted on the proposed system by experimenting its ability to handle some variations of mean bit rate and violation of mean burst size at all stages of its congestion load environments.
4.2. Comparison of the performance characteristics of the improved WCDMA signals using MATLAB tools.
From Table 8, the congestion load environments of the existing system and the output is shown while Table 9 shows the congestion load environments of the proposed system and the output. We implemented the same values (mean bit rate, mean burst length, network statistics and retainability) obtained in the conventional system, the output variations was actualized from the increased number of the input KPI parameters. The proposed system was compared with the existing system as represented in Figure 16. Figure 17 demonstrated the control surface of the fuzzy logic design system, showing the system axis dimensions: the system output, the mean burst rate and the mean bit rate.
Table 8 shows the congestion load environments for existing system [7]
| Traffic load environments | Mean_Bit_Rate | Mean_Burst_L | Network_S | Retianability | OUT_PUT Of the Existing System |
| congestion load environment 1 | 1.1 | 1.1 | 0.8989 | 0.9 | 0.5 |
| congestion load environment 2 | 1.2 | 1.2 | 0.819 | 0.9222 | 0.5 |
| congestion load environment 3 | 1.3 | 1.3 | 0.819 | 0.9222 | 0.761 |
| congestion load environment 4 | 1.4 | 1.4 | 0.94 | 0.9222 | 0.99 |
| congestion load environment 5 | 1.4 | 1.4 | 0.819 | -0.0333 | 0.5 |
Table 9 shows the congestion load environments for proposed system
| Traffic load environments | Mean_Bit_Rate | Mean_Burst_L | Network_S | Retianability | OUT_PUT
Of proposed System |
| congestion load environment 1 | 1.1 | 1.1 | 0.8989 | 0.9 | 0.63 |
| congestion load environment 2 | 1.2 | 1.2 | 0.819 | 0.9222 | 0.69 |
| congestion load environment 3 | 1.3 | 1.3 | 0.819 | 0.9222 | 0.831 |
| congestion load environment 4 | 1.4 | 1.4 | 0.94 | 0.9222 | 0.99 |
| congestion load environment 5 | 1.4 | 1.4 | 0.819 | -0.0333 | 0.62 |
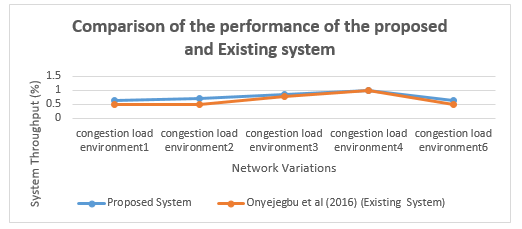 Figure 16 The proposed and existing systems comparison on congestion control efficiency.
4.3. Discussions
Table 6 presented the results obtained for the Received Signal Coded Power of the MTN and Airtel networks along the selected geographical regions. The ranges (dBm) -55 to 0 and -85 to -55 indicated very good and good signal strengths, while -95 to -85, -100 to -95, and -120 to -100 indicated fair, poor, and very poor signal strengths respectively. The addition of the signal strengths between the ranges gave the value of Coverage Reliability of the networks. The result showed that the coverage Reliability of MTN and Airtel networks are below the NCC targeted values refer to Figure 13. Also, the Coverage Quality of Service for the two networks shown in Table 7 indicated that the signal strengths obtained are below the NCC targeted values as illustrated in Figure 14.
The linguistic inputs (Mean bit Rate, Mean burst Length, Network state, QoS based KPIs, queue length and queue change rate) of the proposed system was fuzzified. The inference mechanism of the fuzzy policer in the network structure extracts the fuzzified inputs to coordinate the flow of calls and ensures that the capacity of the queue length in the base station are not violated using proposed rule base. Efficient management of the queue capacity within the structured network could prevent congestion problems in the network. The fuzzy traffic controller was proposed to ensure concurrent monitoring of the state of the network in the buffer and call retainability of the users. It communicates to the Fuzzy policer for efficient management of quality service delivery of the WCDMA network. The outputs of the system were defuzzified based on the appropriate decision making of the intelligent system. Tables 8 and 9 represented the congestion load environments for the existing and proposed systems while Figure 16 compared the congestion control efficiency. The proposed system demonstrated adequate congestion control improvement relative to the conventional system with better potentials to adjust the queue capacity within the Nodes ones there is evidenced network instability.
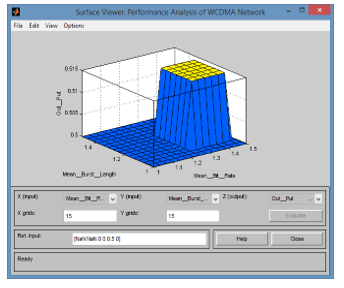 Figure 17 The control surface for the fuzzy logic system
5. Conclusion
The study was geared towards developing an improved technique to reduce the high level of network congestions observed in 3G wireless networks within Owerri metropolis. The research deployed an optimized fuzzy logic structured with some input parameters such as cell arrival detector, pass/drop switch, buffer, fuzzy policer, fuzzy congestion controller. Selected KPIs such as RXLEV, CDR, CCSR and CSSR were also introduced in the proposed system. Empirical analyses were conducted for adequate evaluation of the present operational conditions of the designated (MTN and AIRTEL) networks observed with high network traffic density within the selected regions. The Selected KPIs were used to evaluate the state-of-the-art conditions of the networks and compared it with the standard specified by the Nigerian Communication Commission (NCC). It was observed that none of the parametric values obtained from the KPIs met the NCC threshold which established the degraded nature of the networks. Analytical scheme known as fuzzy logic technique was introduced to proffer mitigation on the adverse existing congestion challenges. A conceptual framework was adopted from the literature which had similar featured characteristics but was limited with the number of KPIs introduced. The existing work failed to take into cognizance of the fact that congestion could affect other KPIs. The proposed Fuzzy Logic system featured with four KPIs was introduced to the system while varying the congestion load characteristics using the following parameters; mean bit rate, mean burst length, network statistics and retainability. Average of 10.2% increase in the system throughput was obtained from the proposed system over the conventional system, which provided a significant improvement relative to the system congestion. The study had shown its prominence as to the need to ascertain the actual levels of quality of services provided to the end users. Meanwhile, the incorporation of the approach could enable the network providers to dynamically tackle the issue of network congestion.
- Ugwuoke, F. N., Okafor , K. C., Onwusuru, I. M., & Udeze, C. C. “Using Software Engineering approach in mitigation QoS challenges in Mobile Communication Network in Nigeria”. Computing Information Systems Development Informatics & Allied Research Journal, 15(1), 131-148, 2014.
- Telecommunication management; Key Performance Indicators for UMTS and GSM (KPI). 3 GPP TS 32.410 0, 9.0, 2009.
- Terms and Definitions Related to Qualityof Service and Network Performance Including Dependability. ITU-T Rec. E.800, 1993.
- Ozovehe, A., & Usman, A. U. “Performance Analysis of GSM Networks in Minna metropolis of Nigeria”. Nigeria Journal of Technology, 34(2), 359-367, 2015.
- Atenuga, M., & Isabona, J. “On the compromise between network performance and End-User satisfication over UMTS Radio interface: An Empirical Investigation”. International Journal of Advance Research in Physical Science, 1(8), 9-18, 2014.
- Isabona, J., & Ekpenyong, M. “End-User satisfaction Assessment Approach for efficient network performance monitoring in wireless communication systems”. Africa Journal of computing & ICT, 8(1), 1-18, 2015.
- Onyejegbu, L. N., & Okafor, N. R. “Congestion control in Asynchronous Transfer mode”. International Journal in Computer Application, 142(4), 11-15, 2016.
- Kaidioglu, R. “Performance benchmarking of cellular network operators in Turkey”. Graduate School of Natural and Applied Sciences of ATILIM University Turkey, Electrical and Electronic Engineering, 2010.
- Speech and Multi Ttransmission Quality (STQ); QoS aspects for popular srevices in mobile networks; part 1: Assessment of Quality of Service. ETSI TS 102 250-1, 2.2.1 ,2011.
- Ononiwu, G., Akinwole, B., Agubor, C., & Onojo, J. “Performance Evaluation of Major Mobile network operators in Owerri metropolis of Nigeria”. International Journal of Engineering Technologies in Computational and Applied Sciences, 18(1),06-13, 2016.