Photodecoloration of Methyl Orange Solution Assisted by ZrS3 Powders
 , Anastassiia Poltarak 1, 2, Pavel Poltarak 1, 2, Igor Asanov 1, Vladimir Fedorov 1, 2
Adv. Sci. Technol. Eng. Syst. J. 4(1), 165–170 (2019);
 DOI: 10.25046/aj040116
Zirconium trisulfide ZrS3 is a representative of transition metal polysulfides containing sulfur as S–1 in polysulfide, usually disulfide S22– groups. Semiconductive zirconium trisulfide which absorbs visible light near UV edge was considered as a possible photocatalyst. We experimentally studied photodecoloration of methyl orange in presence of ZrS3. It was shown for the first time that crystalline ZrS3 strongly deepens photodegradation reaction, and in one case the methylene orange conversion reached almost 100%. The rates of degradation curves were associated with the ZrS3 samples morphology; the best result revealed for microribbons ZrS3 synthesized at 650°C.
1. Introduction
Transition metal sulfides are well-known class of inorganic compounds. The very popular representatives CdS, MoS2 and some others are considered as materials for luminescence [1], photocatalysis [2], piezoelectric materials [3], anodic components for lithium batteries [4], etc. [5].
The distinctive feature of transition metal polysulfides (TMP) is a polysulfide group which is usually a disulfide group (S2)2– coordinated to metal atoms. For instance, crystalline VS4 [6], NbS3 [7], TiS3 [8], as well as amorphous MoS3 [9], MoS4 and WS5 [10] include disulfide (S2)2– groups along with sulfide anions S2– coordinated to metal atoms. Like layered transition metal disulfides, TMP also possess low-dimensional structures (layered – crystalline trisulfides, chained – crystalline VS4, amorphous CrS3, MoS3, etc. – presumably chained).
Zirconium trisulfide ZrS3 is a typical representative of layered transition metal trisulfides. The crystal structure of ZrS3 (attributed to ZrSe3 structural type [8]) (Fig. 1) comprise double layers whose surfaces are produced by disulfide groups (S2)2–. Particularly, a basic structural fragment prism {ZrS6/2}, is constructed from two disulfide (S‒S)2‒ groups as well as two sulfide groups S2‒, the Zr atom is situated near the center of the prism (Fig. 1). Such prisms {ZrS6/2} with metal atoms situated close to the prism centers are connected to each other via common triangle bases to form infinite columns which are oriented along b axis. Additionally, these columns are connected to the neighboring ones forming layers two prisms thick. The infinite layers are bind to the neighboring via van der Waals S…S contacts. Hence the layered zirconium trisulfide may be described by ionic model Zr4+(S2)2–S2–.
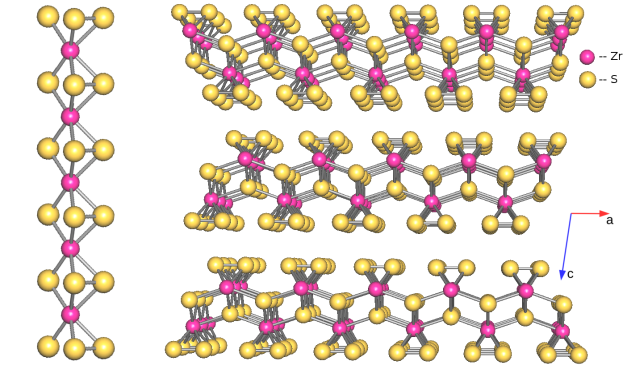 Figure 1: Structure of the wedge-shaped columns (left) within one polymeric layer and arrangement of the layers (right) in the crystal structure of triclinic ZrS3
Presence of the disulfide group introduces new chemical properties which could be useful in known physico-chemical processes required in modern industry. Sulfur in the disulfide group is charged as –1, so it can be oxidized or reduced [11] in 1-electron ox-red processes, so these systems can be considered as electron reservoirs [12]. This property can meet an application in high capacity alkaline batteries [4], [13]. In the ionic model approximation, trisulfides MS3 (M = Ti, Zr, Hf) are d0-complexes, a diamagnetic semiconductors. The semiconductor band gaps of the trisulfides MS3 (M = Ti, Zr, Hf) were optically defined (1.8, 2.0, and 2.2 eV, respectively), and were recently examined as cathodes in hydrogen evaluation reaction [14]. In addition, ZrS3 nanomaterial was used as efficient anode for catalytic oxygen evaluation reaction in both alkaline and neutral aqueous solutions [15].
Photocatalytic degradation of organic molecules is an actual theme now, and it becomes more popular once renewable energy source is used (solar irradiation); the nature of substrates is dictated by polluting agents in natural waters and soils. Semiconductor photocatalysis is an important option for solar energy conversion and pollutant degradation according to the idea of green chemistry. For purposes of degradation of the pollutants, a known set of catalysts is already designed [16]: double layered hydroxides [17], titanium dioxide [18], composites based on TiO2 [19], other oxides (ZnO [20], WO3 [21]), composites with oxides [22-24, 25, 26], as well as composites with MoS2 [27-29].
Many transition metal di- and polysulfides are dark or metal black in color. A pair of “colored exceptions” can be distinguished here, ZrS3 and HfS3, which are orange and dark red, respectively. According to study [30], these compounds absorb visible light in near UV region, so we decided to examine ZrS3 compound as photocatalyst in a model reaction of methyl orange degradation. Shifting from transition metal disulfides (MoS2, WS2) to transition metal trisulfides as photocatalyst is something new in the present work.
2. Experimental
2.1. Materials
Zirconium powder 99% and crystalline sulfur 99.9% (Acros), were used for synthesis of ZrS3 samples; TiO2 Degussa P25 (Degussa AG, Germany), methyl orange (Reakhim, Russia) and distilled water were used for carrying out photodecolorization experiments.
2.2. Syntheses of zirconium trisulfide at different temperatures
ZrS3 was obtained by heating a stoichiometric mixture of Zr and S. Mixtures of powder zirconium (4.868 g 0.05336 mol) and crystalline sulfur (5.132 g 0.1601 mol) were evacuated in three quartz ampules (about 20 ml volume) and sealed. The syntheses were carried out at temperatures 350, 500, and 650°C for 150 hours (up to these temperatures, the ampoules were heated for 15 h). The ampules were cooled down with the furnace. The products were thin powders different shades of red-orange. The products were heated in dynamic vacuum at 200°C during 1 h in order to remove elementary sulfur after syntheses.
2.3. Methods and apparatus
X-ray powder diffraction patterns for solids including exfoliated samples were collected with a Philips PW 1830/1710 automated diffractometer (Cu Kα radiation, graphite monochromator, silicon plate as an external standard). Raman spectra were recorded with a LabRam HR Revolution (Horiba Scientific) instrument at wavelength 488nm. UV spectra were recorded with an Agilent Cary 60 Spectrophotometer in the range of 200 – 800 nm. Eppendorf Centrifuge 5430 equipped with container for 15 and 50 ml tubes used for centrifugation of the reactive mixtures. Scanning electron microscopy (SEM) images were collected with Hitachi S3400N instrument.
X-ray photoelectron spectroscopy (XPS) measurements were carried out on a Specs Phoibos-150 spectrometer with an Al Kα monochromatic excitation. The pass energy of an electron analyzer was set at 20 eV. For the compensation of a charging effect from non-conductive samples, a low energy electron beam was applied. Binding energies were measured from the C1s level (285.0 eV) of surface hydrocarbon contaminations. Relative atomic concentrations are calculated from the measured areas of spectra taking into account photoionization cross-sections, inelastic mean free paths and the transmission function of the spectrometer.
The Brunauer–Emmett–Teller (BET) surface areas were determined by N2 adsorption 5-point measurements in pressure range p/p0 = 0.05–0.25 using SORBTOMETER-M surface area analyzer. The ZrS3 powder samples were preliminary heated at 200°C during 1 hour in nitrogen flow.
2.4. Photo discoloration experiment
The photocatalytic activity of ZrS3 powders was evaluated by standard decoloration reaction of dye methyl orange (MO). The reactor for the decoloration experiments consisted of a cylindrical beaker on a magnetic stirrer, with a common LH9-U/BLB/G23 black light lamp (Camelion). Experimental conditions for methyl orange (MO) decoloration on powders were: aqueous solution of MO with initial concentration 0.022 mM, amount of ZrS3 powder 0.175 g/L (14 mg per each experiment), and UV irradiation time was kept constant for 2-3 hours. The aqueous suspensions were stirred throughout the experiment. In the experiment, to 80 ml of aqueous solution of MO (C = 0.022 mM) 14 mg of ZrS3 powder was added, and mixed during 3 hours excluding irradiation of any light (for dark sorption). At the stage of dark sorption several points were documented in the following way: 1 ml of suspension was collected from the solution with Pasteur pipette, centrifuged with acceleration 3000 g for 10 min for removal of ZrS3 solid, the transparent solution decanted, and the UV-Vis spectrum in region 200-800 nm written for the solution. After 3 hours of dark sorption a lamp was turned on above the tested mixture and every 15 min points were examined in the same way. Three series of experiments were carried out, each series three times: using powder samples of ZrS3 synthesized at 350 (ZrS3-350), 500 (ZrS3-500), and 650°C (ZrS3-650). Graphics of MO absorbance vs time of irradiation were built for comparison.
2.5. Photo discoloration experiment with Degussa P25
The experiment with Degussa P25® was carried out in similar way, using the same experimental setup. The portion of powder Degussa P25 was 14 mg per every degradation experiment.
After the experiments the photocatalysts were washed with 20 ml of water, centrifuged and decanted, and then washed with 20 ml of ethanol. After these operations the solids were dried in air. They were examined by XRD and Raman spectroscopy, as well as XPS for ZrS3-650.
3. Results and discussion
3.1. Initial powder ZrS3 samples
Zirconium trisulfide samples were synthesized from the elements in evacuated quartz ampules at different temperatures according to reaction which is rather common for synthesis of transition metal trichalcogenides [31, 32]:
Zr + 3S → ZrS3 (T = 350, 500, 650°C).
The yields were quantitative or near-quantitative. Preliminary EDS tests revealed a quantity of elementary sulfur in the products, so we heated the ZrS3 samples in dynamic vacuum in order to remove elementary sulfur. The products were thin powders, red-orange in color (red for ZrS3-350, yellow-orange for ZrS3-500 and ZrS3-650). Powder diffraction patterns (XRD) revealed only monoclinic ZrS3 phase (ICSD 42-073) as crystalline product of reaction in the cases of temperatures 500 and 650°C (Fig. 2). Positions of some observable reflections were as follows: 2θ 9.97° (001), 20.01° (002), 35.45° (200), 40.55° (004), 43.59° (211), 50.42° (020), 62.99° (006). Small quantity of unreacted metal zirconium was found in ZrS3-350 (2θ 36.6°). Coherent scattering domain size (CSDS) calculated by Scherrer formula [33] (applied to 001 reflection) from the powder patterns gave 14, 29, and 77 Å for ZrS3-350, ZrS3-500, and ZrS3-650, respectively. So, we noticed here that rise in temperature of synthesis enhances the crystalline ordering of the samples ZrS3. The Raman spectra of the ZrS3 samples were very close to each other, and the vibration bands Ag 148 cm–1 (150 cm–1 from [34]), 276 (280), 317 (322), 525 (530) cm–1 were agree with the literature data, the 525 (530) cm–1 band testifies presence of (S–S)2– groups in the samples.
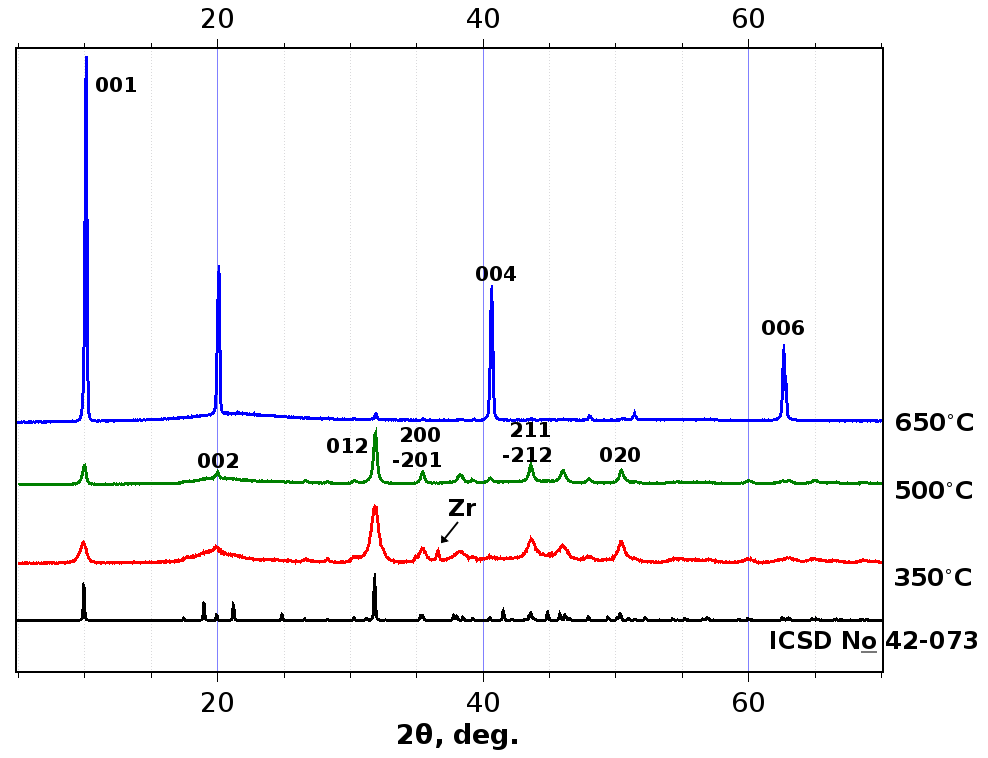 Figure 2: X-ray powder diffraction patterns for crystalline samples ZrS3-350 (red line), ZrS3-500 (green line), and ZrS3-650°C (blue line), and theory calculated XRD pattern for ZrS3 (black line)
EDS data for the prepared ZrS3 samples showed rather low content of sulfur (Zr : S ratios were from 2.2 to 2.4), so we considered that the materials demonstrated mainly surface stoichiometry which could include some deal of oxides also. These data contradicted with the XRD data where clear crystalline monoclinic ZrS3 phase occurred. In order to define the exact Zr : S ratios in these samples, we carried out gravimetric experiments: carefully weighed ZrS3 samples were put into pre-weighed crucibles and heated in a muffle furnace at 600°C during 20 hours. The products of calcination in the crucibles were weighed, and the quantity of sulfur was calculated using mass difference according to the equation:
ZrSx + (1+x)O2 = ZrO2 + xSO2.
After weighing the calcination products, they were examined by X-ray powder diffraction in order to make sure that ZrO2 (gravimetric form) were the only calcination product. It was found that the bulk material ZrS3-350 was ZrS2.56, ZrS3-500 was ZrS2.76, and ZrS3-650 was ZrS2.76. So we concluded from this data that the ZrS3 samples synthesized from stoichiometric mixtures of Zr and S are monoclinic ZrS3 albeit possess remarkable deficiency in sulfur.
Probably our ZrS3 samples have such a sulfur deficiency due to synthetic procedure: only 3 equivalents of S were taken for reaction per one equivalent of Zr. Crystals of zirconium trisulfide with formulae very close to ZrS3 are synthesized in gas-transport reactions with some excess of sulfur [35], longer heating, or the stoichiometric mixture which was heated at higher temperature (1000°C) [35], or applied transport species (for example, bromine) [36].
SEM images of the powder ZrS3 samples revealed different morphologies (Fig. 3). ZrS3-350 sample is aggregates of lamellar slabs about 5μm size; ZrS3-500 sample is a mixture of particles of two types: aggregates of lamellar slabs ca. 5μm size and fibers up to 20 μm long; ZrS3-650 sample is ribbons 0.5-1 μm width and ca. 20μm long. Visible texturing is observed for ZrS3-650 sample (Fig. 2): apparently, the preferred orientation of the ribbons is layering in parallel to their wide side.
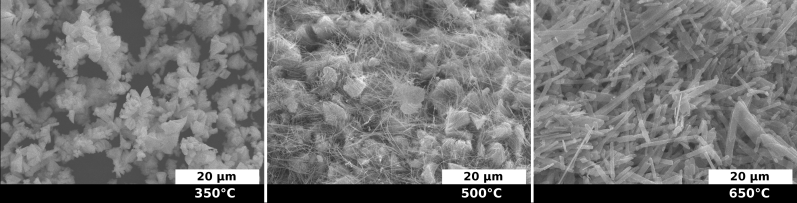 Figure 3: SEM images of powder samples synthesized at ZrS3-350 (a), ZrS3-500 (b), and ZrS3-650 (c)
Strong dependence of the BET surface areas on the ZrS3 morphology (min BET 9 m2/g for ZrS3-650, Table 1) indicates that the lamellar slab aggregates make the main contribution to the surface area: BET of the samples ZrS3-350 and ZrS3-500 having components of such morphology, are noticeably higher (49 and 24 m2/g, respectively). Degree of dark sorption correlated with the surface area values: the percentage of absorbed MO on ZrS3 powders increased while increasing their BET in series ZrS3-650 < ZrS3-500 < ZrS3-350. The minimal dark adsorption of ZrS3-650 is in agreement with the maximal CSDS value, 77 Å, and the minimal BET surface.
3.2. Photodecoloration of MO in presence of ZrS3 powders
ZrS3 powders were used as photocatalysts for decomposing of dye molecule MO for the first time (Fig. 4). ZrS3 powders were used as synthesized. Photocatalytic activity of ZrS3 was evaluated in terms of the degradation of MO aqueous solution under UV irradiation. The efficiency of the dye degradation was calculated based on the changes in absorption of MO in UV-Vis spectra. At the lamp irradiation, MO didn’t decolorate in absence of ZrS3.
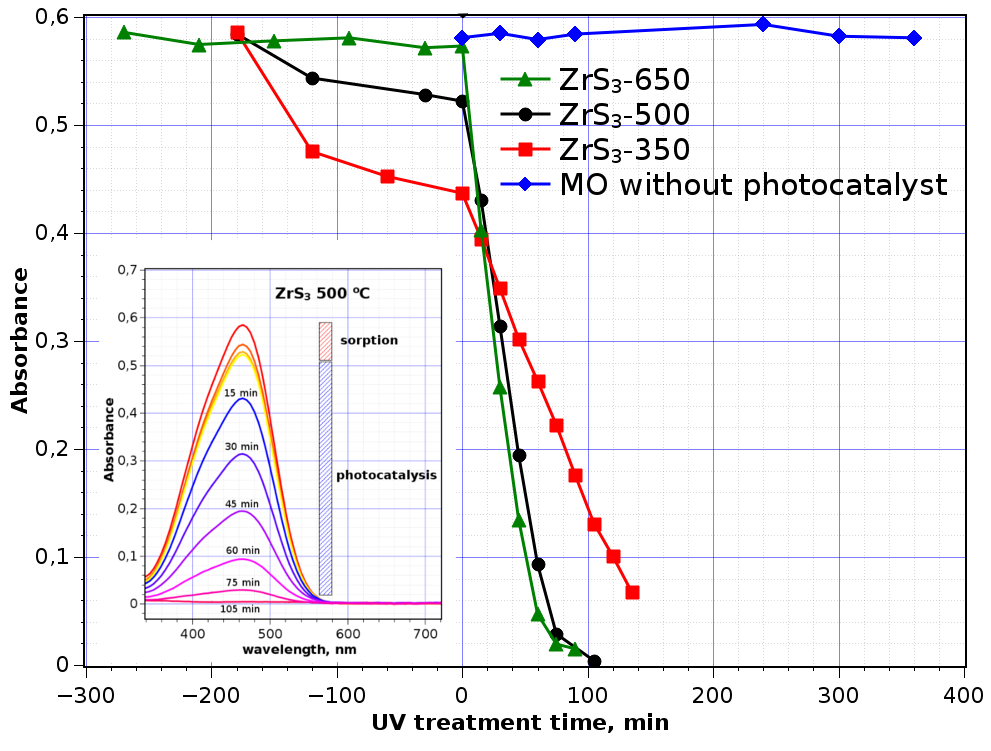 Figure 4: Dependence of MO absorbance in the presence of ZrS3 vs time of UV irradiation exposure. Systematic errors of measurement are from minimum three experiments for each ZrS3 sample
From the UV-Vis spectroscopy data (Fig. 4, inset) one can see that MO absorbs on ZrS3 particles in the cases ZrS3-350 and ZrS3-500 in the dark phase whereas presence of ZrS3-650 decreases MO concentration to a lesser degree. After start of the irradiation, the concentration of MO in the reaction mixture was decreased noticeably, that indicated start of MO photodegradation.
The decoloration dependencies vs time of irradiation are averaged from at least three experiments, and the standard deviations of the data points not exceed 5% from absorbance values at time starting UV treatment (t = 0 min).
Table 1: Some parameters of the decoloration process in presence of different ZrS3 crystalline samples
| Crystalline ZrS3 sample | ZrS3-350°C | ZrS3-500°C | ZrS3-650°C |
| Coherent scattering domain size (CSDS), Å | 14 | 29 | 77 |
| BET surface area, m2/g | 49 | 24 | 9 |
| Adsorption of MO in “dark” time, % | 26 | 11 | 2.2 |
| Time of irradiation at 50% degradation of MO (0.022mM), min | 48 | 36 | 27 |
| Time of irradiation at 90% degradation of MO (0.022mM), min | 144 | 71 | 59 |
| Time of irradiation at 50% degradation of MO (0.022mM) in presence of TiO2 Degussa P25, min | 138 |
At the initial concentration of МО in aqueous solution 0.022 М, photodegradation time was confined by two hours. The longest MO degradation process concerns to ZrS3-350 sample, 140 min with 90% of the initial MO amount. The photodegradation dependences have linear character at least for the first 60 min, for ZrS3-500 and ZrS3-650 they are very close while the line for ZrS3-350 has gentler slope, and doesn’t demonstrate complete degradation of MO in 140 min of the experiment.
One can see ZrS3-650 is the most efficient sample from the three. The reason of this may be the minimal dark sorption, so the sample surface is better accessible for dissolved oxygen; ZrS3-650 also possesses larger size of coherent scattering domain (77Å) that allows hoping to have more regular surface of the particles. The MO degradation results obtained are comparable with MO degradation results in the presence of MoS2 of two morphologies: nanorods and nanoflowers [37].
3.3. Characterization of ZrS3 powders after the photodecoloration experiments
After the photodegradation experiments, ZrS3 powder samples retained their structural identity (XRD for ZrS3-650 is presented in Fig. 5). None of crystalline ZrO2 phases were detected in the XRD patterns. Raman spectra of ZrS3 after the decoloration experiments revealed ZrS3 spectra which were very similar to each other: 105, 119, 146, 239, 275, 316, 357, 523 cm–1. These bands are in good accordance with the literature data: 107, 120, 148, 241, 277, 317, 355, 525 cm–1 [38]. We didn’t find in the Raman spectra band respected to amorphous ZrO2 (148, 263, 476 cm–1) as in [39].
The analysis of XPS data before and after the photocatalytic experiments for ZrS3-650 as critical sample, revealed certain differences. In the initial powder sample ZrS3-650 (Fig. 6), the atomic concentration ratio S/Zr was 2.78. S2p spectrum contained two doublets from S22– and S2– with positions of S2p3/2 components at 162.6 and 161.6 eV, respectively; the ratio of their intensities was 1.78. The values of bond energies were well agreed with the literature data [40]. Spectrum Zr3d5/2, 3/2 also contains two doublets with spin-orbital splitting 2.4 eV. The Zr3d5/2 components were situated at 181.2 and 182.9 eV with intensity ratio 9:1. The first component belonged to zirconium in ZrS3 while the second might be associated with an oxide phase on surface of the ZrS3 particles [41]. The composition of the surface sulfide phase may be thereby formulated as Zr0.9(S2)0.89S.
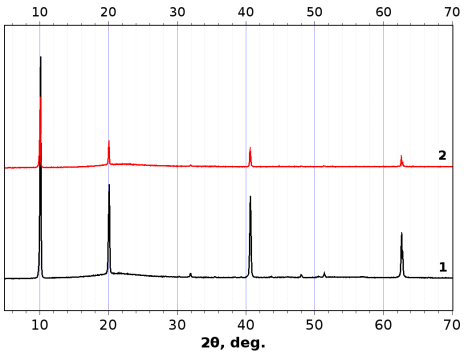 Figure 5: XRD patterns of ZrS3-650 before (line 1) and after (line 2) photodegradation MO experiment
In the sample ZrS3-650 after the photodegradation experiment, weak peaks in the region 168.0 eV appeared in S2p3/2 spectrum that corresponds to sulfate groups on the surface. Component corresponding to an oxide phase, strongly arose in the Zr3d5/2, 3/2 spectrum. These data indicate the oxidation of the ZrS3 particles surface after photocatalysis experiment.
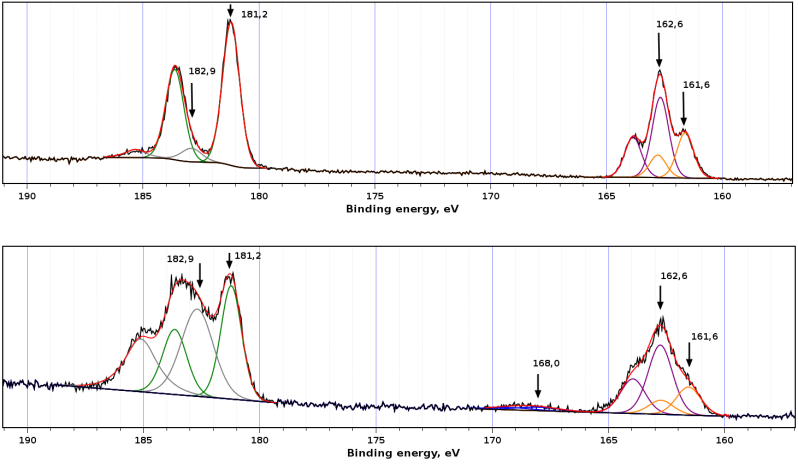 Figure 6: XPS data for ZrS3-650 powder sample, as-synthesized (upper graphic) and after photocatalysis experiment (lower graphic)
3.4. Comparison with Degussa P25
We carried out photocatalytic experiment with Degussa P25 using the same experimental setup in order to compare photocatalytic ability of ZrS3 with the international reference TiO2 (TiO2, 80% anatase and 20% rutile). 14 mg of Degussa P25 in 80 ml of 0.022 mM MO solution was used for the experiment. As a result of experiment in our setup, MO decolorated in presence of Degussa P25 at 50% in 138 min. Although kinetics of MO decoloration was faster for ZrS3-650 than for Degussa P25 here, we discussed here only the first cycle of decoloration. Additional studies are required to test ZrS3 powders in series of decoloration cycles, and examination of the catalysts after the experiments.
The preliminary experiment on photodegradation of MO in aqueous solution in presence of powder ZrS3 opens way to design of new light-sensitive materials for photocatalysis and other applications. Some additional studies are to carry out in order to realize the mechanism and other characteristics of the photodegradation observed. Authors believe that photosensitive properties of ZrS3 (and probably some another transition metal trisulfides) may be enhanced by different ways (crystal or surface modification, assembly in composites) to obtain new materials for photocatalysis.
4.Conclusion
Zirconium trisulfide revealed appreciable photocatalytic ability in dye molecules decoloration, on the example of methyl orange decoloration for the first time. The surface of the photocatalyst increases the content of oxide phase after the degradation reaction. It was ascertained that the photocatalytic behavior of ZrS3 is dependent on its morphology, which in turn is dependent on temperature of synthesis of ZrS3. Based on qualitative level results, ZrS3-containing species are considered as perspective materials for photocatalysis.
Conflict of Interest
The authors declare no conflict of interest.
Acknowledgment
This work was financially supported by Russian Science Foundation (grant RSCF 13-14-00674). Authors are grateful to Dr. Eugeny Maksimovsky for collecting of SEM images and Dr. Konstantin Kovalenko for BET analysis.
- P.F. Smet, I. Moreels, Z. Hens, and D. Poelman, “Luminescence in Sulfides: A Rich History and a Bright Future” Materials, 3 (4), 2834, 2010. https://doi.org/10.3390/ma3042834
- J. Mao, Y. Wang, Z. Zheng, and D. Deng, “The rise of two-dimensional MoS2 for catalysis” Frontiers of Physics, 13 (4), 138118, 2018. https://doi.org/10.1007/s11467-018-0812-0
- K. Jinzong, L. Yudong, Z. Yaxing, and Z. Junyi, “Progress in piezotronics of transition-metal dichalcogenides” Journal of Physics D: Applied Physics, 51 (49), 493002, 2018. https://doi.org/ 10.1088/1361-6463/aadb15
- E.D. Grayfer, E.M. Pazhetnov, M.N. Kozlova, S.B. Artemkina, and V.E. Fedorov, “Anionic redox chemistry in polysulfide electrode materials for rechargeable batteries” ChemSusChem, 10 (24), 4805–4811, 2017. https://doi.org/10.1002/cssc.201701709
- C. Yan, C. Gong, P. Wangyang, J. Chu, K. Hu, C. Li, X. Wang, X. Du, T. Zhai, Y. Li, and J. Xiong, “2D Group IVB Transition Metal Dichalcogenides” Advanced Functional Materials, 28 (39), 1803305, 2018. https://doi.org/10.1002/adfm.201803305
- M.N. Kozlova, Y.V. Mironov, E.D. Grayfer, A.I. Smolentsev, V.I. Zaikovskii, N.A. Nebogatikova, T.Y. Podlipskaya, and V.E. Fedorov, “Synthesis, Crystal Structure, and Colloidal Dispersions of Vanadium Tetrasulfide (VS4)” Chemistry – A European Journal, 21 (12), 4639-4645, 2015. https://doi.org/10.1002/chem.201406428
- J. Rijnsdorp, and F. Jellinek, “The crystal structure of niobium trisulfide, NbS3” Journal of Solid State Chemistry, 25 325-328, 1978.
- S. Furuseth, L. Brattas, and A. Kjekshus, “On the crystal structures of TiS3, ZrS3, ZrSe3, ZrTe3, HfS3, and HfSe3” Acta Chemica Scandinavica A, 29 623-631, 1975.
- S.J. Hibble, and G.B. Wood, “Modeling the Structure of Amorphous MoS3: A Neutron Diffraction and Reverse Monte Carlo Study” Journal of the American Chemical Society, 126 (3), 959-965, 2004. https://doi.org/10.1021/ja037666o
- D.A. Rice, S.J. Hibble, M.J. Almond, K.A.H. Mohammad, and S.P. Pearse, “Novel low-temperature route to known (MnS and FeS2) and new (CrS3, MoS4 and WS5) transition-metal sulfides” Journal of Materials Chemistry, 2 (8), 895-896, 1992. https://doi.org/10.1039/JM9920200895
- M.N. Kozlova, E.D. Grayfer, P.A. Poltarak, S.B. Artemkina, A.G. Cherkov, L.S. Kibis, A.I. Boronin, and V.E. Fedorov, “Oxidizing Properties of the Polysulfide Surfaces of Patronite VS4 and NbS3 Induced by (S2)2- Groups: Unusual Formation of Ag2S Nanoparticles” Advanced Materials Interfaces, 1700999, 2017. DOI: 10.1002/admi.201700999
- J. Rouxel, “Anion–Cation Redox Competition and the Formation of New Compounds in Highly Covalent Systems” Chemistry – A European Journal, 2 (9), 1053-1059, 1996. https://doi.org/10.1002/chem.19960020904
- V.V.T. Doan-Nguyen, K.S. Subrahmanyam, M.M. Butala, J.A. Gerbec, S.M. Islam, K.N. Kanipe, C.E. Wilson, M. Balasubramanian, K.M. Wiaderek, O.J. Borkiewicz, K.W. Chapman, P.J. Chupas, M. Moskovits, B.S. Dunn, M.G. Kanatzidis, and R. Seshadri, “Molybdenum Polysulfide Chalcogels as High-Capacity, Anion-Redox-Driven Electrode Materials for Li-Ion Batteries” Chemistry of Materials, 28 (22), 8357-8365, 2016. https://doi.org/10.1021/acs.chemmater.6b03656
- E. Flores, J.R. Ares, I.J. Ferrer, and C. Sanchez, “Synthesis and characterization of a family of layered trichalcogenides for assisted hydrogen photogeneration” Physica Status Solidi, 10 (11), 802-806, 2016. https://doi.org/10.1002/pssr.20160016
- J. Xie, R. Wang, J. Bao, X. Zhang, H. Zhang, S. Li, and Y. Xie, “Zirconium Trisulfide Ultrathin Nanosheets as Efficient Catalyst for Water Oxidation in Both Alkaline and Neutral Solutions” Inorganic Chemistry Frontiers, 1 751-756, 2014. https://doi.org/10.1039/C4QI00127C
- C. Byrne, G. Subramanian, and S.C. Pillai, “Recent advances in photocatalysis for environmental applications” Journal of Environmental Chemical Engineering, 6 (3), 3531-3555, 2018. https://doi.org/10.1016/j.jece.2017.07.080
- G. Starukh, “Photocatalytically enhanced cationic dye removal with Zn-Al layered double hydroxides” Nanoscale Research Letters, 12 (1), 391, 2017.
- C. Chen, W. Ma, and J. Zhao, “Semiconductor-mediated photodegradation of pollutants under visible-light irradiation” Chemical Society Reviews, 39 (11), 4206-4219, 2010. https://doi.org/***
- L. Zhang, Y. He, Y. Wu, and T. Wu, “Photocatalytic degradation of RhB over MgFe2O4/TiO2 composite materials” Materials Science and Engineering: B, 176 (18), 1497-1504, 2011. https://doi.org/10.1016/j.mseb.2011.09.022
- R. Kumar, G. Kumar, and A. Umar, “Zinc oxide nanomaterials for photocatalytic degradation of methyl orange: a review” Nanoscience and Nanotechnology Letters, 6 (8), 631-650, 2014. https://doi.org/10.1166/nnl.2014.1879
- P. Dong, G. Hou, X. Xi, R. Shao, and F. Dong, “WO3-based photocatalysts: morphology control, activity enhancement and multifunctional applications” Environmental Science: Nano, 4 (3), 539-557, 2017. https://doi.org/10.1039/C6EN00478D
- X. Yang, H. Fu, K. Wong, X. Jiang, and A. Yu, “Hybrid Ag@TiO2 core–shell nanostructures with highly enhanced photocatalytic performance” Nanotechnology, 24 (41), 415601, 2013. https://doi.org/10.1088/0957-4484/24/41/415601
- J. Luo, X. Zhou, L. Ma, and X. Xu, “Enhanced visible-light-driven photocatalytic activity of WO3/BiOI heterojunction photocatalysts” Journal of Molecular Catalysis A: Chemical, 410 168-176, 2015. https://doi.org/10.1016/j.molcata.2015.09.019
- S. Chen, Y. Hu, X. Jiang, S. Meng, and X. Fu, “Fabrication and characterization of novel Z-scheme photocatalyst WO3/g-C3N4 with high efficient visible light photocatalytic activity” Materials Chemistry and Physics, 149-150 512-521, 2015. https://doi.org/10.1016/j.matchemphys.2014.11.001
- S. Bai, K. Zhang, J. Sun, R. Luo, D. Li, and A. Chen, “Surface decoration of WO3 architectures with Fe2O3 nanoparticles for visible-light-driven photocatalysis” CrystEngComm, 16 3289-3295, 2014. https://doi.org/ 10.1039/C3CE42410C
- S.-M. Lam, J.-C. Sin, A.Z. Abdullah, and A.R. Mohamed, “Sunlight responsive WO3/ZnO nanorods for photocatalytic degradation and mineralization of chlorinated phenoxyacetic acid herbicides in water” Journal of Colloid and Interface Science, 450 34-44, 2015. https://doi.org/10.1016/j.jcis.2015.02.075
- L. Shi, Z. He, and S. Liu, “MoS2 quantum dots embedded in g-C3N4 frameworks: A hybrid 0D-2D heterojunction as an efficient visible-light driven photocatalyst” Applied Surface Science, 457 30-40, 2018. https://doi.org/10.1016/j.apsusc.2018.06.132
- Q. Qin, Q. Shi, W. Ding, J. Wan, and Z. Hu, “Efficient hydrogen evolution and rapid degradation of organic pollutants by robust catalysts of MoS2/TNT@CNTs” International Journal of Hydrogen Energy, 43 (33), 16024-16037, 2018. https://doi.org/10.1016/j.ijhydene.2018.07.051
- H. Li, H. Shen, L. Duan, R. Liu, Q. Li, Q. Zhang, and X. Zhao, “Enhanced photocatalytic activity and synthesis of ZnO nanorods/MoS2 composites” Superlattices and Microstructures, 117 336-341, 2018. https://doi.org/10.1016/j.spmi.2018.03.028
- S. Kurita, M. Tanaka, and F. Levy, “Optical spectra near band edge of ZrS3 and ZrSe3” Phsical Review B, 48 (3), 1356-1360, 1993. https://doi.org/10.1103/physrevb.48.1356
- A.A. Stabile, L. Whittaker, T.L. Wu, P.M. Marley, S. Banerjee, and G. Sambandamurthy, “Synthesis, characterization, and Finite size effects on electrical transport of nanoribbons of the charge density wave conductor NbSe3” Nanotechnology, 22 485201, 2011. https://doi.org/10.1088/0957-4484/22/48/485201
- K. Endo, H. Ihara, K. Watanabe, and S.I. Gonda, “XPS study on valence band structures of transition-metal trisulfides, TiS3, NbS3, TaS3” Journal of solid state chemistry, 39 215-218, 1981. https://doi.org/10.1016/0022-4596(81)90334-0
- A.L. Patterson, “The Scherrer formula for X-ray particle size determination” Physical Review, 56 978-982, 1939.
- H. Jin, D. Cheng, J. Li, X. Cao, B. Li, X. Wang, X. Liu, and X. Zhao, “Facile synthesis of zirconium trisulfide and hafnium trisulfide nanobelts: Growth mechanism and Raman spectroscopy” Solid State Sciences, 13 (5), 1166-1171, 2011. https://doi.org/10.1016/j.solidstatesciences.2010.12.017
- K. Giagloglou, J.L. Payne, C. Crouch, R.K. Gover, P.A. Connor, and J.T. Irvine, “Zirconium trisulfide as a promising cathode material for Li primary thermal batteries” Journal of the Electrochemical Society, 163 (14), A3126-A3130, 2016. https://doi.org/10.1149/2.1351614jes
- P. Gard, F. Cruege, C. Sourisseau, and O. Gorochov, “Single-crystal micro-Raman studies of ZrS3, TiS3, and several Zr1-xTixS3 compounds (0<x<=0.33)” Journal of Raman Spectroscopy, 17 283-288, 1986. https://doi.org/10.1002/jrs.1250170310
- C. Wang, Y. Zhan, and Z. Wang, “TiO2, MoS2, and TiO2/MoS2 Heterostructures for Use in Organic Dyes Degradation” ChemistrySelect, 3 (6), 1713-1718, 2018. https://doi.org/10.1002/slct.201800054
- H. Jin, D. Cheng, J. Li, X. Cao, B. Li, X. Wang, X. Liu, and X. Zhao, “Facile synthesis of zirconium trisulfide and hafnium trisulfide nanobelts: Growth mechanism and Raman spectroscopy” Solid State Sciences, 13 1166-1171, 2011. https://doi.org/10.1016/j.solidstatesciences.2010.12.017
- V.G. Keramidas, and W.B. White, “Raman Scattering Study of the Crystallization and Phase Transformations of ZrO2” J. Am. Ceram. Soc., 57 (1), 22-24, 1974. https://doi.org/10.1111/j.1151-2916.1974.tb11355.x
- F. Jellinek, R.A. Pollak, and M.W. Shafer, “X-ray photoelectron spectra and electronic structure of zirconium trisulfide and triselenide” Materials Research Bulletin, 9 (6), 845-856, 1974. http://dx.doi.org/10.1016/0025-5408(74)90121-4
- C. Morant, J.M. Sanz, L. Galán, L. Soriano, and F. Rueda, “An XPS study of the interaction of oxygen with zirconium” Surface Science, 218 (2), 331-345, 1989. https://doi.org/10.1016/0039-6028(89)90156-8