Over-The-Air Testing of Automotive Antennas and Wireless Links in The Installed State on The Basis of LTE Downlink Communication Parameters
 , Lisa Jäger, Andreas Schwind, Frank Wollenschläger, Christian Bornkessel, Matthias A. Hein
Adv. Sci. Technol. Eng. Syst. J. 4(1), 282–291 (2019);
 DOI: 10.25046/aj040127
Modern automobiles have been turning more and more into wireless sensor and communication networks. Accordingly, the number of radio systems is steadily increasing. Due to strict safety requirements, these radio systems need to be tested extensively for functionality and reliability, especially under poor radio channel conditions. Beside the large electrical size of cars at frequencies of mobile communication services, access to the antennas imposes challenges for testing, due to an increasingly high integration of the antennas with frontends and digital signal processing. This paper proposes an over-the-air testing procedure for automotive radio systems on the basis of the wireless communication standard Long Term Evolution (LTE). A method to derive the radiation patterns of automotive antennas from reference signals in the LTE downlink scheme without requiring any access to the analogue RF feed point is proposed. A comparison of the LTE approach with the usual antenna measurement techniques shows good agreement. As a logical step from the antenna towards a complete wireless link, a concept of spatially distributed channel emulation on the basis of Software Defined Radio (SDR) modules is proposed, aiming at the emulation of essential multipath features of the wireless channel. RF measurements of the channel transfer function as well as by over-the-air end-to-end tests prove this approach to be a cost-efficient alternative to commercial channel emulators.
1. Introduction
This paper is an extension of work originally presented at the 2018 IEEE 87th Vehicular Technology Conference [1]. The paper deals with automotive antenna radiation pattern measurements on the one hand, and with end-to-end communication testing on the other hand. Both subjects are closely related, as the antenna performance has an essential impact on the overall system performance. Moreover, wireless signal transmission is strongly affected by the radio channel conditions. As a consequence, end-to-end testing of the entire communication link, including application antennas as well as radio channel conditions, is essential in order to ensure reliable functionality in real applications.
Connected and highly automated driving is a key to future mobility, especially in terms of increasing safety and improving traffic flow. Vehicle-to-vehicle (V2V) or vehicle-to-infrastructure (V2I) communication, generalized as vehicle-to-everything (V2X), has been of great interest in research and development and pushed forward by industry organizations like the 5G Automotive Association (5GAA), Car to Car Communications Consortium (C2CCC), or the Virtual Drive Test Alliance (VDT Alliance) [2][3][4]. There has been a controversial discussion about optimal technologies for the implementation of V2X networks. Beside WLAN-related networks like IEEE 802.11p, derivatives of the LTE standard are under consideration [5]. This paper focuses on the latter due to its greater variability in terms of cellular and ad-hoc networking, and in terms of its applications in mobile communications, data transmission, and V2X communications. When moving towards higher levels of driving automation, the number of sensor nodes and wireless systems in modern automobiles will increase significantly, e.g., in order to enable cooperative perception or manoeuvring. Satellite-based navigation, automotive radar sensing, but also mobile communication systems will provide altogether the basis for smart cooperative connected cars. Due to the increasing amount of wireless air interfaces, the installation space for antennas is seriously limited and, thus, the future of antennas lies in integrated modules, where radiating elements, frontends, and signal processing units are merged. As a consequence, access to the analogue RF antenna feed cannot be taken for granted any more. Consequently, conventional antenna measurement techniques, e.g. far-field measurements or nearfield measurements with subsequent nearfield-to-far-field transformation [6] [7], seem unsuitable for such integrated systems. Hence, alternative test procedures need to be identified and investigated. In this paper, we propose a concept that allows for the derivation of automotive antenna gain patterns in their installed state on the basis of LTE communication parameters, monitored by a commercial communication modem with USB drive. Instead of a wired RF connection to the antenna feed, a serial connection to a laptop computer is required, in order to retrieve information about the signal quality from the modem.
In addition to the radiation patterns of the antennas, the overall performance of automotive wireless communication systems needs to be tested, in order to ensure functionality even under poor mobile channel conditions. Drive tests have been the procedure-of-choice for the verification and validation of automotive systems. However, these tests are expensive and time consuming and, due to changing conditions in a real-world environment, reproducibility cannot be maintained. Therefore, time- and cost-efficient test procedures under reproducible laboratory conditions need to be investigated, leading to the concept of virtual drive tests. One approach for testing mobile devices under realistic radio channel conditions is the electromagnetic wave field synthesis. However, this approach is not feasible for electrically large objects like cars, as the size of the test zone is strictly limited by the available number of illumination antennas and channel emulators [7]. Therefore, in this paper, we follow a cluster-based concept for spatially distributed channel emulation, which has been implemented using commercially available Software Defined Radio (SDR) modules like the Universal Software Radio Peripheral (USRP) [8]. The functionality of the channel emulator has been demonstrated by end-to-end LTE measurements as well as by RF measurements of the emulated transfer function. All measurements were conducted in our multipurpose test facility virtual road – simulation and test area (VISTA).
2. Automotive test facility “Virtual Road Simulation and Test Area”
The unique automotive antenna test facility VISTA was installed at the Technische Universität Ilmenau under the roof of the Thuringian centre of innovation in mobility [9]. It is a multi-purpose test and measurement facility, including over-the-air testing and channel emulation for automotive wireless systems, three-dimensional radiation pattern measurements of antennas in their installed state, and electromagnetic compatibility testing. The facility comprises a shielded semi-anechoic chamber, a spherical nearfield antenna measurement system, a roller dynamometer integrated into an EMC-compatible turntable, and powerful software tools for the digital post-processing of the measured raw data. The walls and the ceiling of the chamber are covered with 60-inches pyramidal absorbers, designed for a lower frequency limit of 70 MHz. The metallic floor may be left blank, e.g. for radiated emission measurements, or covered with absorbers, e.g. for antenna measurements. The antenna measurement system is a spherical nearfield system, consisting of a multi-probe antenna arch for rapid electronically switched elevation scanning, a turntable for mechanical scanning along the azimuth, and a vehicle lift for elevating the car-under-test to the centre of the measurement arch at a height of 2.30 m above ground, as depicted in Figure 1. The left-hand semi-arch is equipped with 111 antennas covering the elevation range from 0° to 20° below horizon in 1° steps, for the frequency range from 400 MHz to 6000 MHz. The right-hand semi-arch contains 22 antennas from 2.5° to 17.5° below horizon with a spacing of 5°, for the frequency range from 70 MHz to 400 MHz. The resulting far-field radiation patterns are obtained by applying nearfield to far-field transformation algorithms. A more detailed description of VISTA can be found in [10].
3. Derivation of automotive antenna gain patterns from LTE downlink communication parameters
In this section, the procedure to derive gain patterns of automotive antennas in the installed state from LTE downlink parameters is described. In contrast to conventional antenna measurement techniques, the approach benefits from the fact that no RF cable connection to the antenna-under-test is required, rather than a serial connection to the LTE modem, which is interrogated by the connected laptop.
3.1. LTE hardware and transmission parameters and measurement setup
The commercially available communication tester CMW500 (Rohde&Schwarz) was used to establish the LTE link between an emulated base station and the LTE user equipment in VISTA [11], according to the setup outlined in Figure 2. This instrumentation allows for a full control of downlink and uplink parameters in terms of bandwidth, power levels, and resource allocation. Single-input single-output (SISO) as well as multiple-input multiple-output (MIMO) modes are supported for up to two receive and transmit antennas (2×2 MIMO). The antenna measurements described in this paper were conducted in SISO mode. The mobile terminal was a Huawei modem of type E3276s-150 (LTE category 4), connected to a laptop with a universal serial bus (USB). External monopole antennas were installed on the roof of a mid-sized passenger car mock-up and connected to the modem (see Figures 3 and 4). The modem includes one antenna for receive only, and a second antenna for reception and uplink signal transmission. Several power-related parameters, such as signal-to-interference-and-noise ratio (SINR), received signal strength indicator (RSSI), and reference signal received power (RSRP), are provided by the modem.
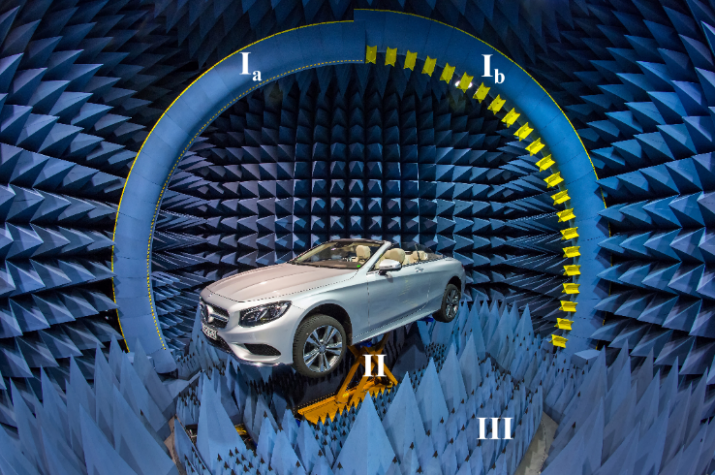 Figure 1: Photograph of VISTA with a car installed for automotive antenna measurement: Multi-probe antenna arch for the frequency range from 400 MHz up to 6 GHz (Ia) and from 70 MHz to 400 MHz (Ib). II: A customized vehicle lift elevates the car-under-test to the centre of the measurement arch 2.30 m above ground. III: The EMC-compatible turntable is used for azimuthal rotation with an accuracy of 0.1°.
RSSI is a measure of the total power received across the selected bandwidth. Its value depends on interference, noise, and channel traffic. In contrast, RSRP quantifies the average received power of
 Figure 2: Sketch of the RSRP-based measurement setup. The downlink horn antenna is installed on a height-adjustable antenna mast. Depending on the elevation angle, 90° – ϑ, the height may be set between 1 m and 4 m. The distance between the downlink transmit antenna and the centre of rotation is 7 m. An additional uplink antenna is installed near to the car, in order to provide the feedback channel from the modem to the communication tester. The implemented setup is discussed below and can be seen in Figure 7.
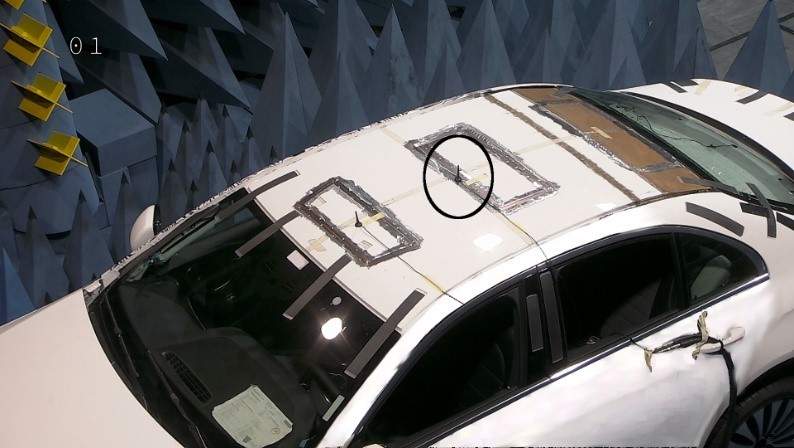 Figure 3: Photograph of the antenna-under-test, installed in VISTA. The AUT (indicated by the black circle) is connected to the Tx/Rx path of the UE, while the second Rx path is matched with a 50 Ω load.
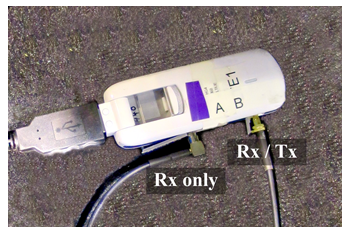 Figure 4: Photograph of the USB drive LTE modem, connected to external monopole antennas on the roof of the mock-up of a mid-size passenger car (see Figure 3). The AUT is connected to the Tx/Rx path of the UE, while the second Rx path is matched with a 50 Ω load.
dedicated reference signals (RS) in the LTE downlink. The reference signals are used for downlink channel estimation and are transmitted with constant power, independent of channel traffic [12]. For this reason, RSRP was selected as the parameter optimally suited for antenna gain measurements.
In order to conduct reliable measurements with the user equipment, the input/output power relation of the UE needs to be calibrated. The modem was characterized in terms of linearity and dynamic range in a wired measurement setup as depicted in Figure 5. Figure 6 displays the results for the I/O relation of the modem.
The downlink transmit power, given in (dBm/15 kHz), was reduced stepwise by 0.25 dB and the received power was detected by the user equipment. The measurements were performed at a carrier frequency of 2655 MHz with 1.4 MHz channel bandwidth, which is the smallest bandwidth supported by the LTE standard. The bandwidth is a measure of the frequency resolution in the RSRP measurement. As expected, the RSRP follows the power
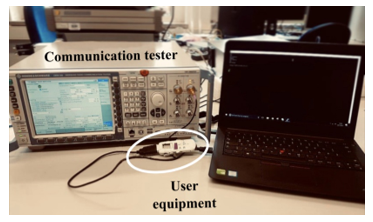 Figure 5: Setup for the measurement of the I/O relation of the LTE modem (right-hand side) with the communication tester (left-hand side). The downlink transmit power is detected by the user equipment.
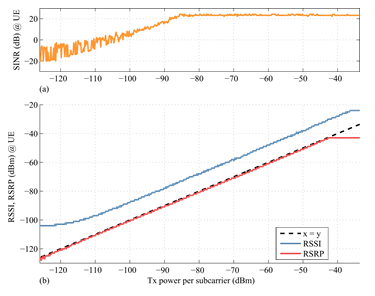 Figure 6: Typical transmission curves measured with the LTE modem. (a): The SINR (orange curve) increases linearly with the input power above the noise floor of about -100 dBm, and reaches a saturation level of 23 dB above -85 dBm. (b): The RSRP (red curve) follows the configured input power linearly for values less than -43 dBm, as indicated by the dashed black curve. The RSSI (blue curve) reaches saturation at approximately -110 dBm input power.
values set by the CMW500 very well, as it is a measure of the average power per RS resource element. Enabling detection of power levels less than -120 dBm, the RSRP offers high sensitivity, whereas the RSSI reaches saturation at -110 dBm input power. The measured data have a quantisation of 1 dB, set by the UE.
3.2. Radiation patterns derived from RSRP measurements
Antenna pattern measurement setup
A LTE link was established in VISTA between the communication tester and the antenna-under-test. The downlink signals were transmitted with a horn antenna (Schwarzbeck BBHA 9120 A) with a gain of 9.3 dBi, which was installed on a height-adjustable antenna mast (see Figure 2), in order to achieve various elevation angles-of-arrival. A second antenna was installed near the car, in order to receive the uplink signals transmitted by the user equipment. The turntable with the car was rotated stepwise, and the RSRP was evaluated as a function of the azimuth angle-of-arrival. The implementation is visualized in Figure 7. The distance between the downlink antenna and the AUT was R0 = 7 m. Taking into account the height of the car and the antenna mast, elevation angles up to 15° were adjusted. The gain of the receive antenna GRx (AUT), in decibels, can be calculated from the RSRP according to [13]:
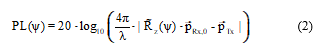
![]() PTx denotes the transmit power in dBm per 15 kHz, GTx denotes the gain of the horn antenna (downlink antenna) in dBi, LCbl and PL are cable losses and the free-space path loss in dB, respectively. For given wavelength λ and locations of transmit and receive antennas, the path loss is computed at each turntable angle ψ:
PTx denotes the transmit power in dBm per 15 kHz, GTx denotes the gain of the horn antenna (downlink antenna) in dBi, LCbl and PL are cable losses and the free-space path loss in dB, respectively. For given wavelength λ and locations of transmit and receive antennas, the path loss is computed at each turntable angle ψ:
 Chosen the center of rotation of the turntable as the origin of the coordinate system, Rz(ψ) denotes the rotation matrix around the z-axis, pTx is the position of the transmit antenna, and pRx,0 denotes the initial position of the AUT at turntable position ψ = 0°. The location of the receive antenna is derived from phase center calculations, as further described in [14].
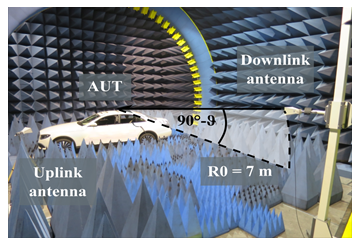 Figure 7: Photograph of the setup for the RSRP and VNA measurements. In order to suppress reflections from the metallic ground, the path between transmit antenna and antenna-under-test was covered with absorbers.
Comparison between RSRP approach and direct power transmission measurements with a network analyser
In order to validate the RSRP measurements, the gain of the AUT was additionally derived from calibrated power transmission measurements with a vector network analyser. The communication tester was replaced by the VNA, and the uplink antenna became obsolete. The positions of the transmit antenna and the AUT remained the same as in the previously described setup. The transmission factor |S21|dB = 10∙log10(|S21|2) was recorded at each angular step for a full 360° rotation of the car-under-test and, according to (3), the receive antenna gain was calculated from the measured transmission coefficient.
![]() Figure 8 displays horizontal cuts of the vertically polarised radiation pattern of the AUT at a co-elevation of ϑ = 10° and at a frequency of f = 2655 MHz, derived from both setups. A more detailed comparison, in terms of mean and variance of the error, is depicted in Figure 9 for a range of elevation angles. While the mean value indicates a static offset between the two datasets, the variance of the deviation reflects the similarity between the shapes of the patterns since it ignores a possible offset in the data. In order to express the similarity of two patterns by a single parameter, the cosine similarity can be calculated from (3) in analogy to antenna correlation [15].
Figure 8 displays horizontal cuts of the vertically polarised radiation pattern of the AUT at a co-elevation of ϑ = 10° and at a frequency of f = 2655 MHz, derived from both setups. A more detailed comparison, in terms of mean and variance of the error, is depicted in Figure 9 for a range of elevation angles. While the mean value indicates a static offset between the two datasets, the variance of the deviation reflects the similarity between the shapes of the patterns since it ignores a possible offset in the data. In order to express the similarity of two patterns by a single parameter, the cosine similarity can be calculated from (3) in analogy to antenna correlation [15].
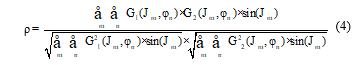 G1 and G2 denote the gain patterns #1 and #2 on a linear scale. The weighting factor sin(ϑm) compensates for the irregular spacing of the samples across the measurement sphere, given by ϑm and φn. According to (4), ρ can take values between 0 and 1, where a value of 0 implies orthogonal patterns and a value of 1 implies identical patterns, except for a scaling factor. Both datasets show good agreement regarding the angle-dependent shape of the radiation pattern, indicated by the low variance of the error (≤ 1 dB) and a high cosine similarity above 98%.
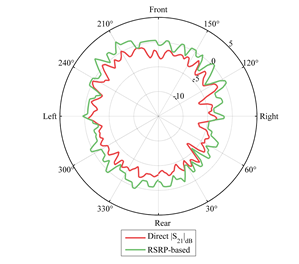 Figure 8: Comparison of the azimuth gain pattern measured via network analyser (red curve, Gmax = 0.4 dBi) and RSRP data (green curve, Gmax = 2.4 dBi) for an elevation angle of 10°.
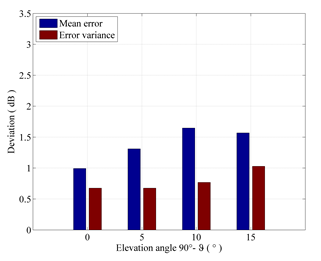 Figure 9: Bar diagram of the mean value (blue) and the variance (red) of the measurement deviation (in dB) between the direct power transmission measurement and the RSRP-based approach.
The RSRP approach tends to yield slightly higher gain values than the direct power transmission approach. Higher signal levels might be explained by measurement uncertainties during calibration and by the modem itself. Path loss and transmit antenna gain from (1) and (3) can be excluded as a reason for uncertainty between both datasets since kind and position of the antennas remained the same in the measurements and the same values were used in data analysis.
Comparison between RSRP approach and far-field pattern obtained from nearfield to far-field transformation
In addition to the RSRP and VNA measurements and the proof of their consistency, the AUT was measured with the spherical nearfield system in VISTA. For this purpose, the car mock-up was elevated, in order to place the antenna close to the phase centre of the measurement arch, as indicated by Figure 1. The far-field radiation pattern was derived from a nearfield to far-field transformation. The three-dimensional radiation pattern for vertical polarisation is depicted in Figure 10.
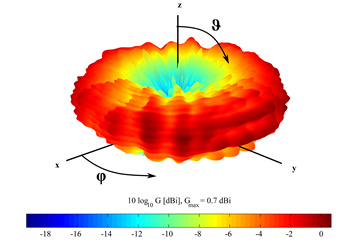 Figure 10: Three-dimensional realised-gain pattern derived from a nearfield to far-field transformation of the AUT for vertical polarisation at a frequency of 2655 MHz. The maximum gain value is 0.7 dBi.
The coordinate system was oriented as usual for automotive antenna measurements: the y-axis points along driving direction, and the z-axis to the zenith. The maximum realised gain was 0.7 dBi.
Since the vehicle was lifted to the centre of the measurement arch, a comparative measurement with the network analyser was conducted, in order to ensure comparability between the two setups with the car located on ground level and lifted, respectively. Due to the limited height of the antenna mast, just a single cut of the pattern for an elevation of 0° could be recorded with the direct power transmission method in the elevated state. Figure 11 shows that the two data sets compare favourably. The comparison between the RSRP and the far-field patterns is displayed in Figure 12, depicting the horizontal cuts of the gain patterns at an elevation of 10°. Figure 13 analyses the deviation between the data sets for the elevation angles considered. The patterns display very similar shapes, as quantified by a cosine similarity of 96 %.
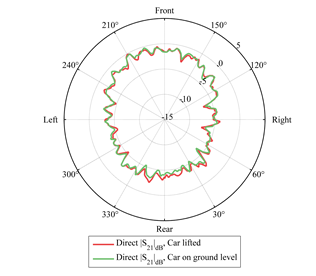 Figure 11: Comparison of the measurement setups in elevated state (red curve) and on ground level (green curve). The curves agree at all angles within 1.1 dB.
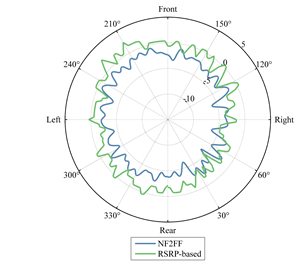 Figure 12: Comparison of the horizontal cuts at an elevation angle 10° of the gain patterns derived from the RSRP approach (green curve, Gmax = 0.4 dBi) with the dataset obtained from nearfield to far-field transformation (blue curve, Gmax = 2.4 dBi).
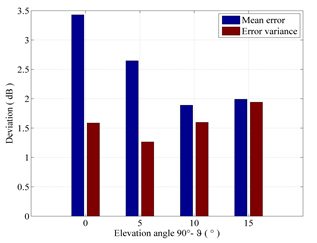 Figure 13: Bar diagram of the mean value (blue) and the variance (red) of the measurement error in dB between the RSRP nearfield pattern measurements and the nearfield to far-field transformation.
Summary of LTE antenna pattern measurements
Three types of measurements were performed, in order to derive horizontal cuts of the gain pattern of an automotive antenna: direct power transmission, nearfield measurement with subsequent nearfield to far-field transformation, and LTE-based RSRP measurement. The patterns derived from the three data sets compared very well in their shape. The small deviations observed between the absolute gain values of the three data sets may have been caused, in addition to the usual measurement uncertainties, by different post-processing of the measured signals and through reception of scattered signals by the user equipment within the car, partially bypassing the external antenna path. The user equipment was utilised as a measurement instrument, in order to evaluate downlink-specific reference signals and thus to obtain information about the received signal strength. It could be shown that the gain of the antenna can be derived from measured RSRP values without requiring access to the RF feed. Knowledge of the antenna gain is sufficient for many applications. The retrieval of phase information, following approaches like [16-18] will be in the focus of future work.
4. Over-the-air end-to-end testing of LTE links in a virtual electromagnetic environment
The overall wireless link performance of a device-under-test (user equipment) is affected by the wireless propagation channel, the antenna patterns involved in downlink and uplink communication, and the digital signal processing at both sides of the link. In order to exploit channel capacity more efficiently, multiple antennas may be installed on transmit and receive side (MIMO).
MIMO systems allow for distinctly higher data rates under favourable radio channel conditions, deploying multiple data streams by spatial multiplexing; in case of poor signal-to-noise ratio, transmission may be more robust against distortions through transmit diversity [19]. This section addresses end-to-end testing of LTE-based automotive wireless communication systems, identifying the realized data throughput as the figure-of-merit, as this describes the quality-of-service experienced by the end user best. The testing strategy follows a deterministic approach, based on the emulation of basic parameters of the wireless channel like propagation delay and Doppler shift. In contrast to stochastic fading models, physical propagation parameters are mapped deterministically onto a number of N illumination antennas. Furthermore, LTE-specific features like link adaptation and their effect on the link quality are considered.
4.1. Emulation of basic features of a wireless multipath channel
Mobile communications are characterized by multipath propagation. The signal received at the user equipment results from a superposition of many multipath components, including line-of-sight (LOS) and non-line-of-sight (NLOS) components. The latter result from reflections, scattering, refraction, or diffraction, and can be characterized by parameters like propagation delay, Doppler shift, amplitude variation, and phase shift. Additionally, spatial properties of the channel, like angles-of-arrival and angles-of-departure, need to be taken into account, especially when MIMO systems are considered. A time- and cost-efficient test procedure is favoured, reducing the amount of required hardware and software, but still projecting relevant real-world features onto the test scenario. Complexity may be reduced by aggregating several multipath components with similar properties into so-called clusters, either in the spatial domain or by joint evaluation of the angular direction-delay domains [20] [21].
In this study, channel emulation has been applied to the downlink signal by employing a number of Software-Defined Radio (SDR) modules (Universal Software Radio Peripherals, USRP) of type NI USRP 2954-R. For this purpose, an emulator previously developed on the basis of a PXI computer platform, developed by National Instruments, was adapted for the application of radio channel emulation synchronised between several USRP devices [22] [23]. The emulator architecture is divided into parameter generation on a host computer, and digital signal processing on the internal FPGA of the USRP. The USRP is controlled via a PCIe connection to the host PC, which allows for fast exchange of data and control traffic. As shown in Figure 14, each SDR module provides two RF channels, including digital down conversion (DDC) and digital up conversion (DUC), as well as the application of propagation parameters to the baseband input signal. The discrete impulse response of one specific path n of the distributed emulator can then be described by
![]() with the Dirac delta function δ(τ) [24], the path coefficient an, the static phase shift φ0,n, the delay τn, and the Doppler shift fD,n. Different directions-of-arrival can be emulated by a proper geometrical arrangement of the illumination antennas, placed around the device-under-test at a distance R.
with the Dirac delta function δ(τ) [24], the path coefficient an, the static phase shift φ0,n, the delay τn, and the Doppler shift fD,n. Different directions-of-arrival can be emulated by a proper geometrical arrangement of the illumination antennas, placed around the device-under-test at a distance R.
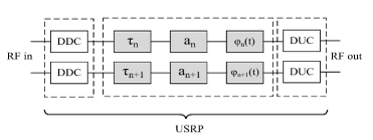 Figure 14: Simplified block diagram of RF signal processing implemented in the USRP. The analogue input signal RF in is converted via digital down conversion (DDC) to the digital baseband, where propagation delay τn, attenuation an, and a phase shift φn are applied. The phase shift may be time-dependent, in order to generate Doppler shifts. The modified RF signal RF out is then generated by digital up conversion (DUC).
According to (6), the resulting emulated channel impulse response is the superposition of time-delayed waves (wave number k = 2π/λ) impinging on the receive antenna, including the effects of antenna patterns and free-space propagation.
![]() The quantities involved are the complex-valued transmit and receive polarimetric antenna element patterns eTx and eRx, corresponding to direction-of-departure ΩD,n and direction-of-arrival ΩA,n, respectively. The proof-of-functionality of the emulator was achieved by measurements of the channel transfer function H(f) for given values of delay, Doppler frequency, and the amplitude ratio of multipath components, with transmitter and receiver connected by cables. The simple, yet very relevant two-path model was chosen as a reference scenario, in order to generate a transfer function with well-known characteristics suitable for comparison with analytical results. The LTE test signal was generated by an arbitrary-waveform generator and distributed to the USRP with a power splitter, as depicted in Figure 15.
The quantities involved are the complex-valued transmit and receive polarimetric antenna element patterns eTx and eRx, corresponding to direction-of-departure ΩD,n and direction-of-arrival ΩA,n, respectively. The proof-of-functionality of the emulator was achieved by measurements of the channel transfer function H(f) for given values of delay, Doppler frequency, and the amplitude ratio of multipath components, with transmitter and receiver connected by cables. The simple, yet very relevant two-path model was chosen as a reference scenario, in order to generate a transfer function with well-known characteristics suitable for comparison with analytical results. The LTE test signal was generated by an arbitrary-waveform generator and distributed to the USRP with a power splitter, as depicted in Figure 15.
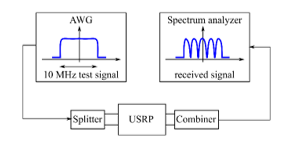 Figure 15: Block diagram of the setup for the verification of the emulated channel transfer function in the frequency domain. An arbitrary-waveform generator (AWG) provides a physical-layer LTE signal with a bandwidth of 10 MHz. The test signal is distributed via a power splitter to the USRP, which sets basic channel parameters. The emulated signal is evaluated with a spectrum analyser.
For N = 2 propagation paths, the channel transfer function emulated by the USRP in the frequency domain results from the Fourier transform of (5):
![]() In a first step, a static scenario (fD = 0 Hz) was considered, in order to verify the proper emulation of amplitude weights and path delays. In this case, (7) simplifies to a sum of two complex exponentials, which is entirely determined by the propagation time difference Δτ = τ2 – τ1, the phase difference Δφ = φ2 – φ1, and the amplitude ratio A = a1/a2. Figure 16 shows the results to the maximum values of the measured transfer function for Δτ = 500 ns and A = {1, 0.5}. Measured and theoretical values agree very well. Corresponding to the inverse of Δτ, the separation between two maxima of the transfer function was found to be exactly 2 MHz. In case of equally strong paths (A = 1), deep fading minima emerge. However, the measured data are affected by noise on the one hand, and the limited frequency resolution of 14.5 kHz on the other hand. For A = 0.5, the fading notch amounts to -9.5 dB, and matches the theoretical expectations accurately. After initialisation of the emulator, a random phase shift was observed to occur between the RF frontends of the USRP due to the phase-locked loops, leading to a frequency shift of the transfer function by Δφ = 2πΔfΔτ . This phase shift was adjusted manually in the emulator settings, since the local oscillators cannot be coupled with the device in use.
In a first step, a static scenario (fD = 0 Hz) was considered, in order to verify the proper emulation of amplitude weights and path delays. In this case, (7) simplifies to a sum of two complex exponentials, which is entirely determined by the propagation time difference Δτ = τ2 – τ1, the phase difference Δφ = φ2 – φ1, and the amplitude ratio A = a1/a2. Figure 16 shows the results to the maximum values of the measured transfer function for Δτ = 500 ns and A = {1, 0.5}. Measured and theoretical values agree very well. Corresponding to the inverse of Δτ, the separation between two maxima of the transfer function was found to be exactly 2 MHz. In case of equally strong paths (A = 1), deep fading minima emerge. However, the measured data are affected by noise on the one hand, and the limited frequency resolution of 14.5 kHz on the other hand. For A = 0.5, the fading notch amounts to -9.5 dB, and matches the theoretical expectations accurately. After initialisation of the emulator, a random phase shift was observed to occur between the RF frontends of the USRP due to the phase-locked loops, leading to a frequency shift of the transfer function by Δφ = 2πΔfΔτ . This phase shift was adjusted manually in the emulator settings, since the local oscillators cannot be coupled with the device in use.
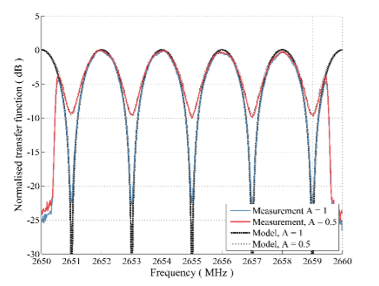 Figure 16: Comparison of emulation results (amplitude ratio of the two paths A = 1: blue curve, A = 0.5: red curve) and analytical data of the static two-path model (black and grey curves). The decay of the transfer function at the edges reflect the band-limited test signal reaching from 2650.5 MHz to 2659.5 MHz.
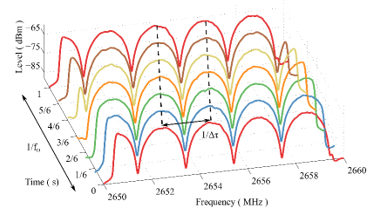 Figure 17: Temporal change of the emulated transfer function, recorded with a spectrum analyser. In case of the two-path model, the shape of the curve remains the same, but is shifted along the frequency axis, until one full Doppler-period is completed.
In a second step, a Doppler shift was applied to one of the two equally strong (A = 1) multipath components, whereas the other path remained static. The transfer function becomes time dependent and has to be recorded in temporal steps, whose resolution is limited by the update rate of the analyser. Figure 17 displays the temporal change of the transfer function for a Doppler shift of 1 Hz. After the time interval Δt = 1/fD = 1 s, the initial spectrum was recovered, confirming the correct emulation of the Doppler effect. Higher Doppler shifts up to 500 Hz were verified with similar quality.
4.2. Over-the-air throughput measurements in VISTA
Propagation model of a simplified 2 x 2 MIMO scenario
A simplified 2 x 2 MIMO communication scenario, sketched in Figure 18, provided the basis for the OTA emulation experiment. Beside verification of the emulator on the physical layer in a cable connected setup, its operational capability for end-to-end testing was studied in over-the-air throughput measurements in VISTA. The transmission mode was chosen as open-loop MIMO (TM3),
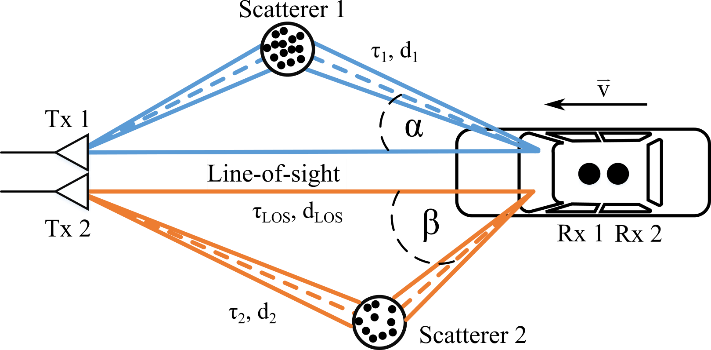 Figure 18: Sketch of the simplified 2 x 2 MIMO scenario with a passenger car driving with velocity v towards a fixed base station. Line-of-sight as well as non-line-of-sight components are considered through different path lengths dLOS, d1, and d2 respectively. Blue colour denotes MIMO data stream 1, orange colour denotes data stream 2.
as this is the mode widely used in practical applications. The delays τn were chosen from a real drive test in Ilmenau [25]: τLOS = 500 ns, τ1 = 959 ns, and τ2 = 1050 ns. The remaining channel parameters were derived from geometric considerations. With c0 being the speed of light and dn = c0 ∙ τn, the relative path weights result from an = aLOS ∙ τLOS / τn. According to the speed of the vehicle and the angle-of-arrival of the impinging waves, the Doppler shift is given by fD = v/λ ∙ cos (AOA).
Over-the-air measurement setup
The proposed model provides the basis for the evaluation of the achievable data throughput in a driving scenario under realistic channel conditions, emulated by two USRP modules. The angles-of arrival were set to α = 25° and β = 40°. The standard-compliant Huawei LTE modem mentioned in Sec. 3 was used in combination
with the communication tester, to establish a LTE link for throughput measurements; Figure 19 and Figure 20 show the block diagram and the implementation of the setup, respectively. In order to control the two USRP modules with one PC, and to synchronize their internal clocks, additional hardware was required, as explained in relation to Figure 21. The four downlink antennas were arranged on a circle around the test object with a radius of 3.95 m, in a way that the designated angles-of-arrival are emulated. The throughput measurements were conducted in LTE band 7 at a centre frequency of 2655 MHz and with a channel bandwidth of 10 MHz.
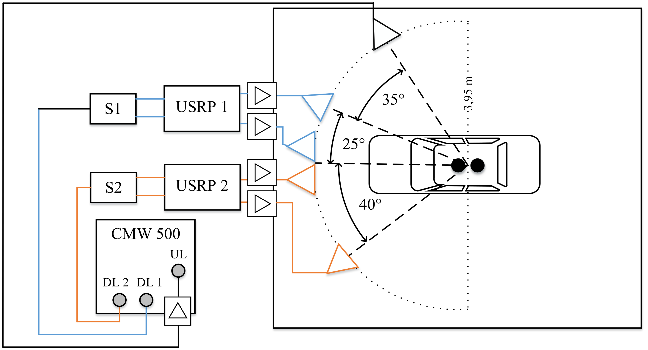 Figure 19: Block diagram of the emulation setup. The communication tester CMW500 provides the LTE protocol stack as well as the downlink RF signals. The downlink signal is distributed to the USRP via power splitters. For the sake of simplicity, the figure is limited to the relevant RF paths. Control signals and conductions for synchronisation are omitted.
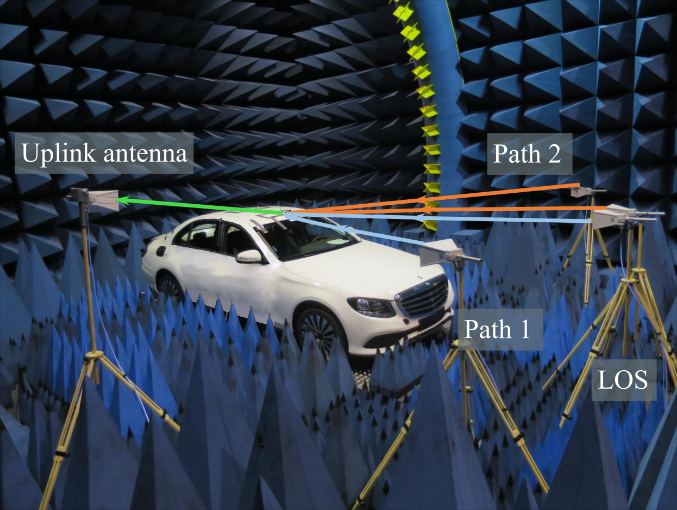 Figure 20: Measurement setup in VISTA for the emulation of the proposed MIMO scenario. The downlink signal paths are coloured blue and orange corresponding to MIMO data streams 1 and 2, respectively (c.f., Figure 18). The uplink path is highlighted in green colour. The downlink antennas are fed by two USRP modules, as indicated in Figure 21.
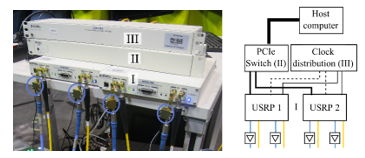 Figure 21: SDR setup for downlink channel emulation. I: The USRP modules perform the digital signal processing. The RF input signal is carried by the yellow cables. After signal processing on the internal FPGA, the signal is amplified (amplifiers indicated by blue circles) and conducted to the illumination antennas via the blue cables. II: PCIe switch for controlling both USRP modules by one host computer. The host computer is connected via a PCIe x8 connection to the switch, whereas the USRP are conducted via x4 connections. III: 10 MHz (right-hand side, solid black line) and 1 PPS (right-hand side, dotted black line) clock distribution in order to synchronize the clock of the both USRP.
Two types of measurement were performed, distinguishing between a reference measurement channel (RMC) mode and the follow-CQI (channel quality indicator) mode. Operating in RMC mode, the modulation and coding scheme is fixed; in this study, a 64 QAM scheme was chosen for the downlink. In contrast, the follow-CQI mode represents a more realistic option as it applies link adaptation, corresponding to the channel quality indicator, which is reported by the user equipment. In both modes of operation, a combination of forward-error-correction (FEC) and automatic retransmission request (ARQ), known as hybrid ARQ (HARQ), was used [26].
Over-the-air Emulation Results
Figure 22 shows the measured throughput values dependent on the received signal level for the static case. The limit of performance of the user equipment, regarding the maximum throughput, is found to be -92 dBm in RMC mode. For input levels below -92 dBm, the throughput dropped drastically. When link adaptation is applied, poor channel conditions are compensated by using a more robust modulation, e.g. 16 QAM or even QPSK instead of 64 QAM, or by reducing the code rate.
In a second step, vehicle motion was emulated, in order to stress the device-under-test when operated at the power limit. Since the LTE downlink uses frequency division access with orthogonal subcarriers (OFDMA), it is expected that Doppler shifts will have a detrimental effect on the performance due to loss of orthogonality (inter-carrier interference). Additionally, synchro-
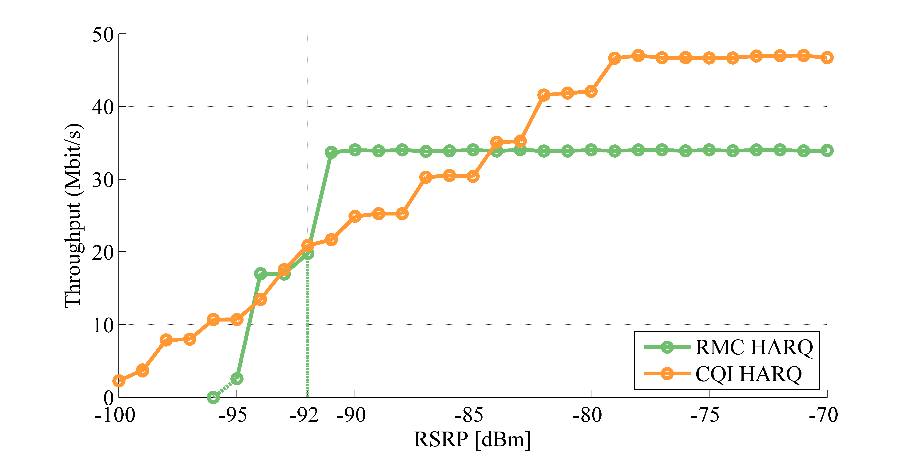 Figure 22: Measured data throughput results versus RSRP. For the reference measurement channel (green curve), the throughput remains constant at 34 Mbit/s until a critical power level of -92 dBm is reached. The data rate drops drastically when the input power level is further reduced. In contrast, when link adaptation is applied (orange curve), the maximum throughput is increased to 47 Mbit/s and the data rate decreases stepwise as channel quality (received power level) decreases.
nisation failures were also found to affect the throughput, when the device-under-test moved faster than 250 km/h [27]. Figure 23 shows the measured data throughput dependent on the emulated vehicle speed. The input power level remained constant at ‑92 dBm, while various velocities were tested. Confirmed by the cable-connected measurements, data transmission could be sustained for velocities up to 400 km/h. However, as this is not a realistic benchmark for passenger cars, the diagram is limited to a maximum velocity of 300 km/h, corresponding to a maximum Doppler shift of 740 Hz in the considered LTE band. Shallow variations of the measured throughput occur at emulated speeds below 150 km/h, corresponding to a maximum Doppler shift of 370 Hz, in both RMC and CQI modes. Different behaviour is observed for higher speeds: For the reference measurement channel, the throughput decreases strongly until data transmission fails. With link adaptation, the throughput decreases to a minimum of approximately 7.5 Mbit/s, while the link remains operational.
5. Conclusions
Over-the-air testing is an essential concept for the evaluation of automotive wireless systems, because antennas might not be accessible in installed state due to functional integration. Though knowledge of the radiation patterns of the application antennas remains a key for the evaluation of the radio system, the functionality and functional safety of connected cars require more than mere physical-layer testing. Antenna radiation pattern measurements as well as end-to-end communication testing can be applied in virtual electromagnetic environments like the virtual road simulation and test area (VISTA). In this context, this paper presented a holistic testing concept for automotive wireless systems, entirely based on LTE downlink transmission parameters. It was shown that the gain pattern of automotive antennas can be derived from known reference symbols (RSRP) in the LTE downlink scheme, detected by a commercial LTE communication modem. In contrast to conventional measurement techniques, this approach works without access to the antenna feed, rather utilizing the user equipment as the measurement instrument. The gain pattern of a monopole mounted on the roof of a mid-sized passenger car mock-up was derived and compared to data sets from direct power transmission and conventional nearfield measurements with subsequent nearfield-to-far-field transformation. The three sets of measurement were found fully consistent. The shapes of the pattern showed very good agreement,
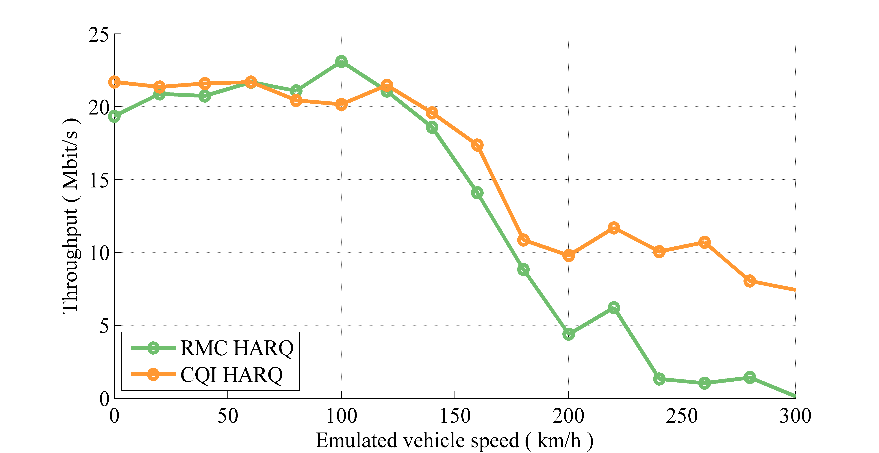 Figure 23: Results for the measured throughput dependent on the emulated vehicle speed. The device was operated at the power limit of -92 dBm. Up to speeds of 150 km/h, the user equipment behaves similarly in both operational modes RMC (green curve) and CQI (orange curve).
as indicated by a low variance of the deviations and a high cosine similarity > 96%. The RSRP concept tends to deliver slightly higher gain values compared to the other two approaches. Altogether, the RSRP-based measurement presents a promising effective alternative to conventional techniques, especially when access to the antenna feed is limited due to the installation place, or the integration with the RF frontend.
The end-to-end wireless link performance of the device-under-test was examined in terms of downlink data throughput. While widely used channel models rely on stochastic fading models, this paper proposed a simplified emulation concept based on mapping physical parameters to a set of illumination antennas arranged around the device-under-test. Compared to expensive commercial channel emulators, software-defined radio modules offer a cost-efficient opportunity to emulate basic channel parameters like path
delays, Doppler shifts, and the corresponding parameter spreads. The viability of the SDR-based channel emulator was verified by a cable-connected evaluation of the transfer function with a spectrum analyser for the relevant reference scenario of a two-path model. The comparison of the emulated data with analytically calculated reference values revealed very good agreement. By using two USRP modules, the channel emulator was installed in VISTA, and over-the-air throughput measurements were conducted. In addition to low received power levels, rapid channel fluctuations due to Doppler shifts may interrupt the LTE connection since they cause a loss of orthogonality and induce synchronization failures. The measured data throughput dropped for emulated velocities above 150 km/h, when the device operated at the critical power level of -92 dBm for the static case. Beside physical channel conditions and user equipment specifications, the configuration settings of the base station affect key performance indicators like the downlink throughput. In order to simulate the behaviour of the user equipment in a real-world scenario, the application of link adaptation is advisable.
Future work will address the retrieval of phase information of highly integrated antennas from LTE parameters, without accessing the RF feed of the AUT, as well as full three-dimensional recording of the radiation patterns. For end-to-end testing, the proposed setup employing multiple SDR modules will be extended by additional USRP devices, in order to represent a richer multipath environment and thus approximate realistic conditions more closely.
Acknowledgment
The research has been funded by the Federal State of Thuringia, Germany, and the European Social Fund (ESF) under the grant 2015 FGR 0088. The antenna test range VISTA has been funded by the Federal State of Thuringia, the European Regional Development Fund (ERDF), and the German Research Foundation (DFG, 250758117) with financial support from Fraunhofer IIS. The authors would like to thank Mario Lorenz and Dr. Tobias Nowack for their support during the measurements. We further acknowledge funding for the article processing charge by the German Research Foundation (DFG) and the open access publication fund of the Technische Universität Ilmenau.
- P. Berlt, F. Wollenschläger, C. Bornkessel and M. A. Hein, „Reliable derivation of automotive antenna gain patterns from LTE communication parameters“, 2018 IEEE 87th Vehicular Technology Conference (VTC Spring), Porto, 2018
- 5G Automotive Association, http://5gaa.org; online, 2018
- Car 2 Car Communications Consortium, http://car-2-car.org; online, 2018
- Virtual Drive Test Alliance, http://tu-ilmenau.de/vdt-alliance; online, 2018
- Z. H. Mir and F. Filali, “LTE and IEEE 802.11p for vehicular networking: a performance evaluation.” EURASIP J. Wireless Comm. and Networking 2014 (2014)
- C.A. Balanis, „Antenna Measurements“ In: Antenna Theory Analysis and Design. Wiley, 2005.
- J. E. Hansen, Ed., “Spherical Near-field Antenna Measurements”, Institution of Engineering and Technology, London, UK, 2008.
- Specification USRP-2954, 10 MHz to 6 GHz Tunable RF Transceiver, National Instruments. Available: http://ni.com/pdf/manuals/375725c.pdf; online, 2018
- Thuringian Center of Innovation in Mobility, http://mobilitaet-thueringen.de; online, 2018
- M. A. Hein et al., “Emulation of virtual radio environments for realistic end-to-end testing for intelligent traffic systems,” 2015 IEEE MTT-S International Conference on Microwaves for Intelligent Mobility (ICMIM), Heidelberg, 2015, pp. 1-4.
- R&S CMW Wideband Radio Communication Tester Specifications, Rohde&Schwarz. Available: https://tinyurl.com/rscmw500; online, 2018.
- European Telecommunications Standards Institute, “LTE; Evolved Universal Terrestrial Radio Access (E-UTRA); Physical layer – Measurements” European Telecommunications Standards Institute, ETSI TS 136 214 V15.3.0 (2018-10), p. 8. Available: http://etsi.org.
- Harald T. Friis, “A Note on a Simple Transmission Formula”, Proceedings of the I.R.E. and Waves and Electrons, May, 1946, pp 254–256
- F. Wollenschläger, S. N. Hasnain, C. Bornkessel and M. A. Hein, “Precision Phase Measurements of Automotive Antennas for Localization in Anechoic Chambers”, 12th European Conference on Antennas and Propagation (EuCAP 2018), London, UK, 2018.
- A. Stjernman, “Relationship between radiation pattern correlation and scattering matrix of lossless and lossy antennas”, IEEE Elect. Lett., vol. 41, no. 12, pp.678-680, Jun. 2005.
- A. Paulus, J. Knapp and T. F. Eibert, “Phaseless Near-Field Far-Field Transformation Utilizing Combinations of Probe Signals,” in IEEE Transactions on Antennas and Propagation, vol. 65, no. 10, 2017.
- C.H. Schmidt and Y. Rahmat-Samii, “Phaseless spherical near-field antenna measurements: Concept, algorithm and simulation,” 2009 IEEE Antennas and Propagation Society International Symposium, Charleston, SC, 2009, pp. 1-4.
- D. Smith, M. Leach, M. Elsdon and S. J. Foti, “Indirect Holographic Techniques for Determining Antenna Radiation Characteristics and Imaging Aperture Fields,” in IEEE Antennas and Propagation Magazine, vol. 49, no. 1, pp. 54-67, Feb. 2007.
- European Telecommunications Standards Institute, “LTE; Evolved Universal Terrestrial Radio Access (E-UTRA); User Equipment (UE) radio transmission and reception” European Telecommunications Standards Institute, ETSI TS 136 211 V10.0.0 (2011-01), pp. 56ff. Available: http://etsi.org.
- C. Schneider et al., “Directional analysis of multipath propagation in vehicle-2-vehicle channels,” 2016 10th European Conference on Antennas and Propagation (EuCAP), Davos, 2016, pp. 1-5.
- D. Shutin, “Clustering wireless channel impulse responses in angular-delay domain”, 2004 IEEE 5th Workshop on Signal Processing Advances in Wireless Communications, 2004, pp. 253-257
- NI, “Real-Time MIMO Channel Emulation on the NI PXIe-5644R,” National Instruments, White Paper, May 2013. [Online]. Available: http://www.ni.com/example/31556/en/
- L. Jäger, P. Berlt, C. Bornkessel and M.A. Hein, „Distributed Spataial Channel Emulation for Virtual Drive Testing Based on Multiple Software-Defined Radios“, 2019 13th European Conference on Antennas and Propagation (EuCAP), Krakow, 2019 (accepted)
- F.G. Friedlander and M.S. Joshi, “Introduction to the Theory of Distributions”, Cambridge University Press, 1998
- J. Gedschold et al., “Tracking based Multipath Clustering in Vehicle-to-Infrastructure Channels”, 2018 IEEE International Symposium on Personal, Indoor and Mobile Radio Communications, Bologna, 2018
- E. Dahlmann, S. Parkvall, and J. Sköld, 4G LTE / LTE Advanced for Mobile Broadband. Academic Press, 2011.
- D. Micheli, M. Barazzetta, R. Diamanti, P. Obino, R. Lattanzi, L. Bastianelli, V. M.Primiani, and F. Moglie, “Over-the-Air Tests of High-Speed Moving LTE Users in a Reverberation Chamber,” in IEEE Transactions on Vehicular Technology, vol. 67, no. 5, May 2018, pp. 4340–4349