Talk Show’s Business Intelligence on Television by Using Social Media Data in Indonesia
Adv. Sci. Technol. Eng. Syst. J. 4(1), 311–316 (2019);
 DOI: 10.25046/aj040130
Knowing how and types of talk shows discussed in social media is significant to all stakeholders in a talk show’s program. There are many messages that can be found in social media that need to be noticed so the messages from the user could reach the viewer. Social media provides promising as well as challenging data to business intelligence. By using data warehouse and business intelligence, the data from social media can be proceeded to monitor and understand adoption and sentiment. In this research, data warehouse and business intelligence will be designed and implemented using data from social medias; Facebook, Twitter, Instagram, and Youtube which are expected to be the source to do monitoring to social media contents that are shared by each stakeholder from the talk shows that are going to be analyzed. As for the sentiment analysis, word2vec, Naïve Bayes and Random Forest will be applied for the qualification methods. As a result, this monitoring is used to give understanding of how information spread and the sentiment which underlies the spreading messages could give critical perception to the management on how their product recognized and valued in society.
1. Introduction
Based on the data of Television Program Quality Index in 2016 Period 5 which is released by Broadcasting Commission of Indonesia (Komisi Penyiaran Indonesia-KPI) that talk show program get scale index 3, 48 out of 4 in according to KPI’s standard. This index is higher than news program that gets 3,44, comedy at 3,27, variety show at 3,06, film and tv series at 2,75 and infotainment at 2,71 [1]. Talk show program as a product or commodity is possible to compete with other products. As a pop-culture product, talk show program must be marketable [2]. Through social media [Facebook, Twitter, Instagram, YouTube], communication occurs in real time with a wider coverage area. This program recognized as a place to share ideas and information as well as entertainment in order to give valuable knowledge to the viewer.
Business starts to see technology as an effective mechanism to interact more with their client and customer [3]. The content, time and frequency of conversations in social media about a product between customers are beyond the control of the manager. In that, managers need to learn how to form consumer’s discussion in a way which is in line with the mission and target of the organization [4]. The key to success in taking the advantage of consumer involvement is in the understanding of the consumer itself, such as; dissatisfaction, wishes or even their unconscious feeling [5].
At least there are two implications why a company directly involves in social media. First is the need to evaluate social objects and the second one is related to how far a content should be spread so the content could be managed as best as it could, therefore a content management system is needed to identify and manage the content in social media [6]. The Monitoring system is also needed in order to see viewer sentiment, so it could give confidence to the continuity of the talk show program, at least in public perception. With data monitoring, every company that broadcast talk show program could also see the competitiveness level so they could quickly formulate the strategy to face the competition. To date, TV programs are rated by the quantitative survey, thus qualitative survey is also important to be implemented to determine which programs are qualified and worth to be watched by the viewer. This will tell how popular a talk show program in each TV station is and what aspect needs to be improved based on the responses of the TV viewers.
The high amount of information that users continually provides to the Internet requires methods that sort this information and stores it in a way that can be easily accessed and processed [7]. In its original forms, the data contains noise and unstructured that cause difficulty to extract the information in real time. By using data warehouse and business intelligence, the data from social media can be proceeded to monitor and understand adoption and product sentiment. Understanding how the information spread and the sentiment which underlies the messages will give critical perspective to the management about how their product recognized [8]. The application of business intelligence as a tool to monitor could provide reliable information to make effective decision as well as helping in evaluating consumer values and the desire to gain profit [9].
Sentiment analysis is an important tool for the extraction of information about the human emotional state [10]. Since the internet has become an excellent source of consumer review, the area of sentiment analysis has seen a large increase in academic interest [11]. Researches and the use of social media data for sentiment analysis or business intelligence have been done by some people, either for business necessity or else. Machine learning technique can be used to conclude sentiments on social media data that shows the perspective and experience of medicines and cosmetics consumer. The result of this study suggests considering spam comments, comparing the performance of different machine learning sentiment classification, temporary analysis to detect the decreasing tendency or the decline of their sentiment or of a specific product [12]. Decision Support System base on sentiment analysis able to efficiently support companies and enterprises in managing promotional and marketing campaigns on multiple social media channels [13]. Survey analysis shows that people are willing to be involved in the creation of educational policy and their opinion on social media could be directed to the creation of effective educational policy. However, the twitter classification [positive, negative and neutral] has not done in this research [14].
Other research has shown that social media data could be used to form a data warehouse to analyze data in social media such as; likes, comments and sentiment analysis that will be used as the object to design business intelligence to observe the company performance based on the data from their social media. This research will also state that the classification accuracy could be improved by using the algorithm and machine learning like naïve Bayes classification and in the future, Facebook emoticon could also be analyzed to get more comprehensive information [9].
Other research is the analysis of social media content by using some methods of data mining, thus recent information could be collected to support decision making that could give benefit to either company or personal. The objective of this research is to create business intelligence dashboard to observe the performance of news channels that is posted to social media accounts like Facebook and Twitter. This study also suggests wording qualification using Word2vec that could enhance the accuracy of text qualification process [15,16].
In this research a data warehouse and business intelligence software will be designed and implemented by using the data from social media such as; Facebook, Twitter, Instagram, and Youtube which are expected as the sources to do the monitoring towards the contents of those social media which are shared by each stakeholder of talk show programs that are going to be analysed. As for the sentiment analysis, word2vec and Naïve Bayes and Random Forest algorithms will be applied for the qualification methods. So, this research is also expected to give perception of the rating of a talk show program qualitatively.
2. Research Method
Generally, steps in this research are collecting data, sentiment analysis, design of data warehouse, and design of business intelligence. Figure 1 is the proposed model which consists of data collection process, sentiment analysis process, and data warehouse process. The detail of these steps can be seen in the next subsection.
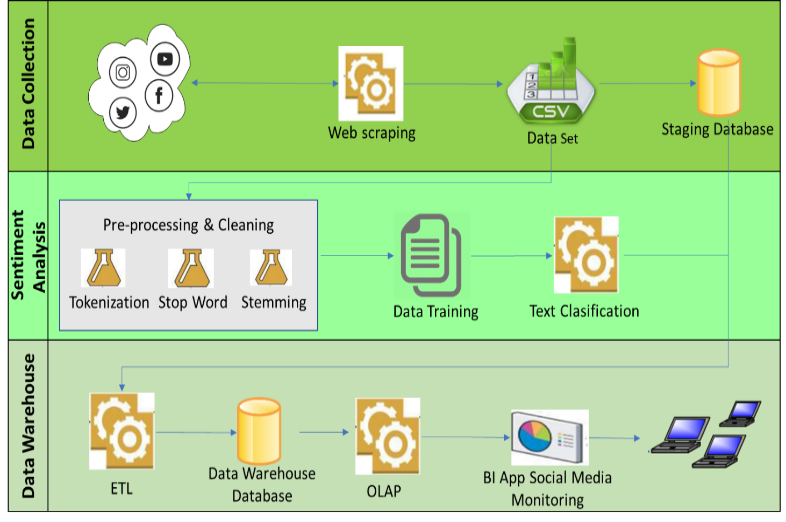 Figure 1: Proposed Model
2.1. Data Collection
This part consists of how the data collected from social media for each official account of the talk shows. Chosen social media for this research are Facebook, Twitter, Instagram, and Youtube. The data is taken by using web scraping method with Node.Js and Python programming language. Collected data will be saved in a file with comma separated value (csv) form. Each web scraping process for each social media account will produce 2 files in CSV format, which is one file containing the admin post and one file containing the user post. Each file with the same type will be combined into one data set file that is used for two purposes. The first is aimed for sentiment analysis process and the second is to be saved in database staging for the necessity of making data warehouse and business intelligence. In this research, will use two years of data, from March 2018 to August 2018.
2.2. Sentiment Analysis
The sentiment analysis will be carried out on this stage. Pre-processing is done in each data set such as tokenization which divides sentences into words or tokens. Then delete mentions, hashtags, and URL. The next is the stopwords process which consists of non-semantic words like article, preposition, conjunction, and pronoun. Pronouns like “he”, “they”, and “I” only have less or no information about sentiments.
After getting the data set from the pre-processing process, it will be continued to the classification process. It is using word2vec to produce word embeddings and Naïve Bayes (NB) and Random Forest as the machine learning’s text classification method. This classification will produce a vector for each word from the data set, then these vectors represent how we use words to describe the relation such as the word “man” to “woman”, as “king” to “queen”. Representation of words within a sentence can define the characteristics of the words and word embedding of sentences can determine the word characteristics and the context [17].
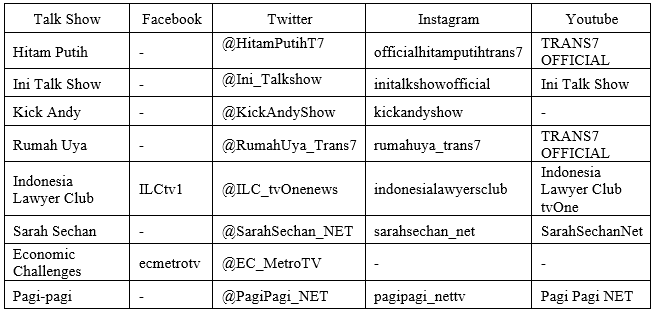 Figure 2: Social Media Accounts of Talk Show
Word2vec method treats each word equally because the purpose of word2vec is to calculate word embeddings. In word embedding, not all words represent the meaning of a particular sentence. To obtain the feature vector for each review, first, we learn the vector representation of words and then average all vectors of the words in each review. It uses 10-fold cross validation for Naïve Bayes and Out of Bag (OOB) error for Random Forest to fit and validate data training.
2.3. Data Warehouse Process
In designing data warehouse, the Kimbal method will be used where there are 9 stages that must be passed, such as: choosing the process, choosing the grain, identifying and confirming the dimensions, choosing the facts, storing pre-calculation in the fact table, rounding out the dimension tables, choosing the duration of the database, tracking slowly changing dimensions, and deciding the physical design [18].
When the data has been included into the staging database, then the ETL process will be carried out, such as calculating the number of comments, posts, likes, sentiments, and others. Data from the ETL process is then stored in the data warehouse.
Figure 3 is the scheme which is going to be used to acreate a data warehouse and business intelligence which explained that there are 2 fact tables and 6 dimensional tables. The Admin Posts Fact table is a collection of admin data posts history which is done by the admin for each social media account and has foreign key to each dimensional table. Similarly, to Fact User Comment table is the user history comments towards the admin posts for each social media’s talk show and has a foreign key to each dimensional table. Meanwhile for each dimensional table is a detailed summary of admin post data and user comments, as well as dimensional time table and dimensional talk show table to complete the needs of the data warehouse manufacture.
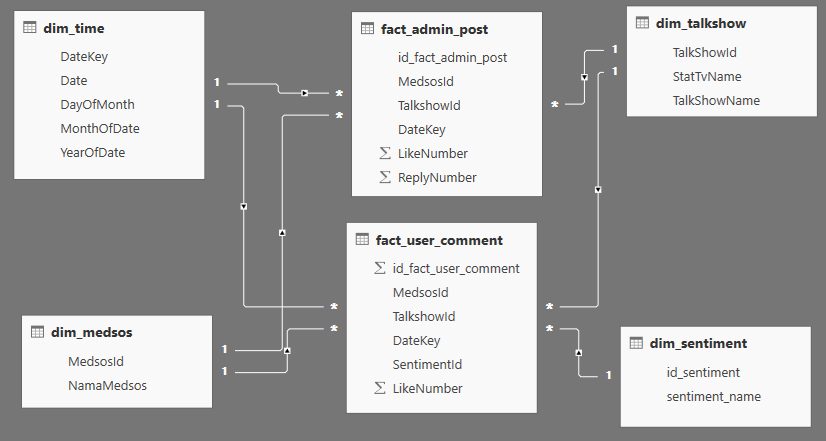 Figure 3: Start Scheme Data Warehouse
2.4. Business Intelligence System
The result of this process is a web-based business intelligence system that can be accessed by the users on the client side. Business intelligence design method that will be used in this research is business intelligence design recommended by Carlo Vercellis. He was written in his book that in developing business intelligence of a company, there are four main phases or stages that must be carried out; analysis, design, planning, implementation, and control [19].
3. Results
Based on the result of the web scrapping that has been done to the data collection process in this research, each talk show’s data from each social media’s account on period of July 2018 – August 2018 as follows:
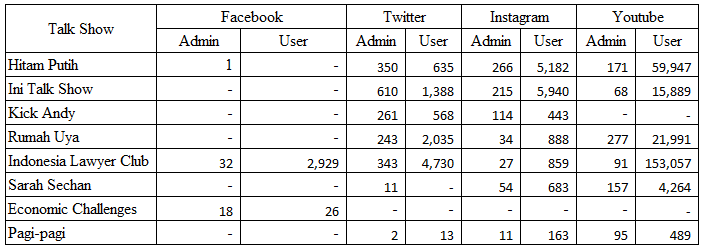 Figure 4: Admin Post and User Comment
Figure 4 shows that “Pagi-pagi” talk show has the least admin posts with only have 2 posts in Twitter account and “Pagi-Pagi” talk show has the least user comments with only 13 comments in Twitter account. Meanwhile, for the highest admin post is “Ini Talk Show” with 610 posts in Instagram account and the highest user comment is “Indonesia Lawyer Club” talk show with 153,057 comments in Youtube channel.
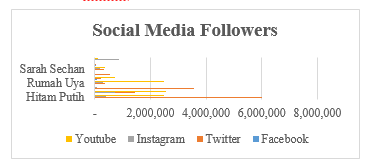 Figure 5: Social Media Followers
On Figure 5 shows the social media followers’ data for each social media’s account of the talk show. The most talk show’s follower is “Hitam Putih” about 6.000.000 followers on social media’s twitter, meanwhile, the least talk show’s follower is “Economic Challenges” which only has 84 followers on Facebook account
3.1. Sentiment Analysis
In this research, the training corpus for Word2vec contains the comment data for each social’s account (Twitter, Facebook, Instagram, and Youtube) from each talk show’s programs in Bahasa. The data that has been collected, is the data without label so it needs label to be processed as training data. For the labelling process is used Naïve Bayes algorithm until it gets sentiment positive label, negative, and neutral for each of user’s comments. We trained our corpus with 90% of user’s comments and each user’s comments from each talk show social media account as a testing data. For each of the tests that has been done, 10-fold cross validation is implemented on Naïve Bayes and Out of Bag error on Random Forest.
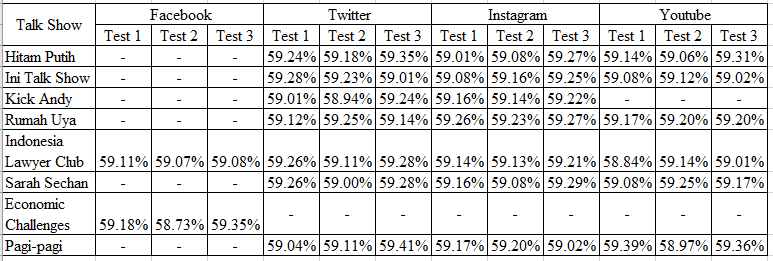 Figure 6: Naïve Bayes Algorithm Test Result using 10-Fold Cross-Validation
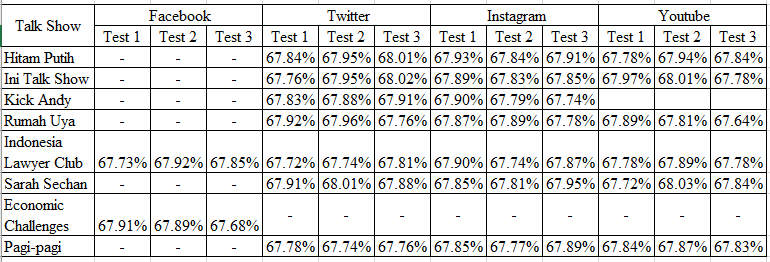 Figure 7: Random Forest Algorithm Test Result with Out-of-Bag error
Figure 6 is the summary of Naïve Bayes Algorithm test result as the text classification with cross-validation which the experiments have been conducted 3 times. As the whole test gets the result that the 2nd test gets the highest accuracy score of the overall test which is 59.41%. Figure 7 is the summary of Random Forest Algorithm test result as the text classification with Out of Bag error which the experiments have also been conducted 3 times for each social media’s accounts. The highest accuracy score of the overall test is 68,03%. From the 2nd test result of classification algorithm, therefore Random Forest Algorithm test has the highest accuracy score compared to Naïve Bayes.
Figure 8 is the summary graphic of Sentiment Analysis Prediction which can be concluded based on Sentiment Analysis Prediction towards user’s comments that have been done accumulatively. Therefore, the highest negative percentage prediction of the talk show is Indonesia Lawyers Club which is 22.16% and for the highest positive percentage prediction is also own by Indonesia Lawyers Club which is 34.17%. Meanwhile, the second position for negative percentage prediction is Hitam Putih which is 9,30% and for positive percentage prediction is 29.47%.
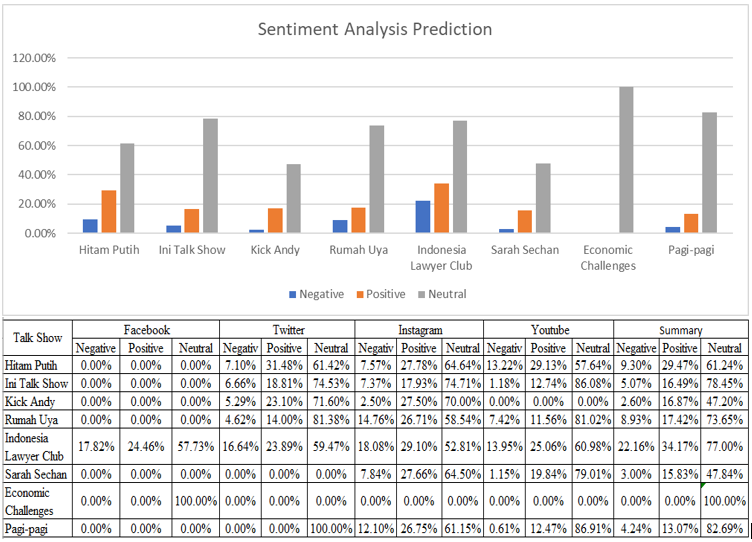 Figure 8: Summary of Sentiment Analysis Prediction
3.2 Business Intelligence System Development
In order to make easier on monitoring data, Business Intelligence Dashboard is created for admin posts data and for user comments use Microsoft Power BI. Business Intelligence System on admin’s side gives facilitation which can be used as monitoring tools, such as the admin post’s amount in a certain time scale that is needed. Also, it can be seen how many “like” have been accepted and how many “comments” which have been given by the users towards each admin’s posts on each its social medias.
In this monitoring system, it is also displayed sentiment analysis towards each social media such as Facebook, Twitter, Instagram, and YouTube, which are owned by each talk show in order to sell their talk show’s product. Besides that, it is also displayed some graphics and which post data that has the most comment and comment displays from each user’s comment.
On user’s side, this monitoring system displays data which relates with user’s comment such as the most active users for each social media’s account, sentiment prediction for each user’s comment, and which admin’s post that is popular for each talk show’s users displayed statistically.
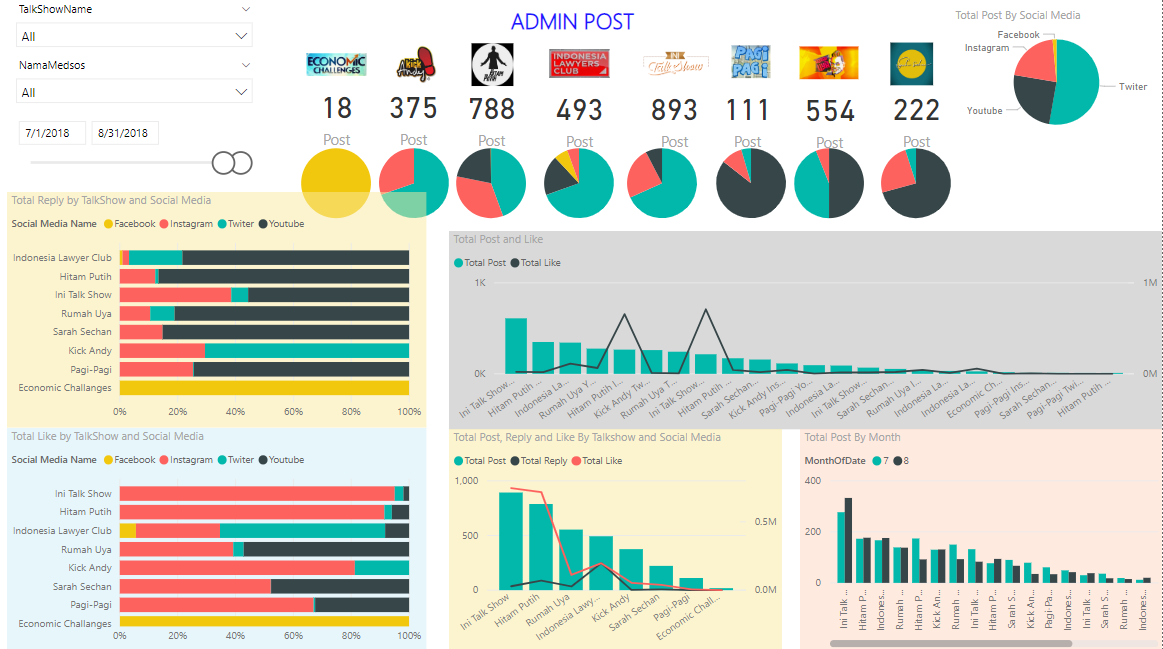 Figure 9: Admin Post Dashboard
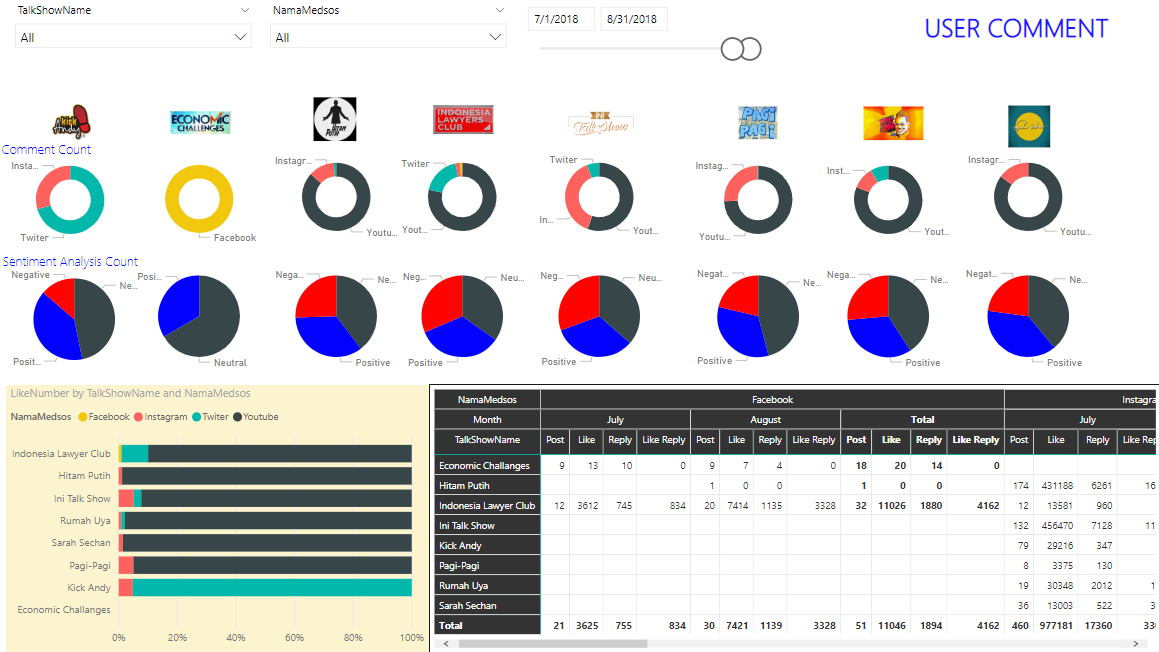 Figure 10: User Comment Dashboard
4. Discussion
In the previous research, sentiment analysis used Word2vec which was more focused on review data with the standard language, so that preprocessing process could be done maximally. In contrast to the sentiment analysis process, it used user’s comments data on social media for a talk show which comment did not use standard language. As the result, each of users could give their comments with their own language. Therefore, in the stemming process, there were a lot of words which could not be changed into basic words thus the test scores’ results were not maximal.
In business intelligence system that has been made, the data is categorized into 2 categories. They are admin posts’ data and user comments’ data. For admin’s posts category, is made into several pages of data in the form of tables and graphics to display admin’s posts, the posts’ amount, the popularity of each posts, like, share, total comment, the sentiment’s average which is categorized based on talk show’s programs and social media’s accounts. Meanwhile, for users’ comments category is made into several pages which contain tables and graphics to display users’ comments data, total comment, like, share, the sentiments’ average is also categorized into talk shows’ programs and social media’s accounts.
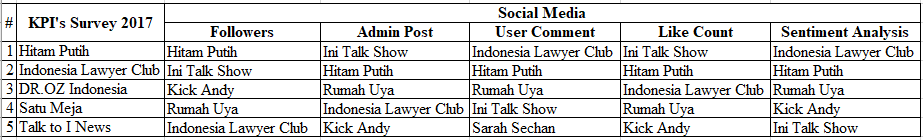 Figure 11: Top Five By Number of Viewers and Social Media Activities
Figure 11 shows the five highest data based on the amount of audience which was taken from Broadcasting Commission of Indonesia (Komisi Penyiaran Indonesia-KPI) 2nd period in the year of 2017 (18) and the number of user’s activities on social media which based on the result of KPI’s survey, the “Hitam Putih” talk show was the most watched talk show. Meanwhile, based on social media data concluded that “Hitam Putih” has the highest score and by this result, we can confirm the KPI’s survey result.
5. Conclusion
Generally, Word2vec can be used for sentiment analysis’ process in Bahasa, especially in talk shows’ programs on television. However, the result of the sentiment analysis did not show positive sentiment or negative sentiment towards its talk show, but it was more likely used as a media to express or comment the opinion freely on social media and it was not meant to give “likes” towards a talk show’s program.
Business Intelligence Monitoring System that has been created, it can automatically calculate data from admin’s side or user’s side which is sourced from the data warehouse. The data such as admin’s posts’ amount, users’ comments, like, share, dislike, who made the comments, who has the most often comments, what are the comments for each of the posts. All of these can be easily displayed in this monitoring system without immediately opening one by one each of the social media’s accounts. Therefore, through this monitoring system, the performance can be measured for each of talk show’s programs, so that it can be rated from admin’s posts and user’s comments which talk show’s program is popular in social media.
For the next research, particularly for sentiment analysis process, it needs to be developed a stemming method and stop word for nonstandard words especially in Bahasa in order to get basic word precisely from each of user’s comments words. Business Intelligence Monitoring System which has been created, it will be better if the data can be processed fast in real time with the use of existing big data technology.
Acknowledgment
The researchers would like to thank for magister programs at bina nusantara university who have supported this research.
- Komisi Penyiaran Indonesia, “Survei Indeks Kualitas Program Siaran Televisi Periode 5 tahun 2016,” 2016.
- B. M. Timberg, Television Talk: A History of The Tv Talk Show. The University Of Texas Press, 2002.
- A. Abdallah, N. P. Rana, Y. K. Dwivedi, and R. Algharabat, “Social media in marketing: A review and analysis of the existing literature,” Telemat. Informatics, vol. 34, no. 7, pp. 1177–1190, 2017. https://doi.org/10.1016/j.tele.2017.05.008
- W. G. Mangold and D. J. Faulds, “Social media: The new hybrid element of the promotion mix,” Business Horizons., vol. 52, no. 4, pp. 357–365, 2009. https://doi.org/10.1016/j.bushor.2009.03.002
- M. H. Saragih and A. S. Girsang, “Sentiment Analysis of Customer Engagement on Social Media in Transport Online,” in 2017 International Conference on Sustainable Information Engineering and Technology (SIET), 2017. https://doi.org/10.1109/SIET.2017.8304103
- J. H. Kietzmann, K. Hermkens, I. P. McCarthy, and B. S. Silvestre, “Social media? Get serious! Understanding the functional building blocks of social media,” Business Horizons., vol. 54, no. 3, pp. 241–251, 2011. https://doi.org/10.1016/j.bushor.2011.01.005
- J. A. Morente-Molinera, G. Kou, C. Pang, F. J. Cabrerizo, and E. Herrera-Viedma, “An automatic procedure to create fuzzy ontologies from users’ opinions using sentiment analysis procedures and multi-granular fuzzy linguistic modelling methods,” Information Sciences, vol. 476, pp. 222–238, 2019. https://doi.org/10.1016/j.ins.2018.10.022
- Y. Lu, F. Wang, and R. Maciejewski, “Business Intelligence from Social Media: A Study from the VAST Box Office Challenge,” Comput. Graph. Appl. IEEE, vol. 34 no 5, pp. 58-69, 2014. https://doi.org/10.1109/MCG.2014.61
- M. Yulianto, A. S. Girsang, and R. Y. Rumagit, “Business Intelligence for Social Media Interaction In The Travel Industry In Indonesia,” J. Intell. Stud. Bus., vol. 8, no. 2, pp. 72–79, 2018.
- H. H. Do, P. W. C. Prasad, A. Maag, and A. Alsadoon, “Deep Learning for Aspect-Based Sentiment Analysis: A Comparative Review,” Expert Syst. Appl., vol. 118, pp. 272–299, 2019. https://doi.org/10.1016/j.eswa.2018.10.003
- Y. Fang, H. Tan, and J. Zhang, “Multi-strategy sentiment analysis of consumer reviews based on semantic fuzziness,” IEEE Access, vol. 6, no. c, pp. 20625–20631, 2018. https://doi.org/10.1109/ACCESS.2018.2820025
- H. Isah, P. Trundle, and D. Neagu, “Social Media Analysis for Product Safety using Text Mining and Sentiment Analysis,” in 2014 14th UK Workshop on Computational Intelligence (UKCI), 2014. https://doi.org/10.1109/UKCI.2014.6930158
- P. Ducange, M. Fazzolari, M. Petrocchi, and M. Vecchio, “An effective Decision Support System for social media listening based on cross-source sentiment analysis models,” Eng. Appl. Artif. Intell., vol. 78, no. October 2018, pp. 71–85, 2019. https://doi.org/10.1016/j.engappai.2018.10.014
- M. S. Omar, A. Njeru, S. Paracha, M. Wannous, and S. Yi, “Mining Tweets for Education Reforms,” in 2017 International Conference on Applied System Innovation (ICASI), 2017. https://doi.org/10.1109/ICASI.2017.7988441
- P. F. Kurnia and Suharjito, “Business Intelligence Model to Analyze Social Media Information,” Procedia Comput. Sci., vol. 135, no. September, pp. 5–14, 2018.https://doi.org/10.1016/j.procs.2018.08.144
- P. F. Kurnia, “Perancangan dan implementasi bisnis intelligence pada sistem social media monitoring and analysis (studi kasus di pt. dynamo media network),” Bina Nusantara University, 2017.
- M. A.- Amin, M. S. Islam, and S. Das Uzzal, “Sentiment Analysis of Bengali Comments With Word2Vec and Sentiment Information of Words,” in 2017 International Conference on Electrical, Computer and Communication Engineering (ECCE), 2017. https://doi.org/10.1109/ECACE.2017.7912903
- R. Kimball and M. Ross, The Kimball Group Reader: Reader: Relentlessly Practical Tools for Data Warehousing and Business Intelligence. 2010.
- C. Vercellis, Business Intelligence, Data Mining and Optimization for Decision Making. John Wiley & Sons, Ltd, 2009.
No. of Downloads Per Month
No. of Downloads Per Country