Technical and Economic Merits Resulting from Power Systems Interconnection
Volume 4, Issue 2, Page No 34-39, 2019
Author’s Name: Abdullah Al-Shaalana)
View Affiliations
Electrical Engineering Department, King Saud University, 11421, Riyadh, Kingdom of Saudi Arabia
a)Author to whom correspondence should be addressed. E-mail: shaalan@ksu.edu.sa
Adv. Sci. Technol. Eng. Syst. J. 4(2), 34-39 (2019); ![]() DOI: 10.25046/aj040205
DOI: 10.25046/aj040205
Keywords: Load, Reliability, Energy, Cost, Interconnection, Planning
Export Citations
In this paper, the impact of interconnection among isolated and dispersed electric power systems have been Investigated and analyzed. Therefore, the methodology proposed in this work is implemented in three real electric power systems in the western part of Saudi Arabia (designated as I, II and III). The outcome of this study revealed positive benefits resulting from power systems interconnection for reliability enhancement as well as cost saving.
Received: 06 October 2018, Accepted: 15 February 2019, Published Online: 07 March 2019
1. Introduction
This paper is an extension of work originally presented in the “2017 9th IEEE-GCC Conference [1].
Power systems interconnection is an effective way of raising reliability levels and in the meantime lowering their static and spinning reserves. The diversity between various systems in their peak demand and load variations encourage these systems to be integrated and interconnected via one unified grid. Reliability evaluation techniques can be used to determine the optimal system reliability risk level. The systems interconnection provides mutual assistance among interconnected system as well as reducing their reserve capacity periodic additions. Also, systems interconnection will elevate the degree of coordination and cooperation by establishing efficient and more and more efficient and larger electric power facilities. This necessitates the advent and implementations of various modeling techniques and reliability methodologies [2-7]. The Loss of Load Expectation (LOLE) is considered to be the most widely adopted and utilized reliability measure by the electric utilities and system planners [3]. This index specifies the average length of time that unit(s) is being out of service causing power outages for a specified period of time. There is another complementary index known as the Expected Energy not Served (ϵENS) which evaluates the size of energy that is curtailed due to unexpected severe power outages occurrence) [8].
2. Review of Some Existing works on Power Systems Interconnection
For the purpose of exploring other methodologies, practices and experiences adopted in the process of power system interconnection, the following existing research works are overviewed and discussed. In [9], the environmental benefits have been assessed and evaluated based on power system interconnection point of view. The author showed analytical findings of reductions environmental reductions carbon and in taxes, which can be obtained should power system interconnection achieved. In [10], the need for systems interconnection in developing countries has been highly emphasized through national grids and as a prerequisite with integrating with other neighboring countries. In [11,12] the authors discussed the interconnection among the Arab Gulf states and the potential benefits that accrue as a result of this historic milestone. In [13], the author proposed a probabilistic model to evaluate capacity assistant transfer between the interconnected systems to be ready against any unexpected deficit or emergency state. This model has been applied and substantiated on the IEEE Reliability Test System and gave promising results. In [14], the author demonstrated safety measures due to mutual system interconnection that can be abided by and utilized in power system reliability evaluation and utilization in cost/reliability benefit tradeoffs for long-range systems expansion plans and costs assessments process.
From the preceding review of the existing research works devoted and focused on systems interconnection, it is shown that the most widely adopted and applied is the reliability modeling and evaluation that ought to be considered at every stage of electric system installation, commissioning, operation, and interconnection nationally or internationally.
3. Interconnected Power Systems
Electric power systems can be interconnected in several configuration methods, as shown in Figure (1). These configurations are subject to systems site, size of power, peak loads occurrence, fuel proximity and level of mutual influence and impact. Figure (1) shows different ways of system interconnection arrangements.
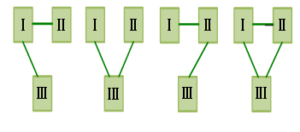
Figure 1: Configuration arrangements of interconnected systems
4. Reliability Evaluation of Interconnected Systems
In case of interconnected power systems, let us consider two integrated power electric systems, say, system (I) and system (II) where each one is maintaining its rated power capacity and demands, and along with the three postulates mentioned below:
- systems are ready to share their available spinning reserve to back up the other system if a tie-line exists.
- systems can assist each other’s only if there are an adequate reserve and a connecting tie-line.
- the connecting tie-line has a capability to transfer the capacity assistance .
Figure (2) interprets the above three assumptions, as the deviation between: (i) with no tie-line and (ii) with tie-line is the capacity assistance that is provided to system (I) by system (II) through the tie-line interconnection. This capacity assistance ( ) substitutes the capacity shortfall in system (I) and enables it to cover its standing demands adequately rather being independent and isolated.
5. Adopted Criterion for the Case Under Study
In this case study, a criterion based on a simulation process has been established that can simulate the adopted criterion and its techniques applied for this case under study. Figure 3 and the subsequent steps explain the conceptual operations of the adopted computational Algorithm.
5.1. Systems are dispersed and independent:
- Prepare the data pertinent to the studied systems (ss).
- Use the ( ) for for all units residing in the system to establish the for the system.
- Combine the with the load duration curve for process.
Evaluate the ) risk level for each separate system and compare it with the prescribed reliability level ( ).
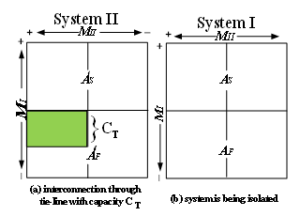
Figure 2: Capability of system B to assist system A
- Prepare the data related to systems considered for the study.
- Build the ( ) for the interconnected systems.
- Repeat the preceding steps (c-g) mentioned in 4.1. The capacity assistance ( is the available reserve that can be transmitted through the connecting line to the system being in deficit and viable to be assisted. For reliability evaluation, the system being assisted can then proceed as an isolated system for risk level evaluation.
6. Developed Approach to an Existing Systems
In order to substantiate the proposed preceding techniques, an existing real case study has been considered. This case represents three electric power systems in three large cities in a fast-developing country. These systems supply these cities and each system is designated as I, II and III respectively. These cities are facing tremendous future load increase as a result of population growth and industrial project expansion in realization to the Kingdom 2030 vision.
For the purpose of this study, a generation expansion planning spanning over the coming five-year period (2018-2023) to determine the appropriate timely capacity reinforcement schedule capacity-addition and evaluating the reliability level for each power system before and after the proposed interconnection commission. The target is to investigate and realize the resulting economic and technical benefits that may accrue due to electric power systems integration.
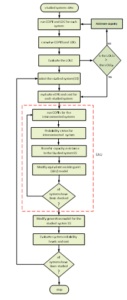
Figure 3: Simulation methodology applied in the proposed case study
6.1. Systems interconnection technical merits
This part tries to analyze and evaluate the risk levels for each electric power system separately for future specified period assuming that there are no capacity additions to the systems. With lack of capacity addition, the reliability level will deteriorate due to reserve reduction and capacity shortage. At each year the reliability level exceeds the prescribed limit either a new generating unit must be added or an interconnection with another adjacent power system may be a favorite solution. The results shown in Figure (4), display the outcome of the study pertinent to systems (I) and (II) as investigating their reliability risk levels while they are being isolated during the upcoming five years applying the LOLE reliability index. From the figure, it is obvious that if the prescribed level of the LOLE is set at 0.10 d/y, both systems will surpass the specified reliability prescribed limit. Hence, an additional capacity should be added to the existing capacity of each individual system to upgrade their reliability against any service deficit due to unexpected service interruptions and consequent power deficit and shortage. After envisioning of mutual interconnection among power systems, the process was performed again to the same systems. The outcome is displayed in Figure (4), and it is evident from the figure that risk limits for both systems have been enhanced when systems are being interconnected. Consequently, system (I) requires no unit(s) addition up to 2021, while system (II), it will go over its risk levels at 2022.
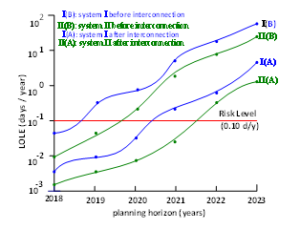
Figure 4: Systems LOLE before and after interconnection
To ascertain and exhibit the benefits accruing due to systems integration in improving and upgrading their reliability levels, the impact of interconnection for another essential complementary risk index (ϵENS) mentioned previously, has been evaluated. Systems (I) and (II) have been selected for this analysis and demonstration as being the largest among the three systems. The outcome is exhibited by Figure (5) where it indicates the size and amount of energy not supplied (ϵENS) that has been reduced after systems being interconnected.
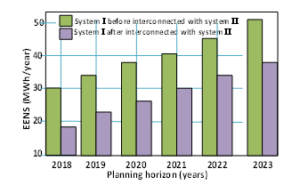
Figure 5: ϵENS before and after interconnection
6.2. Systems Interconnection economic merits
This analysis focusses on searching and exploring the possible economic merits that may accrue due to systems interconnection. The study covers the same period of study (2018-2023). The prescribed risk index ( has been fixed at 0.1 d/y for the three systems and considered to be steady over that planning horizon. The reliability level at the beginning year (i.e. ) due to load demand increment. To maintain the reliability level at the prescribed limit specified previously by the utility executive management, unit(s) additions either should be added (in case of isolated system) or ought to be integrated with neighboring electric power systems. For assessing and estimating the unit(s) added cost for this process, the methodology demonstrated in Section 4 was applied. Figure (6) displays the analysis outcome of this study where it is evident that all systems will gain from the interconnection process where there will be substantial savings in fixed cost and variable costs. This can be observed as 55%, 51%, and 62% for systems I, II and III respectively. Moreover, the reliability level for each system will improve and attain better reliability levels as demonstrated in earlier sections.
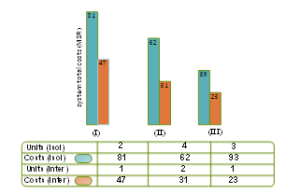
Figure 6: Cost for isolated and interconnected systems
7. Searching for Optimal levels in Reliability evaluation
Searching for optimal levels in system planning process is a major endeavor and concern for all utilities, planners, engineers and economists to guarantee adequate and reliable supply at reasonable and acceptable tariff. Hence, extensive and rigorous factors investigations and analysis based on econometric indicators and variables related to units installation, transmission networks and operations should be conducted and explored. Therefore, the reliability indices, namely, the (LOLE) and the(ϵENS) have been applied to system (I) utilizing the concepts shown in the Appendices and the simulation process shown in Figure (3) above.
In order to obtain the optimal range of reliability levels, the system investment cost should be convolved with the anticipated outages losses [7]. The costs of system represent the expenditure for unit installation cost, and fuel and maintenance cost. Outages costs represent the losses cost borne by the consumers as a results of energy cease. The total system cost portrays the overall cost sustained by the consumers as a worth of uninterrupted energy flow. The outcome of the process yields the results shown by Figure 7 as system cost (SC) tends to increase as level of reliability level increases. In the meantime, the outage cost (OC) starts to decrease as system reliability improves with generating units’ additions. The optimality of reliability levels varies between 0.16 and 0.27 days/year (see Fig. 7). However, adding new capacity in some cases may not imply the perfect resolution to encounter ever increasing load growth and preserve desirable levels of reliability. Hence, it may be better to improve unit’s efficiency and performance by regular scheduled maintenance. Likewise, establishing a consistent co-ordination and co-operation between the demand-side and the supply-side may further improve energy consumption and reduce financial obligations.
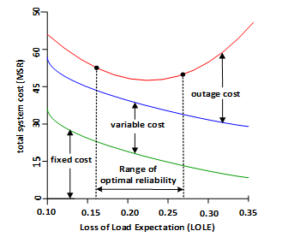
Figure 7: reliability levels Variation vs. variation of system cost
8. Conclusion
In this work, the merits of interconnection among isolated and dispersed electric power systems have been explored, analyzed and assessed using recent developed reliability criteria. The methodology proposed in this work was conducted for realistic electric power systems serving major cities in a fast-developing country. The outcome of this work revealed positive benefits that can be attained as a result of power systems interconnection. These benefits and merits can be interpreted in systems reliability improvement and cost saving.
Appendix A – Power System Costs
The general aspects of power system costs can be documented as follows:
- Fixed Cost (FC): costs associated with establishing the power plant (site, generating units, transformers, protection and control facilities, auxiliaries, etc.):
- Variable Cost (VC): cost related to the cost of operation and maintenance (fuel, scheduled maintenance, interim spare parts):
- Outages Cost (OC): cost that incurred by the consumers as a result of power interruptions and energy curtailment (this type of costs is not transferable and ought to be assessed and evaluated through public investigations and questionnaires):
Hence, the above costs constitute the total system cost (TC), and can be expressed as:
Appendix B- Some Pertinent Reliability Index
Loss of Load Expectation (LOLE)
The LOLE risk index is the most widely accepted and used probabilistic method in power system reliability evaluation of generation expansion planning. It is defined as: “the expected number of days in the specified
period in which the load levels will exceed the available system capacity”. To evaluate this risk index, two models are required and employed. One is the Load Duration Curve (LDC) which the load levels are arranged in a descending order of magnitude, and the other one is the Capacity Outage Probability Table (COPT) which contains all capacity states of the generating units with their associated probabilities. These two models are convolved (combined) in the process. The unit of the LOLE is in days per year (d/y). The LOLE evaluation method is expressed in the following mathematical formula:
It is clear from the above load characteristics that those capacity outages less than the reserve will not cause a loss of load yielding a “Demand not Supplied” to the consumers. Consider now:
the ith outage(s) state in the COPT
number of times unit(s) is unavailable
the probability of this ith unavailable
Expected Energy Not Supplied ( ENS)
Since the un-supplied energy caused by power outages reflects great damages and heavy losses to the entire consumers’ classes, so, another essential and most needed reliability index known as the ENS can be deduced as follows:
Appendix C- Energy Production Methodology
The Expected Energy Supplied (ϵES) by each unit available and being operated in the system can be evaluated by using the above concept of the Expected Energy Not Supplied (ϵENS) as shown below:
MWh/year
This method adopts a priority loading order, i.e. the generating units are loaded according to their least operation cost. Hence, operating, first, the most efficient and economical operating units (called the base units), followed by the more cost operating units (called the intermediate units), then the costliest operating units (called the peaker units), and so on. This means that the least cost operating units occupy the lower levels in the LDC, and the expensive operating units occupy the upper levels in the LDC respectively.
The above equation can be explained in the following process:
- The LDC (Load Duration Curve) is implemented, as it is the type of curve that is widely used in power system reliability evaluation and planning for its convenience and flexibility. It is derived from the ordinary load curve and hence can be defined as “the arrangement of all load levels in a descending order of magnitude.
- The expected energy not supplied before any unit is operated = the total area under the LDC.
- When the first unit (C1) is loaded according to the priority loading level # 1, it will occupy the green area (0 – C1) and shifts the new expected energy not supplied upward (i.e. above C1. Therefore, the expected energy supplied by unit C1 will: be = – .
- When the second unit (C2) is loaded according to the priority loading level # 2, it will occupy the area (C1 – C2) and then shift the new expected energy not supplied upward above C2. Therefore, the expected energy supplied by unit C2 will be = – .
- When the third unit (C3) is operated according to the priority loading level # 3, it will occupy the area (C2 – C3) and then shift expected energy not supplied above C3, and then the process ends and the remaining expected energy not supplied will be above C3. As such, the expected energy supplied by unit C3 .
- A. M. Al-Shaalan, “Management of Power Systems Interconnection to Realize Technical and Economical Potentials”, 2017 9th IEEE-GCC Conference and Exhibition (GCCCE), Gulf Hotel, Manama, Bahrain, 8 -11 May 2017.
- R. Billinton, R. N. Allan, “Reliability Evaluation of Power Systems”, (Book), Second Edition, Plenum Press, London, 1985.
- R. Billinton, “Reliability Assessment of Bulk Electric Systems,” Power System Research Group, University of Saskatchewan, Canada, Publications No. 148, 2007, p. 75.
- J. Endrenyi, “Reliability Modelling in Electric Power Systems”, Wiley International Publication, 1978.
- L. Leonard, L. Grigsby, “Power Systems”, Power System Planning (Reliability Part 3), 2009 by Taylor and Francis Group, LLC.
- IEEE Bronze Book on Recommended Practice for Energy Conservation and Cost-Effective Planning in Industrial Facilities. New York: IEEE, 1993.
- A. M. Al-Shaalan, “Reliability/Cost Tradeoff Evaluation for Interconnected Electric Power Systems”, International Journal of Computing and Digital Systems, ISSN (2210-142X), Int. J. Com. Dig. Sys. 6, No.6, pp. 371-374, Nov-2017.
- A. M. Al-Shaalan, “Reliability evaluation in generation expansion planning based on the expected energy not supplied”, Journal of King Saud, Engineering Science, Vol. 24, No. 1, January 2012, pp. 11 – 18.
- Y. K. Jaeyoung, “Environmental impacts and benefits of regional power system interconnections for the Republic of Korea”, IEEE Conference, Power Engineering Society General Meeting, Changwon, South Korea, 6-10 June 2004, pp. 427 – 433.
- A. M. Al-Shaalan, “Essential aspects of power system planning in developing countries”, Journal of King Saud, Engineering Science, Vol. 23, No. 1, January 2011, pp. 28 – 32.
- E. S. Ibrahim, “Interconnection of electric power systems in the Arab world”, IEEE Power Engineering Journal, Volume: 10, Issue: 3, 1996, pp. 121 -127.
- O. A. Al-Zeer, “Assessment of Economic and Technical Advantages of the Tie-Line Interconnection Among the GCC States Networks, MSc. Thesis, College of Engineering, King Saud University 2009.
- G. Hamoud, “Probabilistic assessment of interconnection assistance between power systems”, IEEE Transactions on Power Systems, Volume: 13, Issue: 2, pp. 535 – 542, 1998.
- Mo-Shing Chen. “Security issues of power system interconnection”, IEEE Power Engineering Society, General Meeting on System Improvement and Saving, June 12-16, 2005, pp. 1797 – 1800.
