LabVIEW Development for an Intelligent Management System of the Electrical Energy Free Market

Adv. Sci. Technol. Eng. Syst. J. 4(2), 83–90 (2019);
 DOI: 10.25046/aj040211
Consumers of electrical energy have looked more closely to the energy consumption in last years due to the successive increase of the electricity bill. Nowadays it is possible to notice that many consumers have been looking for ways to reduce their consumption or the value of their electricity bill. Such a cost reduction is obtained mainly by means of own generation, distributed generation, investment in electrical efficiency, migration to the open market, or intelligent demand management. Considering that there are opportunities to reduce the bill at the end of the month for consumers that opt for the Free Market, particularly companies that has the possibility to reduce their energy consumption, is proposed here the development of a system (hardware and software) implemented in LabVIEW and hardware resources of National Instruments company, to make an intelligent demand management system for a free consumer. The program looks optimize the financial results through the demand response concept taking advantage of the price difference in the spot market. A study was done for the Federal University of ABC – UFABC in Santo André Brazilian city looking for check the implemented system. Authors hope that the results obtained with this system can help companies and consulting firms in the decision-making process as some companies can eventually adopt the energy open market. Therefore, this article seeks contribute to the reduction of monthly costs of companies through the developed system. The importance of this system lies in the fact that it is possible to identify loads considered as non-priority and can therefore be temporarily disconnected in order to maintain energy consumption within the limits established in contracts with the energy concessionaire. The results presented here are quite promising taking into account that the intelligent management of demand in the free energy market is still underexplored.
1. Introduction
Nowadays, we see a race for energy consumption to be efficient and optimized, with companies in general (public or private sector) seeking the most diverse opportunities to reduce energy bills. In this context, there is an opportunity for some consumers to migrate to the free energy market. Migration allows a reduction in energy cost. However, it is possible to go further through intelligent management of energy demand. The migration to the free market causes the contracted energy price to be lower than the price practiced by the local distributor. However, within the energy market itself, there are times when the spot price (short-term price) is higher or lower than the contract price.
Through intelligent consumption management, it is possible to further reduce the value of the energy bill if demand responds to these prices. For these reasons, this work is inserted in an extremely current context. This work will present analyzes for a university campus in Brazil seeking to reduce its cost of electric energy through the intelligent and automatic management of demand, taking advantage of price changes in the free energy market to reduce consumption at the best times, so that the consumer not only benefits from the reduction itself but also receives a financial value for the reduction obtained. Therefore, a LabVIEW program for free energy consumers will be developed.
In the energy market, reference is made to the amount of energy as MWmédio (MWaverage). Generally, the contracts entered into in the free market have the energy amount in MWmédio. MWmédio is the volume in MWh divided by the hours of the analyzed period. That is, the average consumption per hour. Thus, a consumption of 1 MWmédio, for example in January (31 days * 24 hours = 744 hours), means 744 MWh.
1.1. The Free Energy Market
The Brazilian energy market is currently divided into the regulated contracting environment (ACR) and free contracting environment (ACL). Each of these environments are distinct models of the market that have certain rules foreseen by law. In ACR, the consumer pays for their energy consumption based on the energy tariff of their local distributor. The distributor, in turn, carries out the hiring at auctions held by the Electric Energy Trading Chamber (CCEE), operations that are formalized by regulated contracts, and only passes on the price of the contracts to its captive consumers. In this hiring environment, the consumer has no way to improve or manage the price of his contracted energy. In the ACR environment, consumers have as compulsory energy suppliers the distributor, at a regulated tariff, and are called captive consumers [1]. In the ACL, the consumer can contract his own energy from any generator or marketer of energy in the country through bilaterally negotiated contracts, being able to negotiate his own price and buy his energy in the moments in which the prices practiced are more attractive. Consumers operating in this market by purchasing electricity in freely negotiated bilateral contracts are called free consumers [2].
Part of the power generators can sell energy in both environments, and energy marketers can only sell energy in the ACL [2,3]. The main motivation for a captive consumer to become free consumer is the immediate cost reduction after migration from one environment to another. However, ACL is still restricted to large consumers. Only consumers with a demand contracted with the distributor over 500 kW can migrate to the free market. A key difference between the ACL and ACR for the consumer is that in the ACL is directly subject to the impacts of a spot price. This spot price is called the Spot Settlement Price (PLD) and is calculated weekly before the beginning of the operating week of the system. From the scheduling of the dispatch of the electric power plants the PLD is calculated, which corresponds to the marginal cost of operation of the system (CMO). This price targets the differences between generation (or consumption) and spot market contracts. Therefore, the PLD is calculated by evaluating the current and future state of the water stored in the reservoirs, the fuel cost of the thermoelectric plants, the optimal proportion of hydraulic generation, thermal and the interchange between subsystems considering an acceptable risk for the system.
1.2. Motivation
The reduction of energy costs to a consumer after the migration is immediate. In other words, the free market by itself provides financial savings for its consumers. However, there are still opportunities not used by consumers, such as intelligent demand management, taking advantage of the hourly variation of the PLD to maximize financial results. The present study was based on a Campus of the city of Santo André, state of São Paulo, Brazil. The algorithm developed in LabVIEW will be used to gauge the gain that could be obtained in the Campus if the migration to the ACL environment is done. It is important to mention that currently free market models are used in various parts of the world, such as in various markets in the United States, Canada, European Economic Community, Latin America, and in Asia, countries such as Australia, New Zealand, China and Japan, has adopted this model, and each market has its own peculiarities [4].
1.3. Objective
The objective of this work is to develop a LabVIEW algorithm and a system that allows to make the intelligent management of energy of a consumer in order to assist in decision making within the scope of demand response in the ACL. Intelligent demand management in this context is still little explored in the way it is proposed in this work. Therefore, we propose an experimental apparatus that was assembled using a National Instruments CompactDAQ as well as suitable interface modules that operate in connection with such hardware. The results of this experiment may help companies in decision making related to the management of loads (on or off loads), since the developed algorithm indicates when it is financially feasible to disconnect a load set to sell contracted energy surplus in the ACL. It is necessary to point out that the present study does not take into account the energy demand profile of the companies, but even so, the algorithm assists in determining the economy from the appropriate shutdown of loads at certain times of the day. The results of this work can be used by companies together with specialized consultancies for better decision making. The consulting firms themselves could use the system as presented here.
Main contribution of the proposed system is to help the energy customers to obtain costs reduction of energy bill. The system allows identify load as loads with non-priority so them can be temporarily disconnected in order to maintain energy consumption within the limits established in contracts with the energy concessionaire. This initiative is important as the demand management for customers of the energy free market is still little explored.
The paper is organized as follows: Section II presents the general concept of demand response; Section III explain the concept of demand response to free consumers within the Brazilian energy market; Section IV presents the demand response program developed in this paper; in section V the results of this work are discussed; in section VI the main conclusions are drawn.
2. Demand Response Concept
The demand response takes place when the consumer makes an adjustment in their consumption profile in response to some stimulus. That is, the demand response can be defined as the payment of incentives designed to induce a lower consumption of electricity at times when prices are high or when system reliability is impaired. A demand response policy can result in three general types of consumer responses: The first, known as load shedding, occurs by reducing electricity consumption during peak periods of the system, when prices are higher, without the consumption pattern of other periods is changed. This measure results in a loss of momentary comfort for the consumer. An example of this type of response is when the thermostat settings of heaters or air conditioners are changed temporarily [5]. A second type of response, called load shifting, is when consumers respond to high prices by shifting consumption at peak times to off peak times. An example would be the change of some residential activities (e.g. washing machines, dryers or pool pumps) to off-peak hours [5]. The third form of response is when the consumer uses his own generation, in which case the consumer must have distributed generation. From local generation consumers get little, if any, change in the pattern of electric power consumption. However, the generation will be providing more capacity for the system, since the system sees that the consumer has reduced its consumption of electrical energy [5].
The demand curve of consumers who are not subject to any demand response program (DR) is a vertical straight line. That is, demand is inelastic. When consumers somehow feel the short-term price changes, the demand curve becomes a straight inclined line, that is, demand is elastic. The different demand curves can be observed in Figure 1 [6].
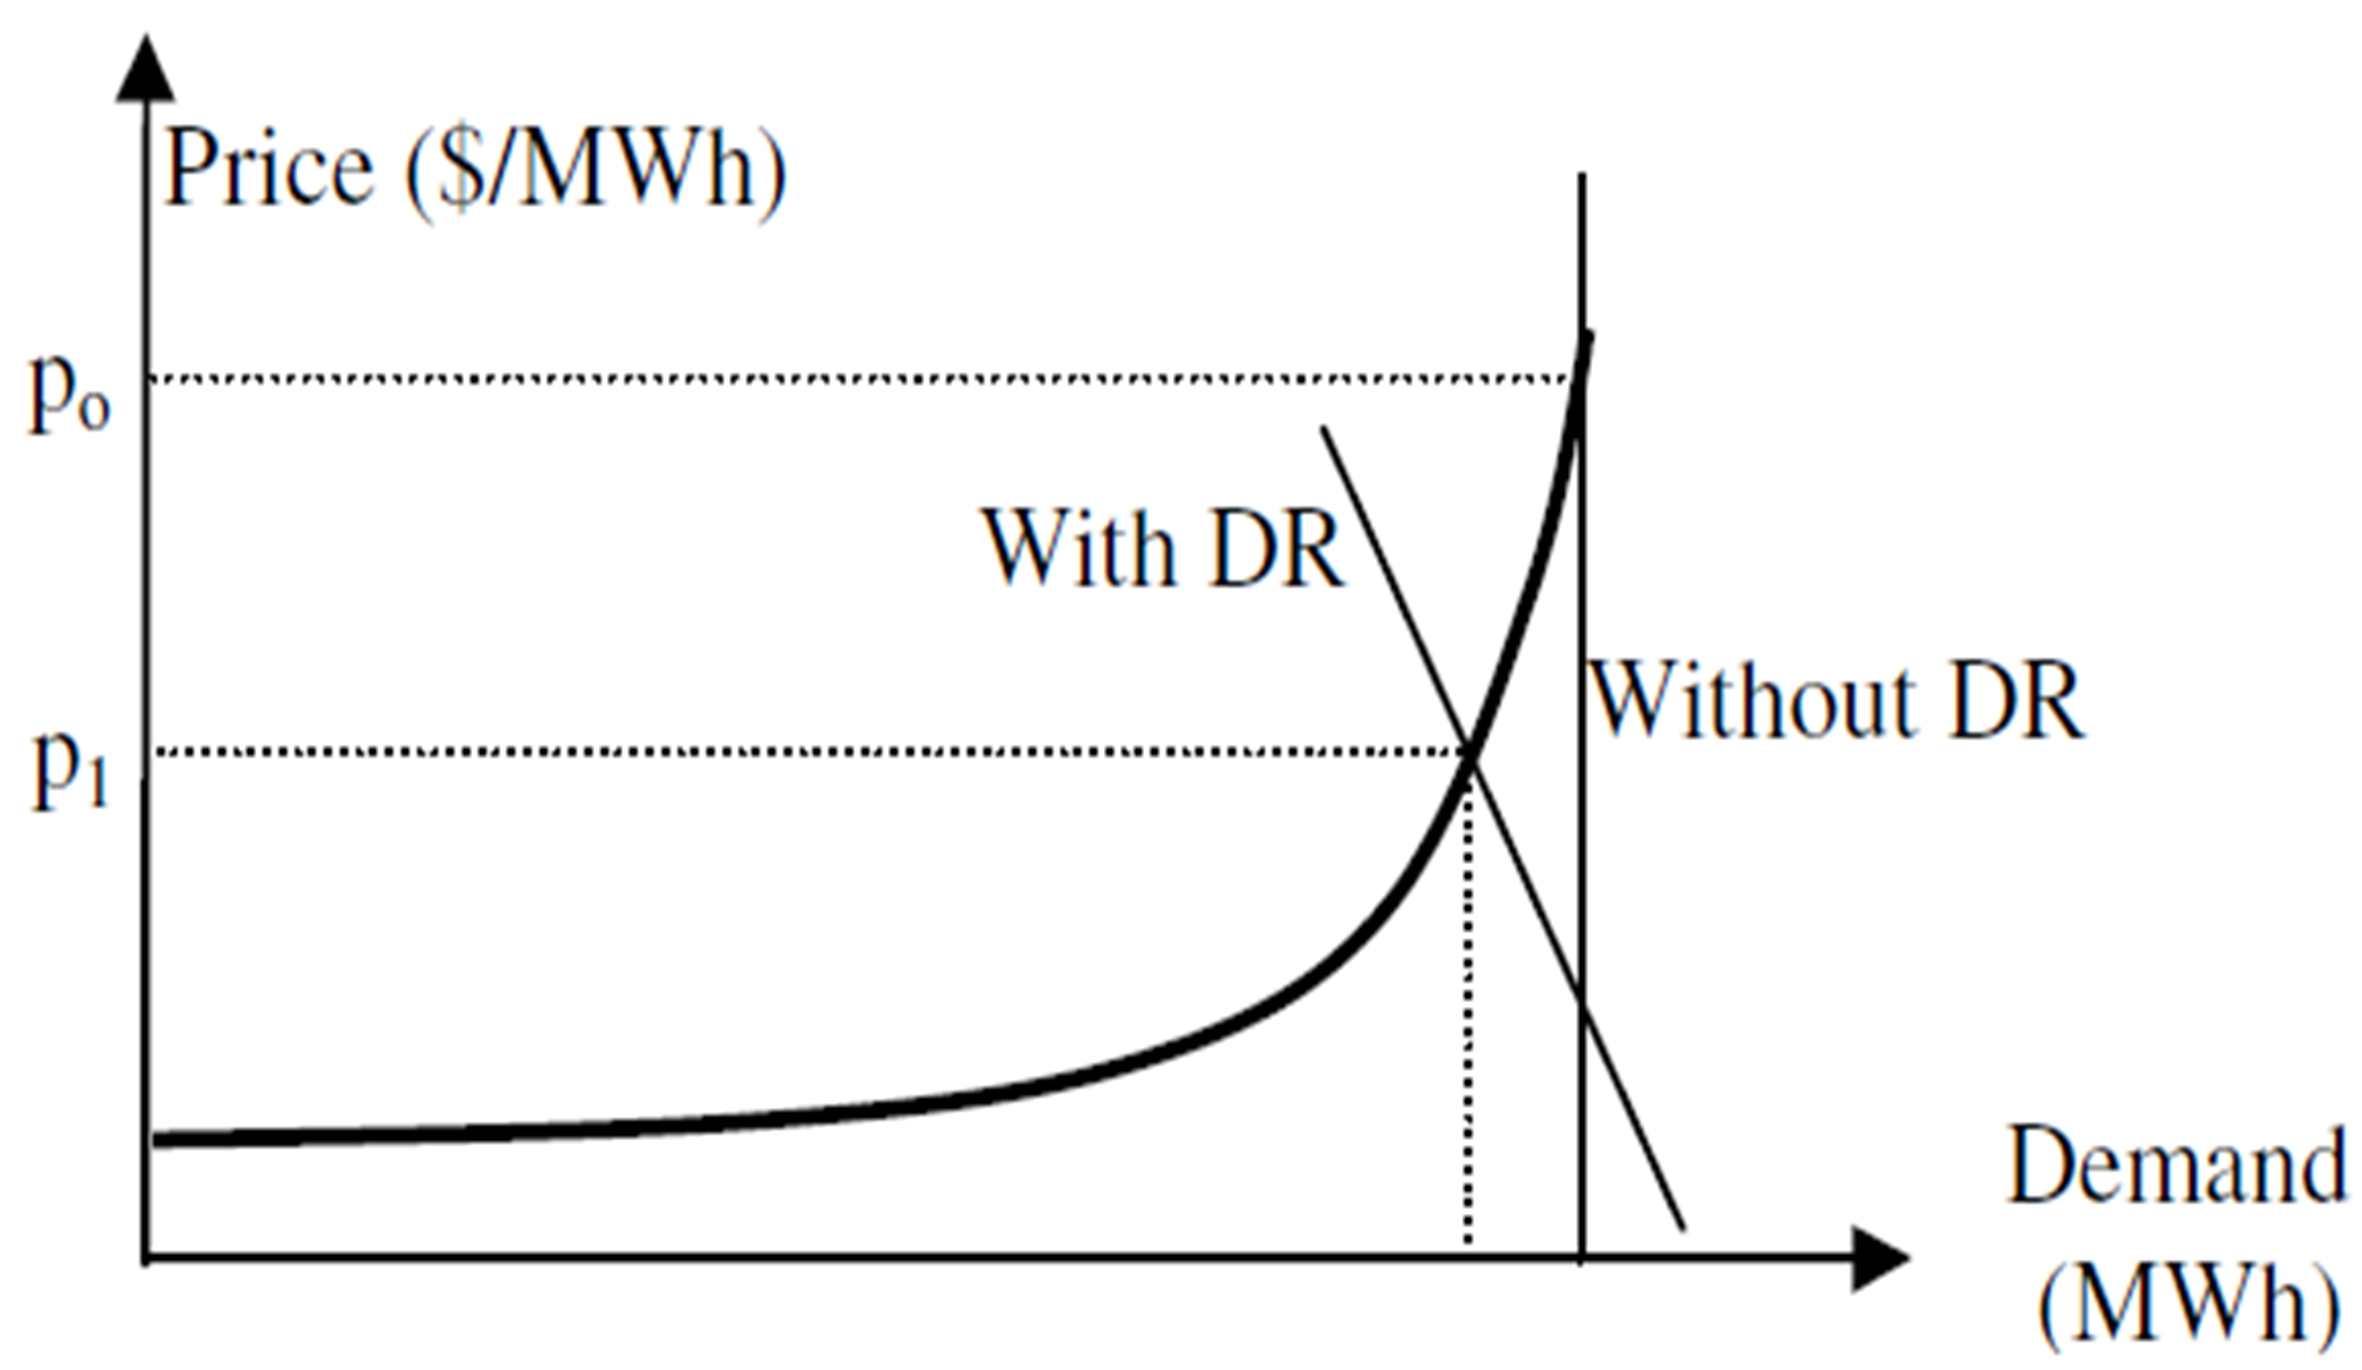 Figure 1. Simplified effect of DR on short-term electricity prices [6].
The demand response causes investments in new transmission lines and generation units to be postponed. When demand response programs act, the lines are not overloaded. In other words, the program provides more capacity for the system [7,8].
3. Demand Response Applied to the ACL
The Brazilian free energy market has a natural incentive of demand response due to the use of the PLD to compare the value differences established in the contract and consumption. The demand response in this context can be obtained through the load shedding or load shifting models. Load shedding is usually observed in commercial consumers and load shifting in industrial consumers.
In practical terms, when the consumer has more energy contracted than consumption for a certain hour of the day, it is said that the consumer has sufficiency of energy contracts at that time, which is valued to the PLD and credited to the consumer. If the consumer has less energy contracted in relation to the consumption of energy at a given time, it is said that this consumer is lacking in energy contracts, in which case the difference will be valued to the PLD and the amount must be paid by the consumer. All accounting and financial operations involving this methodology are the responsibility of the CCEE.
The mechanism of hourly determination of contractual differences means that a particular consumer can choose to reduce its consumption so that in a purposeful way might exists excess of energy as established in contract, resulting in a balance receivable by CCEE in order to reduce its energy bill power. In order this action might be successful, the consumer must map which loads are non-priority and what are the impacts of disconnecting those loads at certain times of the day.
4. Demand Management Program
Based on the aforementioned mechanism, this work proposes the implementation of a demand response program that seeks to optimize the financial result of a free consumer by cutting non-priority loads subject to a criterion that is a function of the energy contract price in the market free and spot price. There are two main parameters that should be used as a reference in a demand response program for a free consumer. These are: contracted demand with the distributor (DC) and price of energy contracted in the free market (PC). Based on these two factors and on pre-established criterion the program must make the decision to cut or not part of the load at a given instant of time. The criterion that can be pre-established refer to the definition of the loads that can be considered non-priority for the operation of the company on certain days when it is necessary to cut certain loads, and thus, be able to save energy considering the valuation in the PLD.
In the case of the demand contracted with the distributor, the decision is made based on the rule established by the National Electric Energy Agency (ANEEL) that if the measured instantaneous demand exceeds 5% of the contracted demand, that consumer will pay a higher tariff called of exceeding demand. Thus, if the program identifies an increase of more than 5% in DC, there should be a cut in the load (some loads must be temporarily disconnected) so that the consumer is not penalized in relation to the PC, criteria should be established observing the behavior of the short-term market energy price (PMC) to determine if a load-cutting action will be required. If the PC is higher than the PMC, there will be no need to cut the load. However, when the PMC is higher than the PC at any given time, part of the load must be cut off to have the power margin to be consumed in accordance with the contract. If the energy saved is large, there may be a margin of energy to be settled in the short-term market, allowing a positive financial result to be credited to the consumer included in the demand response program. The definition of non-priority load sets depends on each consumer. In the case of a university, for example, it is possible to list as non-priority and cuttable loads: set of elevators, escalators, set of air conditioners, part of the lighting of common areas, etc. The concept used to define non-priority loads is that they are loads that can be cut without generating activity and discomfort. Figure 2 shows a flowchart of a consumer for which, within a finite set of N loads, three sets of loads were defined as capable of acting in the demand response program. In this specific case, the cut-off criterion for the PMC was defined as follows, and may vary from consumer to consumer:
If PMC ≤ PC: there is no load cut;
If PC < PMC ≤ PC + 25%: there is a cut off of load 1;
If PC + 25% < PMC ≤ PC + 50%: there is a cut off of loads 1 e 2;
If PMC > PC + 50%: there is a cut off of loads 1, 2, 3.
Since the order of priority is:
Load N > Load N-1 > … > Load 3 > Load 2 > Load 1
That is, the first N-1 loads are of high priority and cannot be switched off.
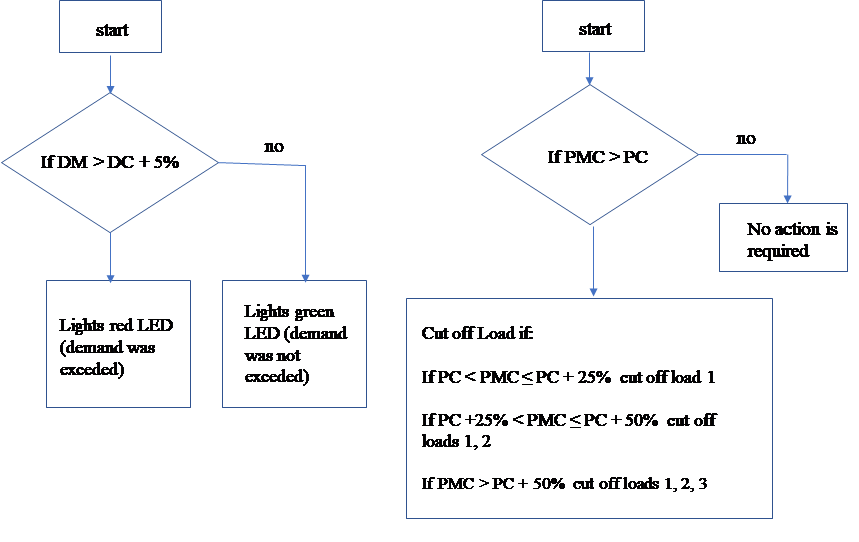 Figure 2. Flowchart for demand management program implementation [5].
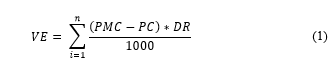
The criteria for cutting the load must be defined in a specific way for each consumer according to their load pattern. To determine the economy of the consumer that participates in the demand response program, the calculation methodology, defined in (1) [9], was used. That is, the financial economy is the sum of the period of 1 to n hours of the difference between PMC and PC, when there is the intervention of the demand management program, multiplied by the demand [9].
 Where:
VE is the economy due to the demand response in a month basis, in R$;
PMC is the price of energy in the short-term market, in R$/MWh;
PC is the contracted energy price, in R$/MWh;
DR s the reduced demand due to the demand response action, in kW;
n corresponds with the hours of the month.
When PC > PMC, there is no load cut and DR will be zero, not contributing to the sum. The value of n varies according to the number of days of the months of a given period considered in the analysis. In the case of Brazil, in the Southeast region, the value of n is 673 for a month of 28 days with the end of summer (February), 720 for a month, considering months of 30 days (April, June, September and November), 744 for a 31-day month (January, March, May, July and August) and 743 for a 31-day month with start of summer season (October). The calculation of the number of hours is determined by multiplying the number of days of the month by 24h/day, and at the begin of the summer season must be subtracted one hour in the month, and at the end of the summer season one hour in the month is added.
It is also possible to determine the hourly economy, in R$, from the action of a given load cut off by using (2) [9].
![]() Where:
Where:
VEhoraN is the economy due to the demand response in a month, in R$ during an hour N;
PMChoraN is the price of energy in the short-term market, in R$/MWh during an hour N;
PC is the contracted energy price, in R$/MWh;
DRhoraN is the reduced demand due to the demand response action, in kW during an hour N;
n are the hours of the month.
4.1. LabVIEW Implementation
Virtual instrumentation is a powerful tool for automation designers using conventional computers and specific hardware instead of traditional instrumentation. LabVIEW is software that allows the user to design programs for instrumentation, automation and process control, using a friendly interface. The CompactDAQ platform was used in this project and basically consists of a console that works in conjunction with easily configurable analog/digital input and output modules [10]. Spot energy prices are published weekly in a specific CCEE worksheet, prices that are inserted in an algorithm elaborated in LabVIEW, so that, from the date informed by the computer is able to find the corresponding spot price in the spreadsheet, providing to the management program demand updated values constantly. Details of the implementation of the algorithm can be seen in [9,11]. Figure 3 shows the spreadsheet provided by CCEE in Excel (CSV format), and Figure 4 shows the worksheet already incorporated in the LabVIEW environment which is used for calculations made by the elaborated algorithm. The import of the pricing information released by CCEE is performed through a routine that identifies the month, start date and end date information of each of the lines of the CSV file. This information is read by the program and stored in an array as shown in figure 4.
For the main demand management routine, the data of DC, PC, PCM and measured demand (DM) are used. The DC and PC variables are obtained through the signed agreement and must be informed by the user. The PCM variable is obtained through the spreadsheet provided by CCEE and the spot price verification algorithm. However, to obtain the DM it is necessary to make the acquisition of data of the demand, being necessary the use of an acquisition module of specific data for such function. That is, it is necessary to make the voltage and current measurement, or make the direct measurement through a wattmeter to inform the measured demand to the demand manager.
With the variables in hand, the algorithm presented in the flowchart of Figure 2 is implemented. The DM variable is compared to the DC variable and if DM is 5% greater than DC, a time interval is triggered to ensure that the demand is exceeded. If there is no such confirmation time, there may be undue load cuts as there may be increased demand for a short time due to activation of heavy loads. After the confirmation time is counted, the program checks the PMC (short-term market energy price) and the PC (free market contracted energy price).
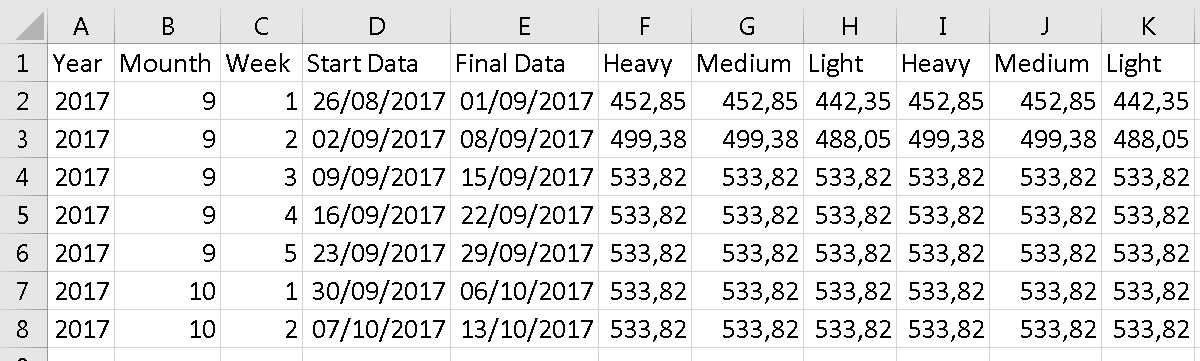 Figure 3. PLD sheet released by CCEE [5].
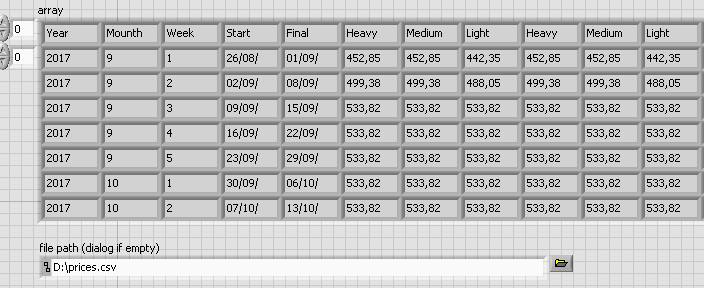 Figure 4. Importation of Short-Term Price Information (PLD).
According to the flowchart conditions of Figure 2, the result of the comparison can lead to turn off one, two, or three loads. To facilitate the implementation of this algorithm was used the MathScript tool, which allows the elaboration of programming in a similar way to Matlab. To cut only one load, the established condition for this is that PCM is between PC and PC + 25%. If the condition, however, indicates that the PCM is between PC + 25 and PC + 50%, two loads will be turned off. Three loads are cut off when the PCM value is above PC + 50%. It is important to emphasize that the criteria used for the disconnection of loads must be studied and must be according to the needs of the customer, such as the loads that must be disconnected and the adopted criteria of values between PC and PCM.
With the load-cutting information provided after processing in MathScript, the load-cutting information is decoded to be used as a digital signal. The cutoff indication occurs through signaling in the program itself and through digital signals through a specific module, and in this algorithm, each digital output represents a load. That is, when a digital signal is triggered, it indicates the cut of that load. Figure 5 shows the demand management program, while Figure 6 illustrates the experimental apparatus assembled for conducting the tests.
The apparatus of Figure 6 consists of obtaining instant consumer demand measurement through the CompactDAQ for processing in LabVIEW according to the algorithm implemented. Based on the algorithm, it will be determined whether any load set should be cut. In case of cut-off, the load-disconnection operation takes place through CompactDAQ.
In the case of load cut due to exceeded demand, a delay time (Elapsed Time in figure 7) was inserted in the algorithm to ensure that the loads are cut only if the demand is at least 10 seconds above the contracted demand plus 5% (Figure 7). That is, the LabVIEW program identifies the ultrapassing of load, but will act to cut the load only if this condition is maintained for 10 seconds. The purpose of this mechanism is to ensure that instant demand peaks, such as for example, when a motor starts, will cause the demand manager to act.
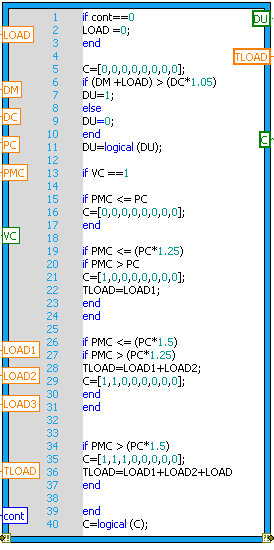 Figure 5. LabVIEW Demand Management Program [9].
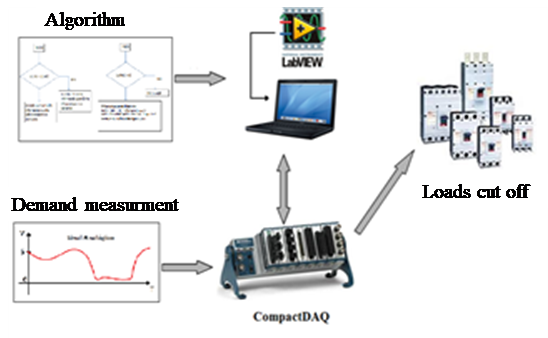 Figure 6. Illustrative pilot set-up to implement the Demand Management Program [9].
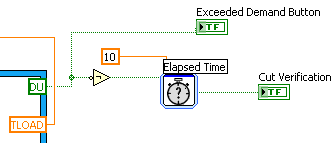 Figure 7. Delay time for load cutting action.
Also included in the program were the hourly savings in R$, savings that comes from the action of that load cut in accordance with (2) as described above. This is illustrated in figure 8.
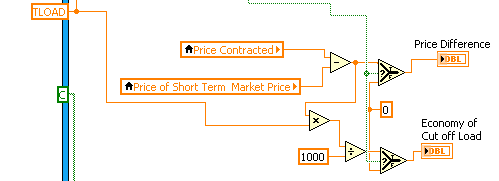 Figure 8. Hourly economy calculation included in the algorithm.
The complete LabVIEW program integrating all parts is illustrated in Figure 9.
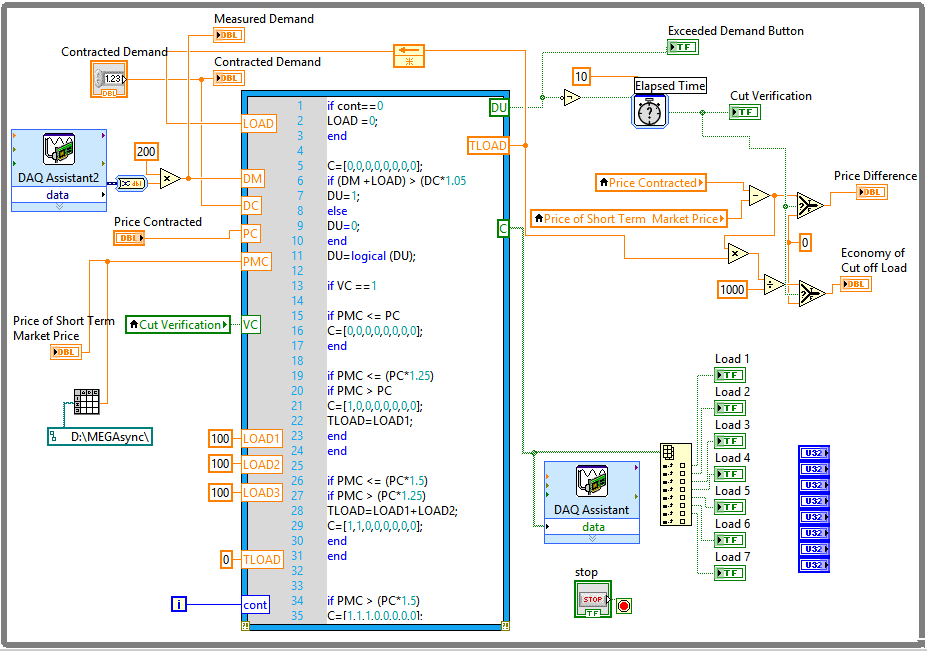 Figure 9. Complete LabVIEW algorithm of the demand management program.
4.2. Graphical Interface
In the graphical interface environment of LabVIEW an initial graphical interface was developed, shown in Figure 10, with the information of Measured Demand (kW), Contracted Demand (kW), Contract Value (R$/MWh), Short Term Price R$/MWh) and Hourly Economy (R$/h) obtained with the demand response manager. All these items are presented in the program in a simple numeric display.
In this graphical interface was inserted a button that will indicate when the instantaneous demand exceeds 5% of the value of the contracted demand, since after this limit of tolerance the consumer will pay a fine to exceed the demand. This criterion is valid for all types of consumers, whether captive or free, within or outside a demand response program. The aim of this indicator is to alert the consumer to the fine for exceeding demand, thus avoiding financial losses.
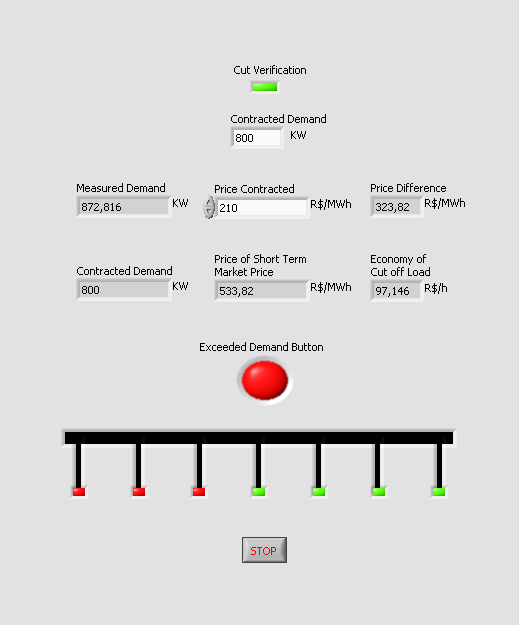 Figure 10. Graphical demand manager interface in LabVIEW [9].
Still in the graphic interface elaborated (Figure 10), there is a representation of the set of seven loads, which will be cut or re-connected, according to their order of priority. In the figure, the loads are represented by LEDs, with green LEDs representing active loads (priority), and in the red color representing loads that must be switched off in accordance with the established load-cutting criteria.
5. Test and Results
An experimental apparatus was developed that simulates the physical action of the demand response program for a consumer. As previously mentioned, a CompactDAQ was used as well as the NI-9219 and NI-9401 modules used to obtain the input and output variables, respectively, as shown in Figure 11. In this system, the input voltage on the NI module 9219, for verification purposes, represents the measured instantaneous demand. The voltage is measured and a constant conversion factor was applied to convert this information into demand values in kW.
In a practical situation, this information would be provided to the demand manager by the CT (current transformer) and TP (power transformer) of the measuring cabin equipment. A set of LEDs were connected to the output module, where each LED, as already mentioned, represents a load set. In the experiment, the LEDs lit (green LEDs) to indicate that the charging set is on. When the program sends the signal to turn off a certain LED, in practice, this action would correspond to the shutdown of that load. Figure 12 shows in more detail the highlight number 2 of figure 11, where the LEDs indicate the loads that must remain connected and the loads that must be disconnected according to the management algorithm.
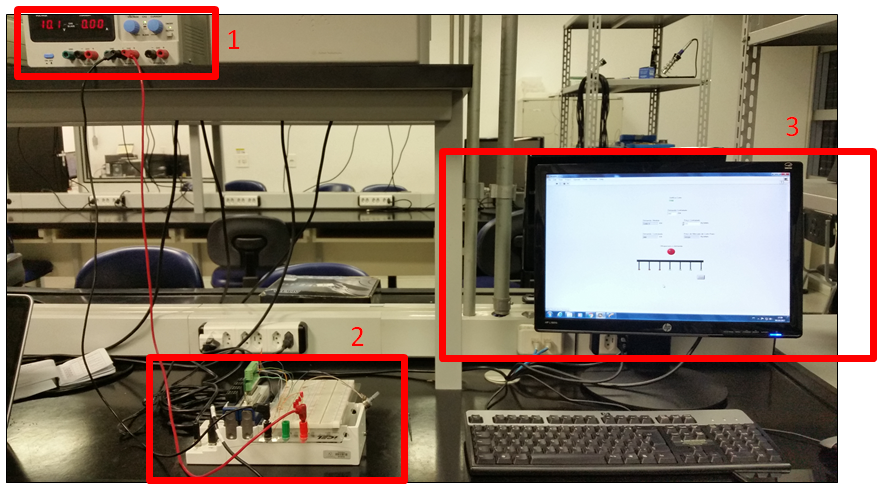 Figure 11. Experimental set-up used.
The results using the CompactDAQ were effective since, given an input signal corresponding to the measured demand, the CompactDAQ assembly was able to operate through a digital output signal that determined which output points should remain on or off. With respect to the input signal, in the experiment represented by a 10 V DC voltage source, it was obtained through a voltage divider with a potentiometer used to change the voltage.
 Figure 12. Experimental Circuit in operation.
In a practical system it would be equivalent to the output of the TC or TP of the meter, with corresponding corrections of that meter’s constants. The output module used provides the digital signal of which ports should be switched on or off. In practice, this would be equivalent to signaling which relays/circuit breakers should be on or off at any given time, and each load set should be in a different electrical installation. To complement the experiment and identify quantitatively what could be the economy provided by the proposed demand management program, we verified the results that could be obtained at the Santo André campus of UFABC. Tests were carried out considering the period from January to September 2017, considering that contracted campus demand is 1.400 kW, energy contract price of R$ 210.00/MWh and considering the cut criterion presented in the methodology of this work. Table 1 shows the results obtained.
Table 1. Results obtained with the Demand Response algorithm
| Months | Monthly Average PLD (R$/MWh) | Total Economy (R$) |
| janeiro-17 | 121,44 | 0,00 |
| fevereiro-17 | 128,43 | 0,00 |
| março-17 | 216,24 | 1.201,87 |
| abril-17 | 371,47 | 35.976,24 |
| maio-17 | 411,49 | 49.873,24 |
| junho-17 | 124,7 | 0,00 |
| julho-17 | 280,81 | 11.977,75 |
| agosto-17 | 505,95 | 67.049,14 |
| setembro-17 | 521,83 | 67.626,36 |
| Total (R$) | 233.704,60 |
By the analysis of table 1, it is possible to observe that the program of Demand Response did not result in improvement of results in the months of January, February and June. These months were times when the energy price in the short term (PLD) was lower than the contract price (R$ 210.0/MWh). The results are significant for all those months in which the PLD is higher than the energy contract price (R$ 210/MWh). In the analyzed period, from January to September, a potential savings of R$ 233.704,60 from the proposed Demand Response Program was observed, according to the values presented in table 1.
The low PLD moments happen when the electrical system is in favorable conjuncture conditions, for example, when the levels of reservoirs are within the one planned by the National System Operator (ONS) and the rains are above the historical average. When the electrical system is in unfavorable condition of rainfall and reservoir levels, the PLD rises significantly and it is at that moment that the Demand Response Program becomes interesting and creates opportunities for the consumer to reduce the energy bill with the cut load and sale of excess of energy contracted. The savings opportunities increase as the average monthly PLD increases.
6. Conclusions
A tool for intelligent demand management was developed with the purpose of using the Demand Response concept to reduce a consumer’s electricity bill in the free market. Tests were applied to the Santo André campus of UFABC. The program implementation was performed in LabVIEW and the tests were performed using the CompactDAQ hardware. The tests were enough to verify all the operation of the program in LabVIEW. Authors believe that the system developed is a novelty. The system allows the temporary disconnection of non-priority loads contributing to reduce energy consumption and consequently reducing the energy bill of the users of the free energy market.
It was verified how much the campus could economize with the demand response program based on the months of January to September 2017. As results for this period, a reduction potential of R$ 233.704,60 was observed, referring only to the demand response implemented through the Demand Management Program. It is important to emphasize that the results obtained are preliminary, and, therefore, more tests are required with the application of the developed tool. It is also important to highlight that the scenario is an example of the use of the system developed to verify both the software and the implemented hardware. Thus, the loads chosen by the authors as non-priority loads were disconnected, and, therefore, the results are representative of this scenario. Thus, the key conclusion of this paper in light of the results obtained is that, Intelligent Demand Management, by observing hourly price variations can result in an excellent opportunity to reduce free energy consumer costs and relief to the electrical system. It is hoped, therefore, that the system developed in LabVIEW can assist companies and consultants with regard to decision-making in regard to obtaining savings by migrating to the ACL.
Acknowledgments
The authors thank the Federal University of ABC for the support given to this work.
- CCEE – Câmara de Comercialização de Energia Elétrica, “General operations overview at CCEE (In Portuguese)”, São Paulo, 2013, in: www.ccee.org.br/StaticFile/Visao_Geral_das_Operacoes_CCEE_2013.pdf, accessed at: 09/30/2017.
- ABRACEEL – Brazilian Association of Electric Energy Traders, “Booklet: Free Energy Market (In Portuguese)”, in: www.abraceel.com.br/archives/files/Abraceel_Cartilha_MercadoLivre_V9. pdf. Accessed at:10/07/2017.
- Rodrigues Flávia, “Energy Contracting Programming Considering Distributed Generation in the New Model of the Brazilian Electricity Sector (In Portuguese)”, PhD Thesis, UFRJ, Rio de Janeiro, 2006.
- Luciano Macedo Freire, “Electric Energy Markets, International Experience and the Brazilian Model of Energy Trading (In Portuguese)”, in:http://www.abraceel.com.br/zpublisher/paginas/Download_file.asp?nome=…%20%C2%B7%20Arquivo%20PDF, accessed in: 03/16/2016.
- CCEE – Câmara de Comercialização de Energia Elétrica, “Free Consumers in the scope of CCEE (In Portuguese)”, in: www.ccee.org.br/search/query/redirect.jsp?qid=259786&did=3193776&pos=1&idx=1&fid=&pdfq=%22consumidores%20livres%20treinamento%22, accessed at: 10/14/2017.
- Albadi, M. H.; El-Saadany, E. F., “Demand Response in Electricity Markets: An Overview”, Power Engineering Society General Meeting, IEEE, 2007. https://ieeexplore.ieee.org/abstract/document/4275494.
- Chakrabarti, B.; Bullen, D., Edwards, C., Callaghan, C., “Demand Response in the New Zealand Electricity Market”, Transmission and Distribution Conference and Exposition (T&D), IEEE PES, 2012. https://ieeexplore.ieee.org/abstract/document/6281718.
- Jidong, L., Zehui, Z., Li, Z., Xueshan, H., “Evaluating Short Term Benefits of Demand Response”, Electric Utility Deregulation and Restructuring and Power Technologies (DRPT), 4th International Conference on. 2011. https://ieeexplore.ieee.org/document/5994079.
- Souza, R. V. X., “Migration Study of the Santo André Campus of UFABC for the Free Electric Power Market and LabVIEW Development of an Intelligent Demand Manager (In Portuguese)”, Master Dissertation, Federal University of ABC – UFABC, Santo André, Brazil, 2017.
- NATIONAL INSTRUMENTS, “Getting Started with LabVIEW”, in: www.ni.com/pdf/manuals/373427f.pdf, accessed at: 03/12/2017.
- Souza, R. V. X., Silva, A. S., Munoz, R.R., “Development of an Intelligent Energy Demand Response Program for a Brazilian Free Consumer of Energy”, in: VII Brazilian Symposium on Electrical Systems – SBSE, Niteroi – RJ, 2018. https://ieeexplore.ieee.org/document/8395579.