Assessment of Coordinated Multipoint Transmission Modes for Indoor and Outdoor Users at 28 GHz in Urban Macrocellular Environment

Adv. Sci. Technol. Eng. Syst. J. 4(2), 119–126 (2019);
 DOI: 10.25046/aj040216
The aim of this article is to analyze and evaluate the performance of Coordinated Multipoint (CoMP) transmission approach at a frequency of 28 GHz using three dimensional ray tracing simulations in an urban macrocellular environment. The new performance metric introduced in this article is the relative power usage. Other performance metrics examined in this article are received power, the Signal to Interference plus Noise Ratio (SINR), user throughput, relative throughput gain, and the percentage of overlapping area with multiple cells. Indoor and outdoor users are separately analyzed for few key performance indicators. Different cases of coordinated multipoint transmission i.e. intra-node and inter-node coordination is analyzed. The post analysis of the acquired simulation data shows that the use of CoMP functionality is more beneficial for the cell edge users compared with the other users in terms of improving the user’s experience. The throughput gain as well as the transmission overhead of the CoMP approach increases with the increase in number CoMP ports. Inter-node CoMP is much more power efficient and beneficial in comparison with the intra-node CoMP case.
1. Introduction
This article is an extension of the research work originally presented at Vehicular Technology Conference (VTC Spring 2018) [1]. In reference [1], the performance of Coordinated Multipoint Transmission (CoMP) was studied, and the performance metrics considered for the analysis were Signal to Interference plus Noise Ratio (SINR), throughput, and relative throughput gain. Whereas in this article the performance of CoMP transmission for the indoor and for the outdoor users is separately analyzed. Additional performance metrics included in this article are received signal strength, the percentage of carriers within the overlapping zone of 3 dB, 5 dB, and 7 dB, and relative power usage.
Cellular systems have evolved enormously since its inception. Current cellular technologies such as Long Term Evolution (LTE) and LTE-Advanced (LTE-A) are capable of providing data rates and capacity which are significantly higher than preceding technologies. However, the Fifth Generation (5G) of mobile communication has use cases, which have the requirement of thousand times more capacity in comparison with today’s standards. This requirement is driven by bandwidth hungry applications, and those applications require high data rates. These applications may include uncompressed high definition video streaming, analyzing huge data sets for real time monitoring, and artificial intelligence applications to name a few. Additionally, the Cisco network index (VNI) report estimates that by the year 2020 there will be approximately 1.6 billion connected devices [2]. This indicates a huge increase in the number of connected devices and the amount of data utilized by these devices and applications. Therefore, in order to fulfill these requirements, different capacity enhancement solutions are needed. Several technologies such as network densification [3], heterogeneous networks, multi Carrier Aggregation (CA), Inter Cell Interference Coordination (ICIC), Enhanced ICIC (eICIC) [4], Coordinating Multipoint (CoMP) transmission and Millimeter wave (mmWave) communications [5-8] have been proposed for enhancing the capacity of cellular systems.
Traditionally, the cellular communication utilizes the microwave frequency band (sub 4 GHz frequency range) of the electromagnetic spectrum. Different operating frequency bands have been allocated for different mobile technologies. The mmWave frequency band, which lies in the range of 30 GHz – 300 GHz has the abundance of unused free spectrum. The large unlicensed bandwidth present at the mmWave frequencies can support huge data rates which is required in case of 5G technology. The mmWaves have certain attributes such as high path loss, high Building Penetration Loss (BPL) and adverse propagation properties which make them suitable only for short range communications. However, the frequency band of 28 GHz experiences less rain attenuation and absorption [6] compared with other mmWave frequency bands. This enables the 28 GHz band to be considered as a preferred band for cellular operators for future cellular communications. Additionally, the higher penetration and path loss can be coup with large antenna arrays with high directivity. This can be achieved due to the short wavelength of mmWaves which enables the utilization of large antenna arrays at both the transmitter and receiver side [6].
Generally, a single transmission point/cell serves a user in traditional wireless communications. However, in 3rd Generation Partnership Project (3GPP) release 10 the concept of coordinating multipoint transmission (CoMP) is introduced as a part of LTE-Advance technology, and that enables the user to receive signals from multiple transmission points. The coordination between different transmission points is based on the geographical location and the spatial separation. CoMP helps to improve the quality and the strength of the received signal [9-10]. Furthermore, the coordination can occur between the cells of the same base station or different base stations [9]. Coordinated Multipoint transmission can be categorized into following three categories, (1) Dynamic Point Selection (DPS) [11], (2) Joint Transmission (JT), and (3) Coordinated Beamforming/ Scheduling (CB/CS) [12]. A key drawback of CoMP is the huge quantity of data that is transferred between the coordinating transmission points.
2. Background Theory
2.1. Millimeter Waves
5G is expected to provide extremely high data rates for end users/devices. Researchers envision a thousand-fold increase in the data rate in 5G in comparison with the present technologies such as LTE-A. Higher data rates are can be achieved by increasing the bandwidth of the system. Traditional cellular communications utilize a part of the frequency band between 700 MHz and 4 GHz, that have limited bandwidth and is already occupied by the mobile operators.
The spectrum between 30 GHz and 300 GHz constitute the millimeter wave band. The wavelength of millimeter waves is in an order of few millimeters. The underutilization of the mmWave spectrum is due to the adverse conditions that affect the propagation [6]. Rain absorption, high penetration loss, low diffraction around the obstacles and a higher path loss are some of the key unfavorable factors that affect the propagation at millimeter wave frequencies. Additionally, in urban or dense urban city type environment, the communication links with only non-line-of-sight (NLOS) paths have a great challenge. As the signal attenuates more quickly at mmWave due to various adverse factors mentioned before in this article. Due to un-favorable propagation characteristics, the mmWave was envisioned as a solution for only short-range communications, particularly at the 60 GHz frequency [14].
Large unlicensed bandwidth (up to continuous 7 GHz) present at the 60 GHz band is of the primary reason for attraction, as this available bandwidth can be used for the future cellular communications system for providing enormous high data rates. The size of the bandwidth available at 60 GHz band is comparable to the bandwidth assigned for Ultra Wideband (UWB) purposes [15]. In addition the 60 GHz band is less restricted in terms of power limits. Additionally, 60 GHz frequency band utilizes greater power in comparison with Wireless Local Area Network (WLAN) and Wireless personal Area Network (WPAN). This is due to the 60 GHz frequency band regulation that allows the use of higher power. Therefore, the higher power can compensate for the greater path loss up to some extend at 60 GHz band [14]. This enables the 60 GHz frequency band to be a viable operating frequency for future wireless communications. However, there are other factors like high path loss, high rain attenuation and higher atmospheric absorption attributed to 60 GHz band; therefore, we have focused on 28 GHz band in this article.
In the sub-6 GHz frequency band, most of the spectrum is licensed and has given by the government for various purposes. It has resulted in a shortage of free available spectrum in sub-6 GHz band. Nevertheless, the un-utilized 28 GHz frequency band can help in alleviating the problem of capacity crunch by offering large free bandwidth [6]. However, there are some drawbacks of using mmWave frequency band. Based on the fundamental laws of physics, the frequency is inversely proportional to the pathloss and that results in the limited coverage at the 28 GHz frequency [16]. Absorption in the atmosphere due to the presence of rain, fog and mist also affects coverage at mmWave frequencies. Operation at mmWave frequencies and advancement in the semi-conductor technology has enabled to place a large number of antenna elements in a small cross-section, and it results in high directivity gain [6]. An antenna array with a large number of antennas can be utilized at both the transmitting and receiving sides due to the relatively small wavelength of mmWave. Additionally, electrically steerable antennas are also practical due to the development of CMOS RF circuits and that helps in improving the communication range [6].
2.2. Coordinated Multipoint (CoMP) Transmission
The 3GPP introduced coordinating multipoint technology as part of its Release 11 for LTE-Advanced systems [4]. The CoMP technology helps in establishing coordination among the multiple sectors of the same or different macro cellular base station. The coordinated communication is established by either selecting the sectors from the same macro site or from different macro sites. Intra-site coordination means two or more sectors/cells from the same macro site provide communication to the user. In inter-site CoMP, two or more sectors from different macro sites coordinate to provide the signal to the user. The coordinated transmission helps in alleviating the interference from adjoining cells and that helps in improving the spectral efficiency of the cell. The improvement in the quality of the signal (at the cell edge) occurs as the interfering signal coming from the other port is converted into a meaningful signal in the joint transmission technique. The cell-edge uses experience a poor quality of the signal as the received signal strength from multiple base stations are in a close range in terms of power. The utilization of the CoMP technology helps in improving the throughput, not only for the cell edge users only but also for the other users [17-18].
In traditional cellular macro-sites, a single sector/cell establishes a communication link to a particular user in the downlink direction. Here, a cell corresponds to a transmission point. However, LTE Release 11 aims to provide support for coordinated transmission both on the uplink and downlink channel. CoMP overcomes the hindrance arising from the interference that is caused by neighboring cells [19]. CoMP can be classified into different categories. The categorization of CoMP depends on the presence of a backhaul connection between the transmission points that are coordinating. Scheduling also has a major impact on the CoMP subcategories [11]. The three sub-categories of the CoMP technology are 1) Dynamic Point Selection (DPS) [11], (2) Joint Transmission (JT) [19-20], and (3) Coordinated Beamforming or Coordinated Scheduling (CB/CS).
In case of DPS, a single transmission point from multiple coordinating TPs is selected during every transmission time interval. The user equipment reports the Channel State Information (CSI), the identity of the favorable transmission point and other essential information such as the resources required to the central node. In DPS, after the selection of the transmission point, the data is transmitted to UE only from the selected transmission point, and other coordinating transmission points stays in mute mode during the transmission [19]. Utilizing the joint transmission type CoMP technique helps in providing channel diversity. The simultaneous transmission of identical data from different TPs helps in achieving the channel diversity. However, a suitable combining technique must be utilized at the receiver to combine the data coming from different transmission points. The joint transmission technique can be either coherent or non-coherent [19]. The signals are precoded simultaneously in coherent transmission. However, in non-coherent transmission, the precoding of the signals are performed separately at different transmission ports. The user throughput can be improved by using a joint scheduler that utilizes the available resources in more efficiently in different load condition. However, the increase in the number of TPs increase the complexity of the joint transmission technique. In coordinated scheduling and coordinated beamforming, only the CSI is transmitted from various TPs. However, only one TP is used for the actual data transmission [20]. The interference can be eliminated by utilizing one of the CoMP techniques mentioned above. It is essential to strike a balance between the performance gain and the network upgradation cost [21]. As stated above, the increase in the number of coordinating transmission ports increases the complexity of the coordinating system. A major drawback of the CoMP technology is that there is a large amount of information exchange among the coordinating TPs. Consequently, CoMP operation requires higher channel estimation and strict synchronization among the coordinating TPs. The authors in [20] and [21] demonstrate that the spectral efficiency of the system is improved by utilizing the CoMP technique. CoMP transmission help in mitigating the interference in some cases, and provide spatial diversity.
2.3. Proposed Performance Metric
In the current Information and Communication Technology (ICT) industry there is a dire need to design energy or power efficient systems. Power efficiency can be achieved by having energy efficient architectures, energy efficient resource management, and by utilizing energy efficient radio technologies [22-23]. Utilizing simultaneous connections in addition to deploying small cells help in increasing the coverage of the network. In order to compute the consumption of power at a site, a power consumption model is presented at [24] and [25] and is given as:
![]() In equation (7), is the total power consumption of the base station, is the load-independent power consumption factor, is the load-dependent power consumption factor and is the load factor. For the BS operating at full load i.e. 100 %, the load factor is equal to 1. The load-independent and load-dependent factors included in this study of this article are presented in Table .
In equation (7), is the total power consumption of the base station, is the load-independent power consumption factor, is the load-dependent power consumption factor and is the load factor. For the BS operating at full load i.e. 100 %, the load factor is equal to 1. The load-independent and load-dependent factors included in this study of this article are presented in Table .
Table 1. Parameters of power consumption model.
| Parameter | Unit | Value |
| Transmit power per transmission port | dBm | 46 |
| Power consumption of DSP unit | W | 100 |
| Power Amplifier (PA) efficiency | % | 45 |
| Consumption of tranceiver’s power | W | 100 |
| Consumption of rectifier’s power | W | 100 |
| Consumption of fiber optic unit power | W | 7.5 |
The relative power usage ( ) in [%] is defined as follows:![]()
In equation (8), and is the power usage of the case under consideration and power usage of the reference case, respectively. The power usage of the reference case ( ) and considered case ( ) is computed as given in equation (9) and (10), respectively. In equation (9), is the time of the reference case and is defined as the time required for sending the reference amount of data ( ) with a data rate of reference case ( ) as given equation (11). Whereas, in equation (10), is the relative amount of time needed to transmit the reference data ( ) and is defined as a ratio of and as expressed in equation (12), where is the time of the considered case and is defined in equation (13) as the time required for sending the reference amount of data ( ) with a data rate of case under consideration ( ).
Details of the other performance metric i.e. area spectral efficiency, and relative capacity gain can be found at [1].
3. Simulation Environment, Cases and Parameters
3.1. Simulation Environment
A three-dimensional ray tracing simulator called “sAGA” is developed by the authors using a MATLAB platform for the simulation purpose. An ‘Image Theory’ based ray tracing algorithm is to find the propagation paths between the transmitter and the receiver. A tracing simulator requires 3D building data to accurately determine the paths between the transmitter and the receiver. For this study work, a Krunuuhaka region from Helsinki is considered. The two-dimensional map of considered area is shown in Figure 1. This type of environment illustrates an urban
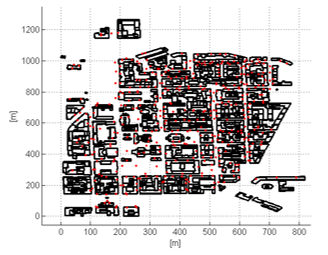 Figure 1. Simulation area.
macro cellular environment. It is assumed that users are located both in indoor and outdoor locations. For indoor users, it is assumed that there are no walls inside the indoor environment. However, BPL and ceiling penetration loss are considered for indoor users. For the outer wall with the 40 cm thickness, the wall penetration loss is 26.5 dB at 28 GHz frequency [13]. As a fairly large number of miniature antenna elements can be placed inside a small area at 28 GHz, therefore, an additional gain of 16 dB is assumed in our analysis. The basis of this additional gain is the assumption that a large array of an antenna can provide additional diversity gain, beamforming gain and combining gain.
There are ten base stations with three sectors. The height of the antenna is set at 30 m for all cells. The illustration of the antenna locations of the antennas is given in Figure 3. The users (850) were placed in the environment with approximately 85% of the users located indoors and the remaining 15% located outdoors. The indoor users are located on different floors. A floor height of 3 meters was considered for the indoor environment. The locations of users on different levels of the building are elucidated in Table.
Table 2 . User distribution.
| Number | Percentage | |
| Total RX points | 850 | 100 |
| Outdoor | 128 | 15.06 |
| Indoor | 722 | 84.94 |
| Ground floor | 269 | 31.65 |
| Second floor | 259 | 30.47 |
| Fifth floor | 160 | 18.82 |
| Seventh floor | 34 | 4 |
A. Simulation cases
Cellular networks are generally deployed with the macro layer to provide the coverage and the basic capacity to the network, and such networks are called homogeneous networks. Therefore, for the research work of this article, only homogeneous scenarios with only macro sites are considered. The simulation cases considered for this work are presented below.
3-sector site (Reference case): The reference case illustrates a case with the macro site, where only one cell (acting as the serving cell) provides connection to the user. A serving cell is selected on the basis of the strength of the received signal. In order to restrict the interference from the neighboring cells, a downtilt of 9° was considered for all the sectors, as the sites are located fairly close to each other
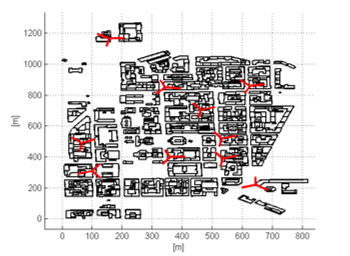 Figure 2. Three-sector site plan.
Intra-Node 2 TP: The same macro base station provides coordinated transmission by virtue of utilizing two Transmission Points (TPs). In this context, a TP represents a single sector/cell. The utilization of the same macro cellular site eliminates the requirement for a backhaul link between the coordinating cells.
Intra-Node 3 TP: In this case there is a coordinated transmission from the 3 cells of the same macro site.
Inter-Node 2 TP: This case represents a scenario where the coordinated transmission is provided from two sectors from different macro sites. As a result, a backhaul link is necessary in such a scenario.
Inter-Node 3 TP: This scenario illustrates the coordinated transmission from three cells belongs to different sites.
Inter-Node 4 TP: It involves transmission from four cells which may belong to different sites.
The antenna radiation pattern is obtained using an extended version of the 3GPP antenna model. The key parameters utilized for the antenna modeling are summarized in Table 3.
Table 3: Antenna model parameters
| 65° | 6.2° | 30 dB | -18 dB | 18.23 dBi |
Other simulation parameters are provided in Table 4.
Table 4. General simulation parameters
| Parameters | Unit | Value |
| Frequency | GHz | 28 |
| System bandwidth | MHz | 20 |
| TX power | dBm | 46 |
| Number of cells | No. | 30 |
| Antenna height | m | 30 |
| Building penetration loss | dB | 26.5 |
| UE noise figure | dB | 8 |
4. Simulation Results and Discussions
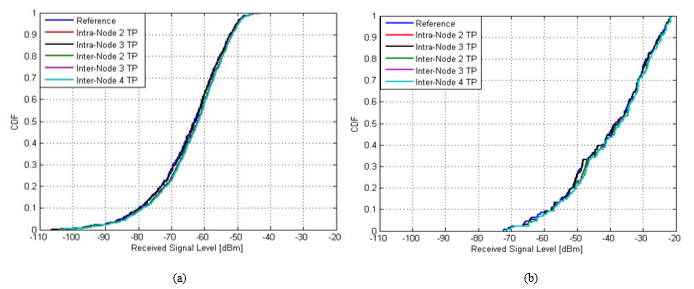 Figure 3. Received signal level, (a) CDF plot of indoor users, (b) CDF plot of outdoor users.
The first metric considered for the analysis is the received signal strength. Indoor and outdoor users are separately analyzed in this paper. Figure 3 (a) shows the CDF plots of received signal level in [dBm] for different considered cases for indoor users. It can be seen in Figure 3 (a) that almost identical received signal levels were obtained by reference cases and other coordinated multipoint transmission cases. Mean received level of -64.85 dBm is obtained with reference case, and with marginal improvement the received signal strength of -64.57 dBm and -64.56 dBm is achieved with two and three points intra-node CoMP transmission, respectively. Similarly, the maximum mean received signal strength of -63.59 dBm is acquired with four points inter-node CoMP case, and that is again not significantly better compared with the reference case. The Figure 3 (b) shows the CDF plots of received signal level in [dBm] for outdoor users. It is clearly evident that outdoor users have stronger signal strength compared with indoor users, as the indoor signal experiences the building penetration loss. Mean RX level of -40.46 dBm is obtained with the reference case for outdoor users, and mean received signal strength of -39.37 dBm is acquired with four points inter-node CoMP case.
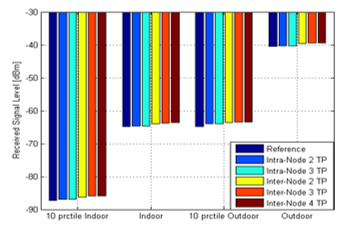 Figure 4: Bar plot of mean received signal levels.
The performance of the users within the 10th of the sample data are more critical and crucial. Therefore, we have separately targeted the cell edge users (10th percentile data) for our later analysis and comparison of performance. Therefore, we have separately targeted the cell edge users (10th percentile data) for our later analysis and comparison of performance. Figure shows the bar plot of mean received signal level for indoor and outdoor users considering the 10th percentile users and the whole data set. It is interesting to see that mean received signal of indoor users considering the whole data set is almost identical to the signal levels of outdoor users within the 10th percentile of data. Only received signal level does not tell about the actual user experience, and in order to have more deep understanding of user experience, a quality metric i.e. SINR needs to be analyzed along with signal strength.
Figure 5 (a) and figure 5 (b) shows the CDF plots of the SINR of indoor users and outdoor users for different considered cases, respectively. The reference case considered in this article offers a mean SINR of about 7.1 dB and 8.37 dB in the targeted area for indoor and outdoor users, respectively. It can be seen in figures 5 (a) and 5 (b) that the CoMP functionality has improved the SINR compared with the reference case, and the inter-node CoMP deployment is found more beneficial compared with intra-node CoMP performance. In case of intra-node CoMP deployment, it was found that increasing the number of joint transmission points (cells) from two to three shows no significant improvement in SINR, which is due to large spatial separation between the sectors of the same site. For indoor users, the mean SINR of about 9.12 dB and 9.7 dB is achieved with two and three points intra-node CoMP functionality, respectively. However, in case of inter-node CoMP functionality the gain in improving the received SINR enhances with the increase in number of joint transmission points. For indoor users, the mean SINR of 12.83 dB, 16.72 dB, and 19.30 dB is acquired from 2-, 3-, and 4-point joint inter-node CoMP transmission, respectively. A higher mean SINR values are achieved in outdoor environment, and similarly the CoMP technique improves the SINR of outdoor users as well. A mean SINR of 25.6 dB attained with 4-point joint inter-node CoMP transmission for outdoor users.
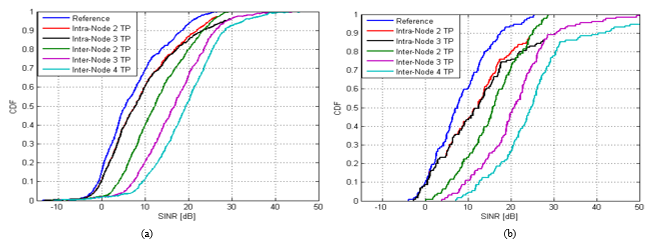 Figure 5. Signal to interference plus noise ratio, (a) CDF plot of indoor users, (b) CDF plot of outdoor users.
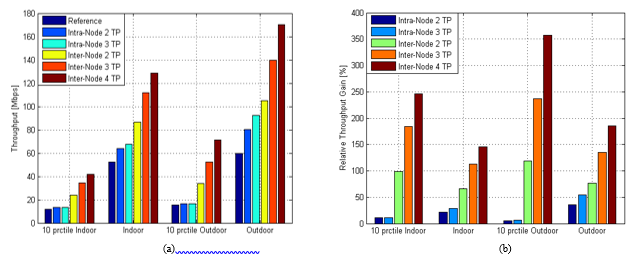 Figure 6. Throughput, (a) Mean user throughput, and (b) Relative throughput gain.
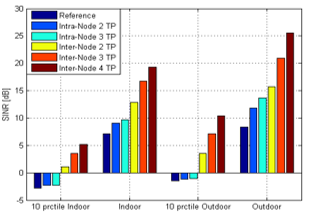 Figure 7. Bar plot of SINR.
As stated earlier, that the users within 10th percentile data are vital and figure (5) shows the bar plot of mean SINR for indoor and outdoor users considering the 10th percentile users and the whole data set. Considering the SINR results presented in 5 (a) and 5 (b) it can be said that the CoMP deployment has improved the SINR of the cell edge users by considerable margin. The mean SINR of indoor cell edge users is improved from -2.84 dB to -2.28 dB, and that means a gain of just 0.56 dB. Again, no additional sign of improvement is witnessed by increasing a number of TPs from two to three for intra-node CoMP transmission. However, the inter-node CoMP deployment improves the indoor user experience in downlink direction and provides a gain of 3.96, 6.42, and 7.98 dB by 2, 3, and 4 points inter-node joint transmission, respectively. Considering only 10th data, even higher gains are achieved in an outdoor environment and a gain of 4.99, 8.6, and 11.8 dB is provided by 2, 3, and 4 points inter-node joint transmission, respectively compared with the reference case. It shows the potential of CoMP deployment in improving the user quality at the cell edge.
The Figure 6 (a) shows the mean throughput of the users for different considered cases for indoor and outdoor environment, whereas the Figure 6 (b) shows the relative throughput gain of different CoMP cases with respect to the reference case. The “10th prctile” in Figure depicts the throughput of the users in the lower 10 percentile users’ throughput distribution. In 6 (a), although the increase in the absolute value of throughput (capacity) by CoMP is small at cell edge level, however the relative capacity gain coming from CoMP functionality is higher for cell edge users compared with overall cell users as shown in 6 (b). It is also learned from the results presented in Figure that the intra-node CoMP deployment is less efficient for cell edge users, and does not provide any significant gain i.e. around 11.01 – 11.4 % for indoor users, and 5.8 – 6.1 % for outdoor users, respectively. However, inter-node CoMP deployment can offer the maximum relative capacity gain of about 98.2 %, 183.7 %, and 246.6 % with 2, 3, and 4 points joint scheduling and joint transmission for indoor users. Similarly, for outdoor users in the lower 10 percentiles, CoMP offered relative capacity gain of about 118.6 %, 237 %, and 357 % with 2, 3, and 4 points inter-node CoMP transmission.
Table shows the results of the overlapping zone with 3 dB, 5 dB, and 7 dB window for different considered cases. The information about the number of available servers (carriers) within the window of certain dBs is commonly used by mobile operators to evaluate the design and performance of the network, and is also used as a metric of network quality during the planning process. The percentage of the area with the single server within the window of certain dBs shows the clear dominance area. However, an overlapping between the cells is required to support the handover between them. An area overlapped by multiple servers is affected by higher interference, and is called as “polluted” area with multiple servers; therefore the SINR is directly related to carrier overlapping. In Table it can be seen that the cell dominance i.e. single server area improves with CoMP functionality. With 5 dB window, the reference case has 67.48 % of clear cell dominance area which is then extended to 75.64 % with intra-node 2 point transmission. It can be also seen that no additional improvement is brought to cell dominance area with intra-node 3-point transmission, and therefore there was no additional improvement in SINR results with intra-node 3-point transmission, which were earlier presented in figure (7). However, for the cases of inter-node CoMP deployment, the cell dominance area continued to improve with the additional number of coordinated points. For the case of 5 dB window the inter-node 3 point CoMP transmission provides cell dominance area of 97.55 %, which is then further improved to 100 % with inter-node 4 point CoMP transmission. Similarly, the statistics of the overlapping zone with 3 dB and 7 dB for different cases can be found at Table . Interestingly, the results presented in Table show that on one hand CoMP extends the cell dominance area, on the other hand it diminishes the handover area with small difference of levels between the available servers, and it will help in avoiding the ping-pong effect during the handover procedure.
Table 5. Results of overlapping zone.
|
Figure shows the relative power usage of different considered CoMP cases with respect to the reference case using 10th percentile users’ data and all users’ data set. In case of a reference case, a user is connected with only one transmission point, whereas in CoMP the user is connected with multiple transmission ports, therefore utilizes the radio and power resources of multiple sources. The relative power usage of 0 % means a same power is required in the considered case as used in the reference case, and a 100 % relative power usage means twice the power is required in case under consideration with respect to the reference case.
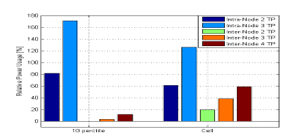 Figure 8. Relative power usage.
It is already established from the SINR and throughput results presented in figure (8) and Figure that the CoMP transmission improves the SINR of the user which in turn improves the user throughput. However, the Figure shows that intra-node CoMP transmission is not power efficient solution. It is learned from relative power usage results presented in Figure that while using two point and three point intra-node CoMP transmission, 81.2 % and 170.1 % relative additional power is required in comparison with the reference case considering cell edge users. Similarly, 61 % and 125.5 % relative additional power is required in comparison with the reference case considering whole cell data. On the other hand, inter-node CoMP techniques are quite much power efficient and work better for serving cell edge users. Two-point inter-node CoMP transmission is even more power efficient compared with reference case, and three point and 4-point inter-node CoMP has a relative power usage of only 3.2 % and 11.2 %, respectively for 10th percentile data. The summary of the results considering the whole data set is given in Table 6.
5. Conclusion
It is learned from the results presented in this article that the coordinated multipoint transmission and joint scheduling technique help in alleviating the problem of bad coverage and poor signal quality for the users located at the cell edge. It was found that CoMP is more beneficial for the cell edge users in comparison with the users located near the base station. The conventional case of 3-sector site was used as a reference case to compute the relative throughput gain for different CoMP configurations. The findings of this article revealed that utilizing two TPs in CoMP mode from the same base station provides the relative throughput of 10.32 % for the cell edge users. However, significant gain is not witnessed by utilizing three cells from the same base over two TPs from the same base station. Utilization of two, three and four TPs from different coordinating base stations yields a mean relative throughput gain of 100.5 %, 190.5 % and
Table 6 Results summary
|
260 %, respectively, for the cell edge users. Similarly, over the whole cell area the coordinated multipoint transmission from 2, 3, and 4 TPs from different nodes can offer the mean relative throughput gain of 67.5 %, 117 %, and 152.5 %, respectively.
It was also found that utilizing two TPs and three TPs intra-node CoMP transmission requires 81.2 % and 170.1 % relative additional power in comparison with the traditional single point transmission considering only cell edge users. Whereas the inter-node CoMP transmission is found much more power efficient compared with single point transmission and intra-node Three TPs and four TPs inter-node CoMP has additional 3.2 % and 11.2 % power usage in comparison with single point transmission.
It was also revealed through simulation results that CoMP deployment clearly improves the cell dominance area, and shrinks the cell border area which is overlapped by multiple servers. The results presented in this paper show the potential of CoMP transmission in overcoming the problem of cell edge users. It is learned that intra-node CoMP solution is not a power efficient technique. However, inter-node CoMP does not only improves the user experience i.e. SINR and throughput; rather it is also power efficient to use inter-node coordinated multipoint transmission. The simulation results given in this research article have been collected for an urban area of Helsinki city with the certain simulation parameters and assumptions. Therefore, performance results can vary depending upon simulation environment, setup, modeling errors and impairment, and system parameters.
- M. U. Sheikh, R. Biswas and J. Lempiaeinen, “Performance Evaluation of Coordinated Multipoint Transmission at 28 GHz Frequency Using 3D Ray Tracing,” 2018 IEEE 87th Vehicular Technology Conference (VTC Spring), Porto, 2018, pp. 1-6.
- Cisco white paper, Visual Networking Index, Feb. 2016.
- M. U. Sheikh, J. Lempiäinen and H. Ahnlund, “Advanced Antenna Techniques and Higher Order Sectorization with Novel Network Tessellation for Enhancing Macro Cell Capacity in DC-HSDPA Network”, International Journal of Wireless & Mobile Networks. vol. 5, no.5, pp. 65–84.
- 3GPP, TS 36.300 “E-UTRA and E-UTRAN Overall description: Stage 2” (Release 11), V11.5.0, April. 2013.
- H. Zhao , R. Mayzus , S. Sun , M. Samimi , J. K. Schulz , Y. Azar , K. Wang , G.N. Wong , F. Gutierrez Jr. and S.T. Rappaport , “28 GHz Millimeter Wave Cellular Communication Measurements for Reflection and Penetration Loss in and Around Buildings in New York City”, Proc. IEEE Int. Conf. Commun. , pp.1 -6 , 2013.
- T. S. Rappaport , J. N. Murdock and F. Gutierrez , “State of the art in 60 GHz Integrated Circuits & Systems for Wireless Communications” , Proc. IEEE , vol. 99 , pp.1390 -1436 , 2011.
- Z. Pi, and F. Khan, “An introduction to Millileter-wave Mobile Broadband Systems”, IEEE Communications Magazine, vol. 49, no. 6, pp. 101-107, June 2011.
- S. K. Yong and C.-C. Chong, “An overview of Multigigabit wireless through millimetre wave technology: potentials and technical challenges,” EURASIP journal on wireless communications and networking, 2007.
- T. Abe, Y. Kishiyama, Y. Kakura, and D. Imamura, “Radio Interface Technologies for Cooperative Transmission in 3GPP LTE-Advanced”, IEICE Transaction on Communications., vol. E94-B, no. 12, pp. 3202-3210, Dec. 2011.
- D. Lee, H. Seo, B. Clerckx, E. Hardouin, D. Mazzarese, S. Nagata, K. Sayana, “Coordinated multipoint transmission and reception in LTE-advanced: deployment scenarios and operational challenges,” IEEE Communications Magazine, vol.50, no.2, pp.148-155, February 2012.
- 3GPP TR36.814 V2.0.1 : “Evolved Universal Terrestrial Radio Access (E-UTRA): Further Advancements for E-UTRA Physical Layer Aspects”, March 2010.
- R. Irmer, H. Droste, P. Marsch, M. Grieger, G. Fettweis, S. Brueck, H. P. Mayer, L. Thiele, V. Jungnickel, “Coordinated multipoint: Concepts, performance, and field trial results,” IEEE Communications Magazine, vol.49, no.2, pp.102-111, February 2011.
- B. G. Choi, W. H. Jeong, K. S. Kim, “Characteristics Analysis of Reflection and Transmission According to Building Materials in the MillimeterWave Band”, Recent Advances on Electroscience and Computers, pp. 154-158, 2015.
- S. K. Yong and C.-C. Chong, “An overview of Multigigabit wireless through millimetre wave technology: potentials and technical challenges,” EURASIP journal on wireless communications and networking, 2007.
- ETSI, Accessed on 21/03/2016: http://www.etsi.org/technologies-clusters/technologies/radio/ultra-wide-band
- Digi International, Accessed on 21/03/2016: http://www.digi.com/technology/rf- articles/rf-basics.
- 3GPP, TR 36.819 “Coordinated Multi-Point Operation for LTE Physical Layer Aspects.”
- K. M. Karakayli, G. J. Foschini, and R. A. Valenzuela, “Network Coordination for Spectrally Efficient Communications in Cellular Systems,” IEEE Wireless Communication, vol. 13, no. 4, pp. 56–61, Aug 2006.
- J. Lee, Y. Kim, H. Lee, B. L. Ng, D. Mazzarese, J. Liu, W. Xiao, Y. Zhou, “Coordinated multipoint transmission and reception in LTE-advanced systems,” IEEE Communications Magazine, vol.50, no.11, pp.44-50, November 2012.
- D. Lee, H. Seo, B. Clerckx, E. Hardouin, D. Mazzarese, S. Nagata, K. Sayana, “Coordinated multipoint transmission and reception in LTE-advanced: deployment scenarios and operational challenges,” IEEE Communications Magazine, vol.50, no.2, pp.148-155, February 2012.
- R. Irmer, H. Droste, P. Marsch, M. Grieger, G. Fettweis, S. Brueck, H. P. Mayer, L. Thiele, V. Jungnickel, “Coordinated multipoint: Concepts, performance, and field trial results,” IEEE Communications Magazine, vol.49, no.2, pp.102-111, February 2011.
- Su, X. , Sun, E. , Li, M. , Yu, F. and Zhang, Y. (2013) A Survey on Energy Efficiency in Cellular Networks. Communications and Network, 5, 654-660. doi: 10.4236/cn.2013.53B2117.
- O. Adigun, and C. Politis, “Energy Efficiency Analysis for MIMO Transmission Schemes in LTE,” Computer Aided Modeling and Design of Communication Links and Networks (CAMAD), 2011 IEEE 16th International Workshop on, Kyoto, 10-11 June 2011, pp. 77-81.
- S.F. Yunas, J. Niemela, M. Valkama, T. Isotalo, “Techno-economical analysis and comparison of legacy and ultra-dense small cell networks,” in Local Computer Networks Workshops (LCN Workshops), 2014 IEEE 39th Conference on , vol., no., pp.768-776, 8-11 Sept. 2014.
- M. U. Sheikh, J. Sae, and J. Lempiäinen, “In Preparation Towards Future Cellular Network: The Detailed Analysis of Macro and Micro Site Densifcation and Sector Densification”, Journal of Telecommunication Systems. vol. 65, no.4, pp. 621–636, August 2017.