Estimation of Software Development Project Success using Fuzzy Logics

Adv. Sci. Technol. Eng. Syst. J. 4(2), 280–287 (2019);
 DOI: 10.25046/aj040236
To date, software development is vital since software is a critical element in information technology. Requirements gathering, planning, estimation, estimation, development, collaboration, testing, and deployment. The problem is when it is delivered, so it reduces the risk of the problem which could happen is important. Threat prediction should be made. It will be aimed at both the threat and control of the risks which appear when the software development is performed. Fuzzy logic is one powerful method for solving management risk problems. Since the risk management of software development influence directly to the success of software development, this study proposes that fuzzy logic for risk management problems in software development. The case study of software development projects is divided into the category of medium and small. Based on the research program, the development environment, and the Constraint Program. Each of these indicators has sub-classes and factors that explain the indicators in detail from a technical point of view.
1. Introduction
Software development has several steps, namely requirement gathering, planning & estimation, development, collaboration, testing and deployment, and the processes of software development face many problems on each step [1]. However, at each of these stages, it has its general issues. The gathering requirement has a problem where when there is an error it will produce bad software because gathering requirements describe the needs of the client. Poor planning & estimation will have an impact on the estimate of time and costs that do not fit eventually resulting in software that is of poor quality because it affects the stages of development and testing that produce many bugs. Deployment has frequent problems with software and environmental platforms that need adjustment, while collaboration has issues in human resource management [2].
Planning & estimation has a very vital role in the stage of software development. Overly optimistic estimates can lead to errors so that software development will go out of time and increase costs, but excessive estimation can also lead to the use of human resources that are not by needs, ultimately offering too much development costs [3]. This condition can cause losses to the developer and client. Risk management is needed to identify risks of failure; it useful to minimize the risks that can be detrimental to software development [4].
Risk management is a systematic process for identifying, analyzing and controlling risks in a project. Management helps identify threats to project planning and estimation (such as time, resource use, costs, etc.) [5]. By knowing and predicting threats that will occur, the project manager can determine the right steps to avoid threats that might happen or control the risks that arise [6]. The stages of software risk management consist of identification, analysis, prioritization, management, resolution, and risk monitoring. Based on studies that have been carried out the application of risk management increases the success rate of software development projects and the swelling of project costs is only 5 percent of the initial estimate [7].
In the studies that have been conducted, many methods can be used for risk management in software such as Software Risk Management, Bayesian Network, Fuzzy Logic. SERIM has been applied as a method for risk management in developing software with risk results on software development that can be calculated by predicting risks on technical, cost, schedule aspects [8]. The Bayesian Network application is applied to several studies with the results of more real risks based on the risk probability of the elements used. Fuzzy logic is one of the methods most often used to solve management risk problems [9]. Previous research show, fuzzy produces the best estimation results compared to another approach [3].
Based on the problems described, this study proposes the use of fuzzy logic to solve risk management problems at PT. Mindo Small Business Solutions (MINDO) in the software development process. Based on the risks can be used to determine the success rate of software development projects. Fuzzy logic is selected because it has several advantages including being very flexible, having tolerance for incorrect data and can work with conventional control techniques [10]. Fuzzy logic works by recognizing the value of uncertain parameters which are then connected with the rules that produce a conclusion where experts make these rules. Therefore fuzzy logic is very flexible according to the case needed [11] [12]. In fuzzy logic, there are various inference methods such as Mamdani, Tsukamoto, and Sugeno. In this study the inference engine used was Tsukamoto. Research that has been carried out the Tsukamoto inference engine has a better performance compared to Sugeno and Mamdani [13]. Fuzzy logic will be used to determine the risks in software development projects at MINDO on technical risks, costs and time. With the existence of risk management, it will help project managers in making measurable decisions to increase success and efficiency in software development.
There are several studies which are used as literature reviews of this study as study material. Research used as a literature review is a study that has a relationship to the topic of research related to risk management in software development. Ezghari and Zahi (2018) proposed effort estimation using a consistent fuzzy analogy-based method [3]. They said that software effort estimation is one of the most critical activities in software project development because it is crucial to optimal planning and important for controlling software resources. Based on the research fuzzy analogy based method has a promising approach that provides a strong qualification of uncertainty in effort estimation of a new software development project. The experiment’s result shows that the proposed model has good performance higher 50% accuracy. Kumar and Yadwa (2015) investigated risk assessment and estimation using the probabilistic model. Indicators to determine software development risk are Product Engineering, Development Environment and Program Constraint. Each of the indicators has a subclass that defines the technical detail [9]. The model used on the research is based on the Bayesian Belief Network. Each of the factors from indicators uses as input then the Bayes model is used to process that has output result probability of risk from the software development project. From the experiment result from the risk of software development project easy to estimate based on the probability value. Fan and Yu (2004) proposed software development management risk using Bayesian network-based probability techniques [14]. The proposed model is built on a mathematical model that provides an analysis of the effectiveness of resource use. The model is used to monitor software development projects by predicting project risks and sources of risk. The results of the analysis are used to assist project managers in making decisions in adjusting the allocation of resources dynamically. Besides the advantages of the proposed model is to provide support for decision making in uncertain conditions. Arun Kumar et al. introduced risk assessment in software development project based on fuzzy reinforcement paradigm [15]. Software risk prioritization is an essential role in determining the plan will be successful. This research proposed a hybridizing fuzzy multi-criteria decision-making approach for the development of an assessment framework to identify and rank software development project risks that aid to decision making during the production phase. From the experiment, the result shows that fuzzy is useful and accurate to solve the problem.
2. Research Method
This chapter contains proposed research methodology from data collection, data processing and proposed fuzzy model for software development project success by identifying the risks. All of the steps can be seen in Figure 1.
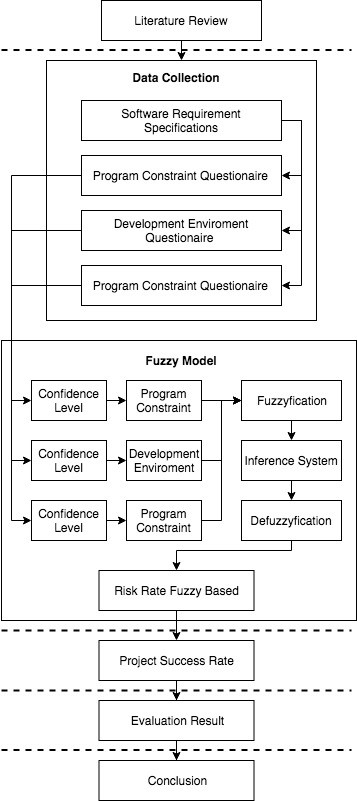 Figure.1: Research Methodology.
2.1. Research Methodology
Research methodology initialized from the literature review as the research reference based on the same case of software risk management. Software risk management research contains a different method such as a probabilistic model and the fuzzy-based model. Data collection stage consist of review the software specifications requirements. The result of the review is the questionnaire based on each stakeholder based on the project production domain. The fuzzy model proposed in this research start by calculating the confidence value of the questionnaire by the software risk indicators. The result of the confidence level used as input of fuzzy logic that starts from fuzzification, inference system, and defuzzification. The output of the fuzzy model is project risk rate from high, medium and low. Based on the risk output successful rate of a software development project can be identified. Evaluation result will review all aspect from input, process, and output to get the conclusion of the research.
2.2. Data Collection
There are many risk indicators for software development projects [16] [17]. The primary indicator matrix of software development risk is Product Engineering, Development Environment, Program Constraint [14] [18]. The indicators are further divided into sub-classes with various factors.
The dataset in this study are the results of a questionnaire based on the risk parameters of a project. The survey consists of questions that will be filled by project stakeholders. The quiz consists of issues related to the current project especially factors in software development. Furthermore, the answer represents the level of each of the elements.
Questionnaire answers were obtained from respondents consisting of front-end developer staff, backend developer staff, project managers and expert analysts. The answer given by the respondent is the result of a review of the specifications of the request given by the prospective client. The results of the survey are subjective judgments based on the experience of each respondent.
- Product Engineering Indicators
In the product engineering indicator, there are three respondents. They consist of front end developer staff, backend developers and project managers. In this aspect, the questionnaire is taken based on stakeholders related to the aspect of production directly. Product Engineering risk indicators have nine questions as listed in Table 1. Questions on Product Engineering indicators are connected to the production process starting from software requirements, implementation to integration and testing
Table 1: Product engineering questionnaire result
| Factor | Resp. 1 | Resp.2 | Resp.3 | Avg | |
| Requirement Stability | 0.70 | 0.75 | 0.75 | 0.73 | |
| Requirement Clarity | 0.75 | 0.75 | 0.75 | 0.75 | |
| Requirement Dependence | 0.50 | 0.60 | 0.60 | 0.57 | |
| Requirement Complexity | 0.50 | 0.40 | 0.40 | 0.43 | |
| Reuse Level | 0.70 | 0.75 | 0.75 | 0.73 | |
| Interfacing Level | 0.75 | 0.75 | 0.75 | 0.75 | |
| No. of Programming Language | 0.40 | 0.40 | 0.40 | 0.40 | |
| Product Stability | 0.80 | 0.75 | 0.75 | 0.77 | |
| Difficult Level to Implement Security | 0.75 | 0.70 | 0.70 | 0.72 | |
- Development Environment Indicators
In the development environment indicator, the questionnaire was filled by stakeholders at the managerial level including the project manager and expert analyst. Project managers are included in the Development Environment questionnaire because they are included in managerial level stakeholders. The project manager is a manager who is responsible for the production or supervision process at the staff level. Indicator Development Environment, which is listed in Table 2, is a factor that affects the production of software from a managerial point of view and management of human resources.
- Program Constraint Indicators
On the Program Constraint indicator, the questionnaire is filled by stakeholders with managerial level. Expert analysts have the task of translating client requirements into technical matters related to software development. Also, the expert analyst also controls every aspect of software development. The Program Constraint Indicator has coverage on factors related to human resources; the listing of the related factor is shown in Table 3.
Table 2: Development enviroment questionaire result
| Factor | Resp. 3 | Resp. 4 | Avg |
| Experience on The Development Process | 0.85 | 0.80 | 0.825 |
| Development Infrastructure Availability | 0.90 | 0.90 | 0.90 |
| Development Software Availability | 0.90 | 0.90 | 0.90 |
| Project Manager Experience Level | 0.85 | 0.85 | 0.85 |
| Project Dependence Level | 0.80 | 0.80 | 0.80 |
| Maturity Level | 0.80 | 0.80 | 0.80 |
| Motivational Level | 0.80 | 0.80 | 0.80 |
| Effective Role of Organization | 0.75 | 0.70 | 0.725 |
| Team Focus | 0.70 | 0.70 | 0.70 |
| Turnover | 0.70 | 0.70 | 0.70 |
Table 3: Program constraint questionnaire result
| Factor | Resp. 3 | Resp. 4 | Avg |
| Team Knowledge Level | 0.85 | 0.85 | 0.85 |
| Team Experience Level | 0.85 | 0.80 | 0.825 |
| Team Size | 0.70 | 0.75 | 0.725 |
| Project Size | 0.75 | 0.75 | 0.75 |
| Financial Feasibility | 0.9 | 0.90 | 0.90 |
| External Dependence Level | 0.6 | 0.60 | 0.60 |
| Client Experience | 0.7 | 0.75 | 0.725 |
| Client Participation Level | 0.8 | 0.85 | 0.825 |
- Confidence Level of Risk Indicators
The value of level confidence is obtained from experts who analyze software risk indicators. Confirmation of value is given to reduce indicators that have a small effect on the final results of estimating the success of software development. The confidence value is given by an expert on each indicator based on subjectivity with a range of values between 0 and 1. The detailed of the value of each factor is listed in Table 4, the higher the value of the indicator, the more the impact on estimating the success of software development.
2.3. Software Success Estimation Model based on Fuzzy Logics
The method developed by the researcher is the Tsukamoto fuzzy method with the steps represented in Figure 2.
- Input survey data use the factor of software development risk indicator.
- Calculate the confidence interval of each indicators using the formula of each indicator as listed below.
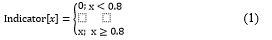
- Indicators that cross the threshold will be used as fuzzy inputs.
Table 4: Confidence level of risk indicators
| No | Factor | Confidence Level |
| 1 | Requirement Stability | 0.65 |
| 2 | Requirement Clarity | 0.90 |
| 3 | Requirement Dependence | 0.60 |
| 4 | Requirement Complexity | 0.85 |
| 5 | Reuse Level | 0.70 |
| 6 | Interfacing Level | 0.65 |
| 7 | No. of Programming Language | 0.80 |
| 8 | Product Stability | 0.60 |
| 9 | Difficult Level to Implement Security | 0.70 |
| 10 | Experience on The Development Process | 0.85 |
| 11 | Development Infrastructure Availability | 0.60 |
| 12 | Development Software Availability | 0.90 |
| 13 | Project Manager Experience Level | 0.60 |
| 14 | Project Dependence Level | 0.50 |
| 15 | Maturity Level | 0.60 |
| 16 | Motivational Level | 0.60 |
| 17 | Effective Role of the Organization | 0.60 |
| 18 | Team Focus | 0.80 |
| 19 | Turnover | 0.60 |
| 20 | Team Knowledge Level | 0.85 |
| 21 | Team Experience Level | 0.75 |
| 22 | Team Size | 0.75 |
| 23 | Project Size | 0.75 |
| 24 | Financial Feasibility | 0.90 |
| 25 | External Dependence Level | 0.70 |
| 26 | Client Experience | 0.60 |
| 27 | Client Participation Level | 0.75 |
Fuzzy logic process steps:
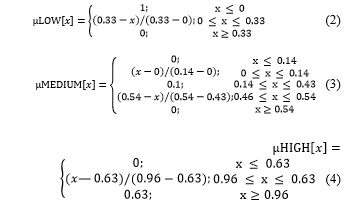
- Fuzzyfication input using each input (product Engineering, Development Enviroment, Program Constraint) as listed below:
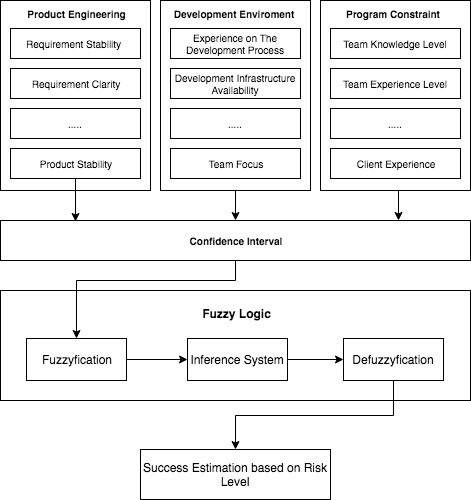 Figure.2: Fuzzy Logic Model Software Risk.
- Fuzzy inference system is used for calculating input based on the rule, and The rule is shown in Table 5.
Table 5: Fuzzy rule
| Rule No | Rule IF | Then (Risk) |
| 1 | Indicator1 = LOW AND Indicator2 = LOW AND Indicator3 AND, ….. AND Indicatorn = LOW | HIGH |
| 2 | Indicator1 = LOW AND Indicator2 AND Indicator3 = MEDIUM AND, ….. AND Indicatorn = MEDIUM | MEDIUM |
| 3 | Indicator1 = HIGH AND Indicator2 = HIGH AND Indicator3 =HIGH AND, ….. AND Indicatorn = LOW | LOW |
- Defuzzification
Final Result of the fuzzy output (z) obtain using an average of the inference system from the formula as shown below:
(5)
- Risk output based on the defuzzification.
Based on the risk output will be used to determine the success of the software development project. Fuzzy output risk is HIGH, MEDIUM and LOW.
3. Results and Analysis
This chapter describes the results of the research in the form of data collection and detail explaining the proposed risk management model with fuzzy logic. Data were collected from questionnaires that had been filled by stakeholders at PT Mindo Small Business Solutions which contained the factors of software development projects. Then explained the results of the calculation of the data with fuzzy logic with the output level of risk from various factors of software development. From the predictions that have been made then a discussion of strategies in risk mitigation can be done to increase the success of software development projects at PT Mindo Small Business Solutions
Data collected is in the form of data related to the project to be carried out and questionnaires based on project-related data. Project related data is a software specification needed by the client. While the survey is the result of a review by stakeholders based on the specifications of the software.
3.1. Processing Questionnaires Data
The initial stage in processing data is calculating the average value of the questionnaire given by all respondents. The results of the average value of each factor can be seen in table 6.
Table 6. Questionnaires average data values
| Factor | Average |
| Requirement Stability | 0.73 |
| Requirement Clarity | 0.75 |
| Requirement Dependence | 0.57 |
| Requirement Complexity | 0.43 |
| Reuse Level | 0.73 |
| Interfacing Level | 0.75 |
| No. of Programming Language | 0.40 |
| Product Stability | 0.77 |
| Difficult Level to Implement Security | 0.72 |
| Experience on The Development Process | 0.82 |
| Development Infrastructure Availability | 0.90 |
| Development Software Availability | 0.90 |
| Project Manager Experience Level | 0.85 |
| Project Dependence Level | 0.80 |
| Maturity Level | 0.80 |
| Motivational Level | 0.80 |
| Effective Role of Organization | 0.725 |
| Team Focus | 0.70 |
| Turnover | 0.70 |
| Team Knowledge Level | 0.85 |
| Team Experience Level | 0.825 |
| Team Size | 0.725 |
| Project Size | 0.75 |
| Financial Feasibility | 0.90 |
| External Dependence Level | 0.60 |
| Client Experience | 0.725 |
| Client Participation Level | 0.825 |
The average results of each factor in table 6, from the average value of each of these factors, will be selected using the interval confidence formula to obtain indicators that have a significant effect on the estimation of the success of software development in this study. Indicators that do not exceed the threshold in the confidence formula of the interval are eliminated. Final indicator obtained from the confidence interval formula shown in Table 7.
Table 7. Indicator confidence interval values
| Indicator | Factor | Confidence Level |
| Product Engineering | Requirement Clarity | 0.90 |
| Requirement Complexity | 0.85 | |
| No. of Programming Language | 0.80 | |
| Development Environment | Experience on The Development Process | 0.85 |
| Development Software Availability | 0.90 | |
| Team Focus | 0.80 | |
| Program Constraint | Team Knowledge Level | 0.85 |
| Financial Feasibility | 0.90 |
Based on the indicator selection process in table 6 it is selected eight indicators used. The eight indicators are used as input attributes on fuzzy logic in the next process. These results are used as a matrix of software development risk indicators shown in Table 8.
Table 8. Software risk indicator metrics
| Factor | Average |
| Requirement Clarity | 0.75 |
| Requirement Complexity | 0.43 |
| No. of Programming Language | 0.40 |
| Experience on The Development Process | 0.82 |
| Development Software Availability | 0.90 |
| Team Focus | 0.70 |
| Team Knowledge Level | 0.85 |
| Financial Feasibility | 0.90 |
Software risk indicator matrix above is used as input from the fuzzy model proposed in this study. The input of the model consists of indicators of Product Engineering, Development Environment and the program constraints.
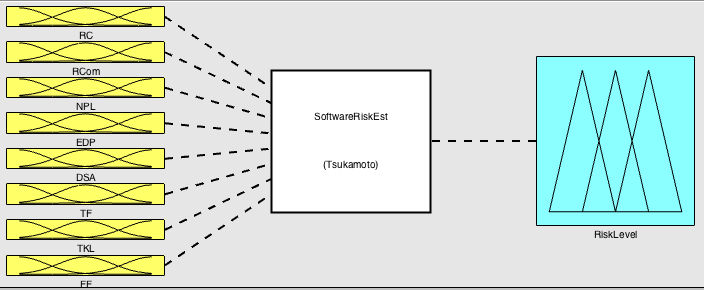 Figure.3: Fuzzy Logic Scheme.
3.2. Fuzzification
The process of fuzzy logic is started by fuzzification input. Input on fuzzy logic consists of Requirement Clarity (RC), Requirement Complexity (RCom), No. Programming Language (NPL), Experience on The Development Process (EDP), Development Software Availability (DSA), Team Focus (TF), Team Knowledge Level (TKL) and Financial Feasibility (FF). The results of these inputs will produce output in the form of risk. Input, process and output schemes can be seen in Figure 3.
 Continued calculation for all indicators from Requirement Clarity (RC=0.75), Requirement Complexity (RCom=0.43),No. Programming Language (NPL=0.40), Experience on The Development Process (EDP=0.825), Development Software Availability (DSA=0.9), Team Focus (TF=0.7), Team Knowledge Level (TKL=0.85) and Financial Feasibility (FF=0.9) resumed in Table 9 below:
3.3. Fuzzy Inference System
The process of inference system is to convert fuzzy inputs into fuzzy (z) output by following the rules (IF-THEN Rules) based on the fuzzy knowledge base that has been made by experts on table 5. The process of the inference machine is explained according to the following steps from the 1st Rule to the 3125th Rule.
3.4. Defuzzification
After the inference system process that produces output from every rule (Z1, Z2 …., Z28). Then the defuzzification stage is carried out, which is used to change the fuzzy output from the inference engine to a firm value using the appropriate membership function. Membership fuzzification can be seen in Figure 4.
Based on the range of linguistic sets on the input variables, the parameters of PE, DE and PC are entered in the “HIGH” set category as shown in Table 10.
Table 9: Range fuzzyfication
| LOW | MEDIUM | HIGH | |
| RC | 0 | 0 | 0.40 |
| RCom | 0 | 0.1 | 0 |
| NPL | 0 | 0.1 | 0 |
| EDP | 0 | 0 | 0.65 |
| DSA | 0 | 0 | 0.90 |
| TF | 0 | 0 | 0.23 |
| TKL | 0 | 0 | 0.73 |
| FF | 0 | 0 | 0.90 |
Table 10. Range fuzzyfication
| Parameter | Linguistic Categorization |
| RC | HIGH |
| RCom | MEDIUM |
| NPL | MEDIUM |
| EDP | HIGH |
| DSA | HIGH |
| TF | HIGH |
| TKL | HIGH |
| FF | HIGH |
From the linguistic input rule use in this case are:
Inference System Rule Number 2984:
IF RC = HIGH AND RCom = HIGH AND NPL = HIGH AND EDP = HIGH AND DSA = HIGH AND TF = HIGH AND TKL = HIGH AND FF = HIGH THEN RISK = LOW
Then,
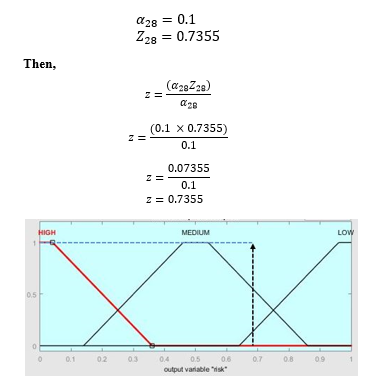 Figure.4: Risk Output Membership Function.
Based on the fuzzy calculation of risk value from inputRequirement Clarity (RC), Requirement Complexity (RCom), No. Programming Language (NPL), Experience on The Development Process (EDP), Development Software Availability (DSA), Team Focus (TF), Team Knowledge Level (TKL) and Financial Feasibility (FF) generated risk output in the software development project amount 0.7355, the value is entered in the fuzzy variable output set then the value is included in the risk set “MEDIUM” and “LOW”.
3.5. Experimental Results
Fuzzy process calculation starts with the input software risk factor. The risk factors have a value between 0 to 1 with a range of linguistic variables 0 to 0.33 LOW, 0.34 to 0.64 MEDIUM and 0.65 to 1 HIGH.
There are 27 software risk indicators. The indicator is used as a basis in taking questionnaire questions to stakeholders of software development projects. From these 27 indicators, selection indicators are conducted which have an important influence on the process of estimating the success of software development projects. Indicator selection is made with a confidence interval value to produce eight indicators that are considered necessary by the expert. The indicator used are Requirement Clarity (RC), Requirement Complexity (RCom), No. Programming Language (NPL), Experience on The Development Process (EDP), Development Software Availability (DSA), Team Focus (TF), Team Knowledge Level (TKL) and Financial Feasibility (FF).
The process starts with the input indicator risk fuzzification (RC, RCom, NPL, EDP, DSA, TF, TKL, FF) then the process is continued with engine inference and defuzzification. From the process of risk output in software development projects in the case described is 0.7355, the value is categorized on the “MEDIUM” and “LOW” risk sets. Compared with an expert assessment of risk in the development project, this project has a risk level of 0.85 categorized into the “LOW” risk sets, so the performance of fuzzy logic has an accuracy of 85%. Based on the risk output project has been categorized as a low risk, so the chance success of the project is high. From the input stage which consists of Product Engineering, Development Environment and Constraint Program, Product Engineering has the smallest value so that stakeholders of software project development can anticipate the factors that exist in Product Engineering indicators to overcome risks and improve the success of software development projects at PT. Mindo Small Business Solutions.
Results of experiments will be compared to the state of the art research with risk management cases in the software development project. The result shows that our approach is promising since accuracy is improved. Comparison to research is shown in table 11.
Table 11: Comparison with the previous reserach
| Method | Accuracy | Research |
| Fuzzy analogy based method | 72% | [3] |
| Bayesian Belief Network | 90% | [9] |
| Bayesian network-based probability techniques | 82% | [14] |
| Fuzzy Logic | 85% | This Research |
4. Conclusion
Planning & estimation has a very vital role in the stage of software development. Risk management is a systematic process for identifying, analyzing and controlling risks in a project. Risk management helps identify threats to project planning and estimation. This study proposes the use of fuzzy logic to determine software development project success at PT. Mindo Small Business Solutions Based on the research that has been done the conclusions obtained are risk management to assess software development project success using fuzzy logic has been successfully applied at PT. Mindo Small Business Solutions on a software development project with a case study of making a website-based polling and website-based mobile data collection system in real time on a national scale. In risk management indicators of the software used are Product Engineering, Development Environment and Constraint Program. Each of these indicators has sub-classes and factors that explain the indicators in detail from a technical point of view.
Based on the value of indicator used as fuzzy input are Requirement Clarity (RC=0.75) categorized as HIGH, Requirement Complexity (RCom=0.43) categorized as MEDIUM, No. Programming Language (NPL=0.40) categorized as MEDIUM, Experience on The Development Process (EDP=0.825) classified as HIGH, Development Software Availability (DSA=0.9) categorized as HIGH, Team Focus (TF=0.7) categorized as HIGH, Team Knowledge Level (TKL=0.85) categorized as HIGH and Financial Feasibility (FF=0.9) categorized as HIGH fuzzy input set. The output of fuzzy logic produces a risk output of 0.7355 which is included in the set of risk outputs “MEDIUM” and “LOW.” So it can be concluded that the case studies on software development projects that are being worked on have risks that categorized of medium and small risk. With these risks, the project to be worked on has the possibility of high success.
Although having a small risk, the software development project stakeholders must be able to anticipate risks by looking at the value of sub-factors in the software risk indicator. The amount of these sub-factors can also be used as a basis in making decisions to reduce risk and increase the success of software development projects at PT. Mindo Small Business Solutions. This research conducted 85% of accuracy. The suggestions for further research are is that we can use decision support in addition to fuzzy logic such as the neural network, Nearest Neighbor, ANFIS and others.
- Mall Rajib, Fundamentals of software engineering.: PHI Learning Pvt. Ltd, 2018.
- Chawan and Jijnasa Pati, “Software risk management,” International Journal of Computer Science and Mobile Computing, vol. 2.5, pp. 60-66, 2013.
- Soufiane Ezghari and Azeddine Zahi, “Uncertainty Management In Software Erroft Estimation Using a Consistent Fuzzy Analogy-Based Method,” Applied Soft Computing, pp. 540-557, 2018.
- Bijan Elahi, “Chapter 15: Software Risk Management,” in Safety Management for Medical Devices., 2018, pp. 127-149.
- Rory Burke, Project management: planning and control techniques. New Jersey, 2013.
- Michael Dedolph, “The Neglected Management Activity: Software Risk Management,” Bell Labs Technical Journal, vol. 8(3), pp. 91-95, 2003.
- Fairley, Richard E. “Software risk management.” IEEE Software 3 (2005): 101.
- Wen-Ming, and Sun-Jen Huang Han, “An empirical analysis of risk components and performance on software projects,” Journal of Systems and Software , vol. 80.1, pp. 42-50., 2007.
- Chandan Kumar and Dilip Kumar Yadav, “A Probabilistic Software Risk Assessment and Estimation Model for Software Projects,” Eleventh International Multi-Conference on Information Processing, pp. 353-361, 2015.
- Clerence W De Silva , Intelligent control: fuzzy logic applications.: CRC Press, 2018.
- Freerk Lootsma, Fuzzy logic for planning and decision making.: Springer Science & Business Media, 2013.
- Ali Idri, Azeddine Zahi, and Alain Abran, “Software cost estimation by fuzzy analogy for Web hypermedia applications,” in Proceedings of the International Conference on Software Process and Product Measurement, 2006.
- Aep Saepullah, “Comparative Analysis of Mamdani, Sugeno And Tsukamoto Method of Fuzzy Inference System for Air Conditioner Energy Saving,” Journal of Intelligent System, 2015.
- Chin-Feng, and Yuan-Chang Yu Fan, “BBN-Based Software Risk Management,” Journal of Systems and Software , vol. 73(2), pp. 193-203, 2004.
- Arun Kumar Sangaiah, Oluwarotimi Williams Samuel, Xiong Li, Mohamed Abdel Basset, and Haoxiang Wang, “Towards an efficient risk assessment in software projects–Fuzzy reinforcement paradigm,” Computers & Electrical Engineering, 2018.
- Kwan-sik Na, James Simpson, Xiaotong Li, Tushar Singh, and Ki-Yoon Kim, “Software development risk and project performance measurement: Evidence in Korea,” The Joirnal of Systems and Software, 2007.
- Mohd Sadiq and Mohd Sahid, “A systematic approach for the estimation of software risk and cost using esrcTool,” CSI Transactions ICT, 2013.
- Shareeful Islam, “Software development risk management model: a goal driven approach,” Foundations of Software Engineering, 2009.