Optimization of Statcom in a Nouakchott Power System
 , Mohamed Maaroufi 1, Abdel Kader Mahmoud 2, Ahmed Yahfdhou 3
Adv. Sci. Technol. Eng. Syst. J. 4(2), 333–339 (2019);
 DOI: 10.25046/aj040242
STATCOM a shunt connected Flexible Alternative Current Systems (FACTS) device using for fast control of voltage and reactive power control in the power grid. To optimize Nouakchott power system at 2030 year, we anticipate both generation and demand grow. A set of nonlinear equations are solved through Newton Raphson method and programmed in PSS/E and MATLAB. The results will be analyzed for two situations, without STATCOM and with STATCOM connected to the grid. The found results show the degree of performance and capacity of STATCOM to reduce the power mismatches, improve the voltage at buses and reduce the harmonics in Nouakchott power system. The impact of the renewable energies to improve transient stability of system will be considered. In the end, the power system is optimized at 2030 year by integration the STATCOM device. It will be generating or absorb reactive power to stabilize the system voltage at 1 pu. That means enhances transits active power thereby providing additional capacity to consumers.
1. Introduction
Electrical networks supply energy between the production site and the customer site, with a required power, a voltage and frequency. According to the standards, the voltage drop in the network is limited to ± 5%. The power plants of Nouakchott consist of multi-sources that supply several loads, located in seven different places in town making a loop of 33 KV. It should be noted that the frequency varies continuously. Variations ± 5% of the nominal frequency affect the stability of network and may lead to load shedding. The voltage level must remain within an authorized range at any point in the network. This will be in all foreseeable production and consumption situations. The proposed goal for this work is to find a solution for load shedding. In this case, we proposed an analysis for both the current and projected production system. That allows us to meet the domestic demand of the Nouakchott 33 KV network. This analysis allows us to reach and maintain the voltage profile in stability margin for the network manager. Before that we modelize the electrical network by its transit capabilities. And analysis its simulation results programmed in MATLAB and PSS/E. The growths of distributed renewable generation (solar, wind, etc) are creating challenges for the power grid stability [1-3]. The intermittence problem of these energies makes us always to seek to solve it. To synchronize renewable energy with conventional energy, to make our system more efficient, it requires a delicate control procedure: frequency, phase sequences, phase angles and magnitudes of all the four independent sources should match exactly. A real time monitoring circuitry is necessary which should turn on and off the sources when the loads reach preset values. Another goal is to optimize Nouakchott power system. The STATCOM device (Static Var Compensator) is a technique for achieving this goal [4, 5]. Per comparison with other types of FACTS (Table 5), STATCOM has been chosen. Thus, to realize predetermined goals, we take the following four steps:
- First step, the single line schematic of the Nouakchott 33 KV loop network is given (Figure 1).
- Secondly, the lines data and voltages (Table 1).
Thirdly generation and load grow are given from 2020 to 2030 years (Tables 2 and 4).
- Thirdly, a mathematical model of power flow equations are solved by Newton Raphson (NR) method, programmed on MATLAB software and PSS/E simulator for two situations (without STATCOM and with STATCOM device) [6-11]. The results of simulations will be following by discussions.
- Last step, a conclusion of the work.
For insertion of the STATCOM device, it is sought a stable power system, even during a disturbance (out limit voltage drop or frequency) to provide the demand power [12, 13]. We notice that FACTS devices are defined by IEEE as “power electronic based controllers and other static equipment which can regulate the power flow and transmission voltage through rapid control action”. Nowadays power system control is based on FACTS devices. STATCOM a shunt connected FACTS device using to rapid voltage and reactive power control, also to reduce harmonics in power system (Table 5). This is realized while keeping constant the frequency to the margin limit of stability and alternators speed rotation also the voltage magnitude in the various network buses [14, 15].
2. Structure of System
2.1. One line diagram of Nouakchott Power Grid
The One –line diagram (Figure.1), represents the 33 KV loop (part of the network). The lines data and initials voltage at each bus, the values of generated and load grow are given in Tables 1 and 2 respectively. The system include eleven(11) transmissions lines, two renewable plants (one wind power ,one solar plant), two thermal plants and 1 Dual fuel plant)and five(5) loads connected at buses 2,4,5,6 and 7 respectively. The active and reactive powers generated are given in MW and MVAR respectively. The voltage at each bus (i) is given in KV. The load bus is characterized by its active power P and reactive power Q. Therefore, (P, Q) are specified, while (V) is to be calculated. In this context, it is proposed for the North bus (1), to be a slack bus. Finally, it should also be noted that a bus is numbered (i) and it is connected to (k) other buses such as those shown in Figure 1[16].
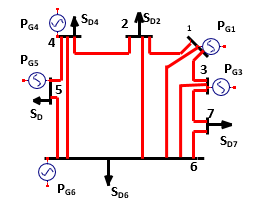 Figure 1: Simplified One Line Diagram; of Nouakchott System
Table 1 present, the active resistances(R), the lines reactances values(X), bus voltage (V), the lengths of each line (L), at each bus (i) connected to the bus (k).
2.2. Given Data of System
Table 4 are presented the simulation results for PSS/E simulator, case before insertion of STATCOM, we can notice the profile of voltage magnitudes and the voltage angles. The results show that the values of voltage magnitude are below the range of the stability for all system except the slack bus. In blue color the buses were connected the renewable plants (3, 5 and 7 buses).
Table 1: Lines Data and Bus Voltage of Figure 1
| N | i | k | R(Ω) | X(Ω) | V(KV) | L(km) |
| 1 | 1 | 2 | 0,122 | 0,167 | 33 | 6,27 |
| 2 | 1 | 3 | 0,067 | 0,092 | 33 | 3,47 |
| 3 | 1 | 6 | 0,024 | 0,037 | 33 | 20 |
| 4 | 2 | 4 | 0,027 | 0,037 | 33 | 13,98 |
| 5 | 2 | 6 | 0,032 | 0,044 | 33 | 16,8 |
| 6 | 3 | 6 | 0,061 | 0,08 | 33 | 15 |
| 7 | 3 | 7 | 0,141 | 0,193 | 33 | 7,25 |
| 8 | 4 | 5 | 0,17 | 0,232 | 33 | 8,72 |
| 9 | 4 | 6 | 0,127 | 0,173 | 33 | 4,51 |
| 10 | 5 | 6 | 0,101 | 0,15 | 33 | 5,66 |
| 11 | 6 | 7 | 0,232 | 0,31 | 33 | 11,87 |
Table 2: Generation Data at 2020 to 2030 Years [16]
|
N |
2020 | 2025 | 2030 | |||
| MW | MVAR | MW | MVAR | MW | MVAR | |
| 1 | 180 | 87,17 | 270 | 130,68 | 360 | 174,24 |
| 3 | 15 | 7,26 | 15 | 7,26 | 15 | 7,26 |
| 4 | 36 | 17,42 | 36 | 17,42 | 36 | 17,42 |
| 5 | 30 | 14,52 | 70 | 33,88 | 60 | 29,4 |
| 6 | 137 | 66,34 | 199,7 | 96,67 | 217,2 | 105,15 |
| 7 | 0 | 0 | 50 | 24,2 | 50 | 24,2 |
Table 3: Load Grow at 2020 to 2030 Years [16]
| N | 2020 | 2025 | 2030 | |||
| MW | MVAR | MW | MVAR | MW | MVAR | |
| 2 | 27,68 | 15,8 | 142,55 | 81,37 | 734,142 | 419,05 |
| 4 | 11,71 | 6,36 | 60,3 | 32,3 | 310,5 | 166,34 |
| 5 | 1,34 | 1,138 | 6,9 | 5,86 | 35,53 | 30,179 |
| 6 | 9,4 | 1,17 | 48,4 | 6,02 | 249,31 | 36,8 |
| 7 | 13,49 | 7,18 | 69,48 | 36,97 | 357,86 | 190,39 |
Table 4: Simulation Results of NR without STATCOM
| N | Remarque | Vpu | δ(°) |
| 1 | Slack | 1 | 0 |
| 2 | PQ | 0,8 | -5,6 |
| 3 | PV | 0,93 | -1,8 |
| 4 | PQ | 0,75 | -7,3 |
| 5 | PV | 0,78 | -6,5 |
| 6 | PV | 0,8 | -5,8 |
| 7 | PQ | 0,83 | -4,6 |
3. Mathematical Modelisation of STATCOM
The Static Synchronous Compensator (STATCOM) device is a shunt connected FACTS to the buses. It uses the forcing electronic power commutation (GTO, IGBT and IGCT). A STATCOM controls reactive power source can improve the transient stability of systems. This provides voltage support by generating or absorbing reactive power at the point of common
Table 5: Comparison of FACTS systems in terms of technical efficiency [17, 18]
| Problem | FACTS Systems | |||||
| Shunt | Series | Hybrid | ||||
| SVC | STATCOM | SSSC | TCSC | IPFC | UPFC | |
| Control of the voltage (static state) | ++ | ++ | ++ | + | + | + |
| Control of the voltage (dynamic state) | ++ | ++ | ++ | + | + | + |
| Static stability | ++ | ++ | – | – | – | + |
| Dynamic Stability | ++ | ++ | – | – | – | + |
| Damping of power oscillation | ++ | ++ | ++ | ++ | + | ++ |
| Transitional stability | + | ++ | – | ++ | + | ++ |
| Power flow (static condition) | + | + | ++ | ++ | ++ | ++ |
| Limitation of the fault current | – | – | – | – | + | + |
Table 6: comparison of the two numerical methods NR and GS
| Elements of comparison | Comparison between the methods of N.R and G.S |
| iterations Number | Is greater for G-S than (16) compared to (4) for N-R |
| convergence Time | For G-S is 0.05seconds and 0.22seconds for N-R |
| Preference of resolution method | N-R with polar coordinates, G-S with rectangular form. |
| Other Precision Items | With broader systems larger for N-R than G-S. |
| Indifferent with slack bus choice | for N-R and for G-S is critical choice |
| Complex by the Jacobian matrix | The G-S resolution is simpler than N-R |
coupling without the need of large external or capacitor banks. The basic voltage source converter diagram is shown in Figure 2.
The Table 5 corresponds to the best choice of STATCOM to optimize the system performance.
3.1. Power Flow Equations of STATCOM Connected to ith bus
Power flow equation of system with STATCOM connected at bus (i) in Figure 1 and is treated as reactive power source:
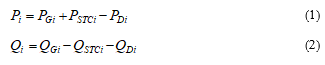 Hence PSTCi – is a STATCOM’s active power at bus (i) and QSTCi – is a STATCOM’s reactive power at bus (i), Pi – is injected active power at bus (i), Qi – is injected reactive power at bus (i), PDi – is active power demand at bus (i) and QDi – is a reactive power demand at bus (i), PGi – is a generator’s active power at bus (i), QGi – is a generator’s reactive power at bus (i).
Equations (1) and (2) represent a case where STATCOM generate reactive power at bus (i) if for reactive power absorption, the signs of QSTCi will be reversed (positive).
The solution of nonlinear power flow equations (1) and (2) is numerical methods. However, the adopted method in this work is the Newton-Raphson (NR). The specifications of this method, its faster rate of convergence and accuracy, when compared with others methods as Gauss-Seidel (GS), coupled NR, decoupled NR or Gauss method. We notice this comparison of NR with Gauss Seidel: NR indifferent for choice of slack bus while GS is critical, the resolution of NR with polar coordinates while GS is with rectangular form, the number of iterations is less for NR (4 iterations) compared with GS (16 iterations), with broader systems larger for NR than GS. So the convergence time is lees for GS (0.05 seconds) than NR (0.22 seconds) and the GS resolution is simpler than NR (see Table 6).
In the Table 6 below is given the comparison of the two best numerical methods. These two are important indicators to analyze the quality of the studied network. And also demonstrates the optimal choice of NR method for our work.
3.2. Modeling of STATCOM
So below is presented the basic schematic and Thevenin’s equivalent circuit of STATCOM respectively, the fundamental frequency operation of the switched mode voltage source inverter and its transformer (Figure 2).
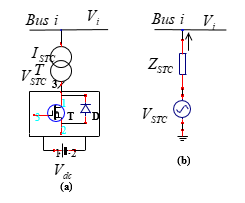 Figure 2: (a) Basic Schematic; (b) Equivalent Circuit [17, 18]
We define STACOM voltage by the equation (3):
![]() Hence VSTC – is a STATCOM’s voltage, ISTC – is STATCOM’s current, ZSC – is transformer’s impedance.
Hence VSTC – is a STATCOM’s voltage, ISTC – is STATCOM’s current, ZSC – is transformer’s impedance.
The voltages constraints of STATCOM and at bus (i) are given in equation (4)
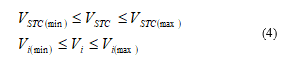 Where VSTC (min) and VSTC (max) are minimum and maximum STATCOM’s voltages, Vi (min) and Vi (max) are minimum and maximum voltages values at bus (i).
Equation (3) is transformed into a power flow expression for STATCOM and power injected at bus (i) by equations (5) and (6) respectively:
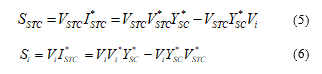 Hence SSTC – is a STATCOM’s apparent power, I*STC – is a STATCOM’s complex conjugate current, V*STC – is a STATCOM’s complex conjugate voltage, Y*SC – is a complex conjugate of short-circuit admittance.
The voltages in rectangular coordinates system are expressed as equations (7) and (8) respectively:
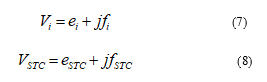 Where ei – is a active component of voltage at bus (i), fi – is a imaginary component of voltage at bus (i), eSTC – is a active component of STATCOM’s voltage, fSTC – is a imaginary component of STATCOM’s voltage.
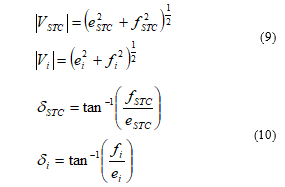
The STATCOM’s voltage magnitude and angle are expressed as equations (9) and (10) respectively:
 The active and reactive power components for the STATCOM and bus (i) on the basis of equations (7) to (10) are respectively expressed by equations (11) to (14):
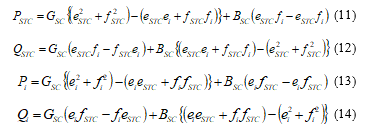 Where PSTC – is a STATCOM’s active power, QSTC – is a STATCOM’s reactive power, GSC – is a short-circuit conductance, BSC – is a short-circuit susceptance.
The Newton-Raphson set of linearized equations for power flow equations (5), (6), (11) and (12) obtained taken into consideration the modeling of shunt-connected STATCOM at bus (i) is given by equation (15):
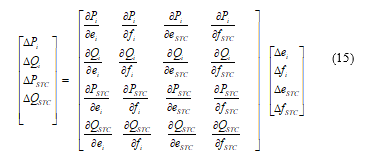 The partial derivatives of the Jacobian matrix are defined as following: (expression (16))
4. Simulations Results
The Table 7 below presents the simulation results of NR with STATCOM. Also presents the best locations at buses.
Table 7: Results of NR with STATCOM
| N° | Vpu | δ( °) |
| 1 | 1 | 0 |
| 2 | 0,97 | -11,1 |
| 3 | 0,99 | -3,9 |
| 4 | 0,95 | -13 |
| 5 | 1,01 | -14,1 |
| 6 | 0,97 | -11,1 |
| 7 | 0,98 | -9,8 |
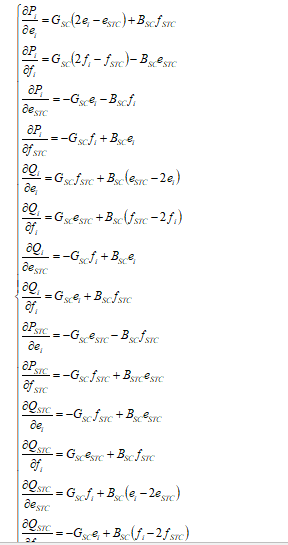 (16)
(16)
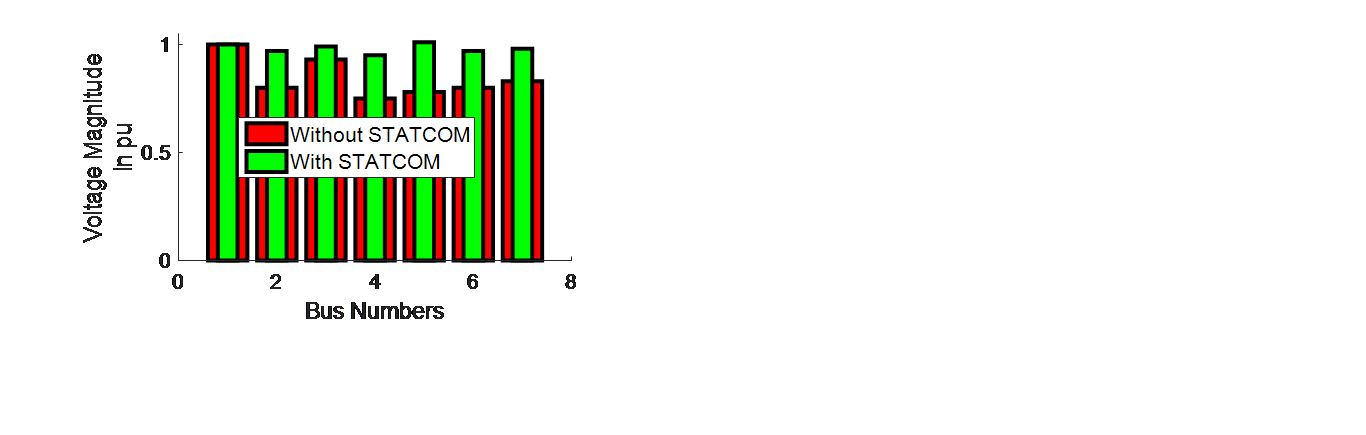 Figure 3: (a) Voltage magnitude as a function of bus numbers
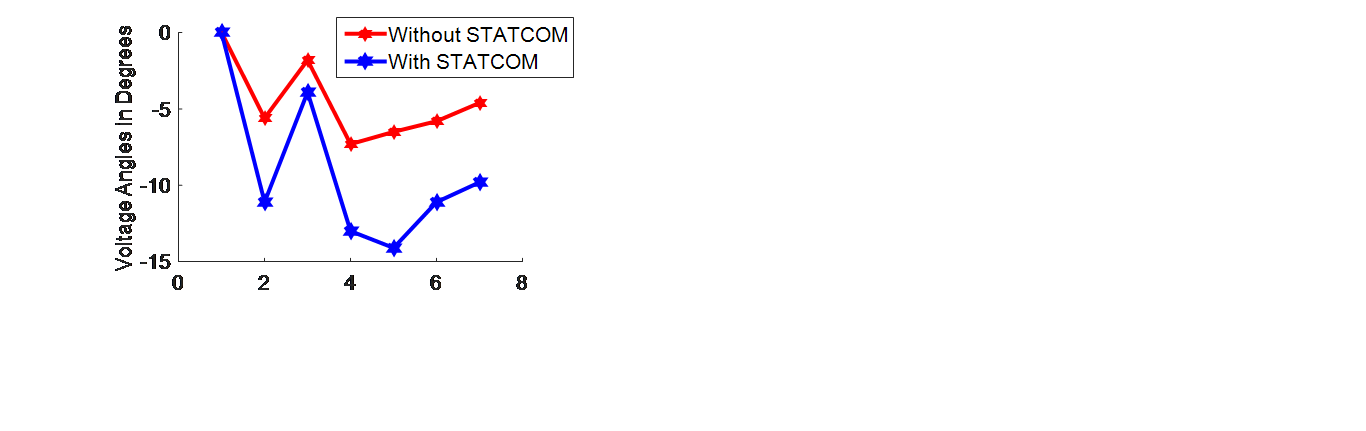 Figure 3 (b): Voltage angle as a function of bus numbers
The voltage magnitude and their phase angle before and after insertion of STATCOM are shown in the figure 3(a) and (b) respectively. It demonstrates the improved values at the following buses: the voltage magnitude for the bus 2 at 0, 80 (value out stability margin) to 0, 97 pu and their angle at -5, 6 to -11, 1 degree. Bus 3 at 0, 93 to 0,99pu and their angle at -1, 8 to -3, 9 degrees. The bus 4 at 0, 75 to 0,95pu and their angle at -7, 3 to -13 degree. The bus 5 at 0, 78 to 1,01pu and their angle at -6, 5 to -14, 1 degree. The bus 6 at 0, 8 to 0,97pu and their angle at -5, 8 to -11, 1 degree. The bus 7 at 0, 83 to 0, 98 pu and their angle at -4, 6 to -9, 8 degrees.
In the Table 8 below is given the simulation results of total power mismatch.
Table 8: Total Power Mismatch
| Case
|
Active Power Losses
(MW) |
Reactive Power Losses ( MVAR) |
| Without STATCOM | 305.7 | 419 |
| With STATCOM | 262.9 | 360.3 |
From the Figure 4(a) and (b) below, the power mismatch was reduced at 305, 7 MW to 262, 9 MW for active power losses and 419 MVAR to 360, 3 MVAR for reactive power losses, thereby improving the active power transmission lines.
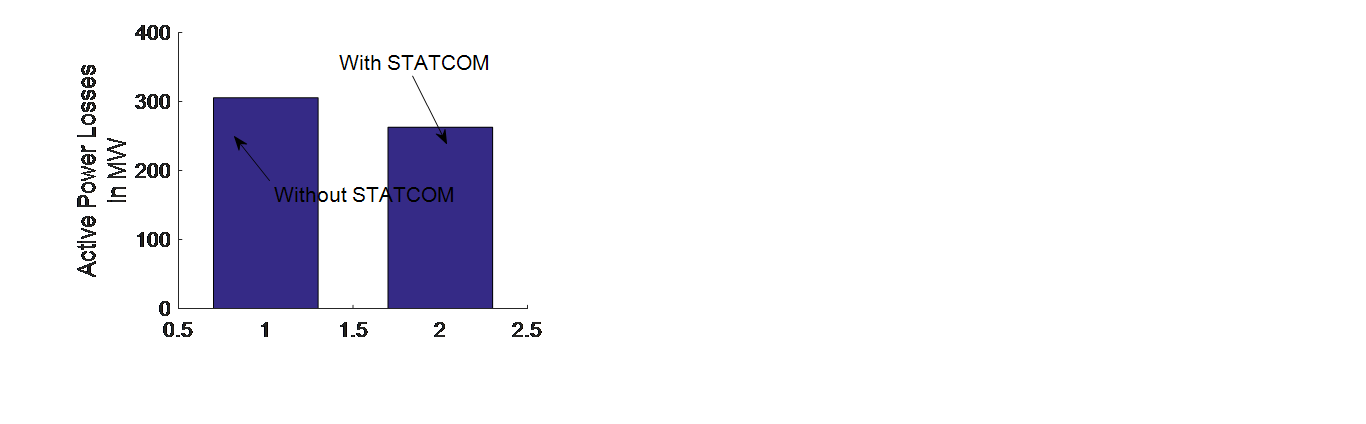 Figure 4: (a) Active Power Losses;
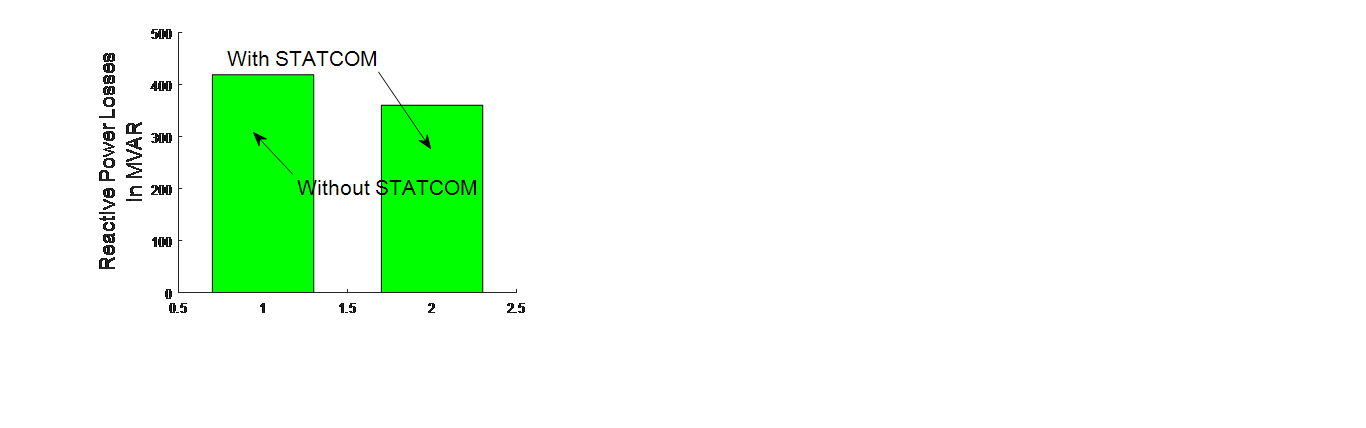 Figure 4 (b): Reactive Power Losses
Table 9: Reached Tolerance in 4 Iterations
| N | Without STATCOM | With STATCOM | ||
| It. | ΔV(V) | Δδ(°) | ΔV(V) | Δδ(°) |
| 0 | 0.18 | 0.096 | 0.053 | 0.249 |
| 1 | 0.06 | 0.027 | 0.037 | 35E-4 |
| 2 | 0.005 | 0.025 | 0.001 | 12E-5 |
| 3 | 4E-5 | 0 | 0 | 0 |
| 4 | 0 | 0 | 0 | 0 |
From the Figure.7 so below demonstrates the comparison of the voltage errors variation (a) and the delta angle (b) with and without STATCOM connected to the system as a function of iteration numbers.
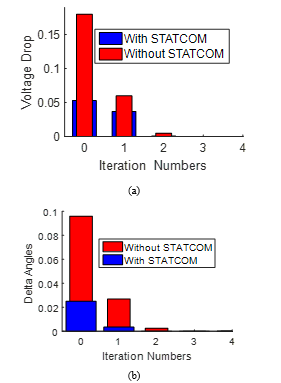 Figure 5: (a) Voltage drops function of iterations numbers; (b) Voltage angle function of iterations numbers
5. Conclusions
The simulation results of load flow program on PSS/E Simulator using the NR method have been done.
The main information obtained is the stability exceeding limits at all buses voltage of system except the slack bus (Table 4).
After insertion of STATCOM the voltage for all buses has been improved to the stability limit (Table 7).
The voltages at buses (5, 3 and 7) where connected the renewable plants have improved in limit of stability after insertion of STATCOM
The power mismatch was being reduced after insertion of STATCOM (Table 8).
The novelty is that the studied network presents four different sources in Figure 1. This network undergoes very common load shedding. The cause of these load shedding can be due to the load growth at the nodes. But it can be caused by the presence of clouds or when there is no wind to turn the blades, or non-rainy periods in the Sahel countries. In order to remedy this situation of load shedding, STATCOM has been proposed as a solution.
The STATCOM will replace also the conventional system compensation of reactive power (as shunt capacitor or series capacitor…).
The expected disturbances and the poor power quality problems of the studied power system, at 2030 year, were solved by integration of STATCOM that is able generate or absorb reactive power and maintain the voltage at 1pu. The following areas are proposed or put in mind:
Other FACTS controller can also be incorporated along the STATCOM and their effect on the system can be studied [17, 18].
Optimal location of STATCOM can be found out using Genetic Algorithm and fuzzy logic.
Economic Assessment of FACTS devices versus other methods can be studied.
Conflict of Interest
The authors of the manuscript declare no conflict of interest.
Acknowledgment
The author likes greatly thank National Electrical Company of Mauritania (SOMELEC) for providing all system data. I also like to thank the General chair of ISAECT2018, Nabil SRIFI, for extended paper to special issue of Advances in Science, Technology and Engineering Systems Journal (ASTESJ) and all reviewers for their corrections and comments.
- E. Catz, “Evolutions Techniques du Système de transport et de distribution d’électricité” J3eA, 5(1), pp.01-07, 2006. https://doi.org/: 10.1051/J3ea :20060025.
- N. Cherkaoui, T. Haidi, A. Belfqih, F. El Mariami, J. Boukherouaa “A Comparison Study of Reactive Power Control Strategies in Wind Farms with SVC and STATCOM” IJECE, 8( 6), pp. 4836~4846. 2018. DOI: 10.11591/ijece.v8i6.pp4836-4846.
- R.M. Marco, D.Z. Cruz, Desta, S. F. Fitiwi, S.J. Santos, Silvio, J. P. S. Mariano, P.S. João, “Prospects of a Meshed Electrical Distribution System Featuring Large-Scale Variable Renewable Power ” Energies, pp. 01-18, 2018. https/doi.org/: 10.3390/en11123399.
- R.A. Jokojeje, I.A, Adejumobi, O.I, Adebisi, Mufutau, “Reactive Power Compensation in Nigeria Electricity Grid Using Static Synchronous Compensator (STATCOM)” IOSR-JEEE, 10(2), pp. 08-20, 2015. https://doi.org/: 10.9790/1676-10114657.
- Z. Rahman, A. Tiwari., “Enhancement of Voltage Profile by Using Static Synchronous Compensator (Statcom) in Power System Networks” S-JPSET, 8(2), pp. 01–16, 2006. https://doi.org/: 10.18090/samriddhi.v8i2.714410.
- N. Mancer, B. Mahdad, K. Srairi., “Multi Objective Optimal Reactive Power Flow Based STATCOM Using Three Variant of PSO” IJEE, 2(2), pp. 01-07, 2012. https://doi.org/: 10.5923/j.ijee.20120202.01
- N. Z. M. Ali, I. Musirin, H. Mohamad, “Effect of SVC Installation on Loss and Voltage in Power System Congestion Management” ijeecs, 14(1), pp. 428-435, 2019.
- T.T. Nguyen, R. Gianto, “Application of Optimization Method for Control Coordination of PSSs and FACTS Devices to Enhance Small-Disturbance Stability,” Proc. IEEE PES 2005/2006 T&D Conference and Exposition, 2006.
- A.K. Sahoo, S.S. Dash, T. Thyagarajan. “Modeling of STATCOM and UPFC for Power System Steady State Operation and Control”. IET-UK ICTES 2007.
- R.S. Joel, “Application of FACTS devices for power system transient stability enhancement,” Master of sciences, Joma Kenyatta University of agriculture and technology, 2016.
- W. C. B. Vicente, “Modélisation des réseaux de distribution sous incertitudes,” Thèse de doctorat, Université de Grenoble, 2006.
- A. Ahmedi, ”Participation des parcs de production éolienne au réglage de la tension et de la puissance réactive dans les réseaux électriques, ” Thèse de doctorat, Ecole centrale de Lille, Thèse de doctorat, 2010.
- Z. Cabrane, ”Gestion et supervision d’un système d’alimentation photovoltaïque avec stockage d’énergie hybride, batteries- supercondensateurs. Application au véhicule solaire, ” thèse de doctorat, Université Mohamed V- Agdal, 2017.
- G.W. Stagg, A. H. El-Abiad, Computer methods in power systems analysis, Mc Grew Hill international book company: New-York, 1968.
- J.G. John, D. William, JR. Stevenson, Power system analysis, Mc Grew Hill, New-York, 1994.
- P. Jean, Plan directeur de production et transport de l’énergie électrique en Mauritanie entre 2011-2030, GOPA-International Energy Consultants GmbH Leopoldsweg2, 61348 Bad Homburg, Allemagne ,2011.
- J. Wiley, FACTS, Modeling and Simulation in Powers Networks, The Atrium, Southern Gate, Chichester, West Sussex PO19 8SQ, England, 2004.
- E. Acha, FACTS modeling and simulation in power networks, John Wiley and Sons, LTD, 2004.