A Novel Rule Based Technique to Detect Electricity Theft in India

Adv. Sci. Technol. Eng. Syst. J. 4(2), 413–421 (2019);
 DOI: 10.25046/aj040251
It is high time to control and prevent power theft by manipulating the meter reading and tampering of the meter. It is possible to deal power theft by developing Advanced Metering Infrastructure (AMI) and smart grids. For most of the distribution companies, utility smart meters’ data is serving as wealthy source of information beyond billing. There are numerous methods for detection of meter inconsistencies and dishonest behavior like meter tampering based on past data. This paper proposes a “Rule Based” electricity theft detection methodology based on the detection of abnormal readings of phase voltages, currents and power factor communicated by smart energy meters to the central server of the utility in constant time interval of fifteen minute. Individual customer theft detection rate of 94.8% is achieved with 10% False Positive Rate, which is low. The proposed method is tested on real time data collected from smart meters installed in Raipur city of Chhattisgarh State Electricity Board India.
1. Introduction
In the process of market and regulatory reforms for electricity sector the most focused segment of value chain is “Distribution sector”, due to its importance in financial flow. However, despite attention, Indian sector of distribution continues to be the weakest link and undergoes suffering from common drawbacks like high aggregate technical and commercial (AT&C)[1] losses. The current high level of AT&C losses incurred by the Indian distribution companies (DISCOM) is a matter of concern. Unfortunately non-technical losses (NTL)[2], are the most difficult to estimate as they include loss component which are not associated with system’s physical features [1]. Due to losses as on 30 September 2015 Indian DISCOMs had an exceptional debt of Rs.4.3 trillion [2].
To take care of the financial viabilities of DISCOMs, which were in ‘red’ due to increased losses, Ministry of Power, Government of India launched ambitious Ujjwal DISCOM Assurance Yojana (UDAY) program in November 2015 to aim debt reductions of DISCOMs. The financial losses of utilities have cut down from Rs. 515.9 billion (~$8.14 billion) in 2016 Financial Year (FY) to Rs. 348.3 billion (~$5.49 billion) in the FY 2017 due to UDAY [3,4].
The ultimate sufferer due to NTL is the consumer as these losses are converted into economic losses by DISCOM, which further resulted as imposition of extra tariffs. Therefore; electric utility grids should be encouraged for developing programs to reduce NTL. The traditional way of detecting fraud is to carry out on-site inspection but the cost of onsite inspection for a number of customers may not be compensated with the value of the energy recovered. Another approach is observation of ‘load profile[3]’ of consumers. By customer’s load-profile data, it is possible to detect significant deviations in the behavior that can be associated with NTL.
Wider use of smart energy meters has increased possibilities of detecting power theft by using power consumption data communicated by smart meters to the utility server within a constant time interval. These meters may be subjected to anomalies related to meter securities, measurement interruptions and network intrusions. Advanced Metering Infrastructure (AMI) has made it possible to sense and store large amount of data communicated by smart meters. By applying suitable machine learning technique on such a large amount of smart meter data it has become possible to detect anomalies related to NTL.
Since the evolution of algorithms of machine learning, AMI have been widely applied for the assessment of the security of power system to overcome the disadvantages of conventional methods [5]. This section provides the overview of the reported work for NTL detection by using both conventional and modern data analytics methods. There has been an increasing interest in the development of techniques on the basis of extraction of patterns of consumer consumption behavior from historical data. These methods can be supervised, unsupervised or semi-supervised [6]. Unsupervised methods determine anomalies without prior knowledge about customers’ behavior, and supervised methods determine both normal as well as abnormal behavior using a supervised classification that requires pre-classified data [7]. In [8], the development of representative load-profiles is presented as a reference for the analysis of NTL using classification algorithms, decision trees, and Naïve Bayes classifier. In [9,10], the authors propose the use of support vector machines (SVMs) to identify fraudulent customers. Load profiles are classified based on the typical or atypical content of their behavior. In [11], a methodology based on extreme learning machines (ELM) is presented. The characteristic load profile of a customer is developed on the basis of measurements obtained from customer load curve.
A methodology on the basis of Genetic Algorithm (GA) and SVM is presented in [12]. In another work a methodology deals with the variability of customer consumption, trend of consumption, and other contributions for NTL detection is presented [13]. In [14], the effectiveness of the SVM technique is compared with the extreme learning machine (ELM) technique. In [15] a hybridized classifier which utilizes grouping (clustering), Euclidean distance, dynamic time warp (DTW), and a weighted curve comparison algorithm were used.
In [16] two methods were suggested; one based on clustering with decision trees and other simpler approach permits users to be detected with severe consumption drops. In [17] a combinational approach is proposed using a fusion of statistical techniques, neural-networks (NNs) and text mining for the recognition of NTL. An optimal forest classifier (OPF) and its learning algorithm for the identification of NTL are reported in [18].
In [19] a methodology for the detection of NTL is presented using vector support machines (SVM). In [20] Hybrid selection algorithm between Harmony Search and Optimal Road Forest has been proposed. A two-step methodology that combines diffuse clustering based on C-means and a fuzzy classification is proposed in [21]. In [22], authors suggested improved methodology proposed in [14] by introducing a diffuse inference system. In [23], the authors present an integrated expert system (IES7) consisting different modules. Vector support machine trained with information gathered from smart meters, representing all available forms of fraud is presented in [24].
In [25] a mining-based methodology to identify NTL is described based on the statistical characterization of the energy patterns of consumers. A relative comparison study for the identification of NTL by the use of supervised machine learning techniques is discussed in [26]. In [27] the Pearson coefficient is used for evolution of user consumption and a model is developed based on Bayesian network and decision trees.
In [28] the customer data was analyzed using an Autoregressive (AR) model so as to predict the amount of energy consumed within a specific interval and then compare the result obtained against the user’s current record that is low. A technique based on diffuse clustering is proposed in [29] in which number of clusters or groups is predefined. In [30] an artificial neural network is applied to the user classification process to be inspected. In [31] SVM and probabilistic neural networks (PNN) are used for the detection of energy theft. Extreme Learning Machines (ELM) and SVM are proposed in [32].
In [33], a knowledge-based system (KBS) is proposed, which is developed on the basis of knowledge and experience of inspectors and uses data mining, statistical-techniques and neural-networks (NNs). A methodology that uses a Time domain reflector meter (TDR) to determine the theft of energy is proposed in [34].
A surveillance system based on live machine learning techniques and automatic meter reading is proposed in [35, 36]. NTL are reviewed thoroughly and different methods have been recommended in [37]. Dynamic time wrap (DTW of non-technical losses in the electricity grid is review [38]. Detection of electricity theft detection in Indian) based approach suggested in smart meter data base nontechnical loss detection [39]. Various solution for detection of detection state is discussed in [40] by empirical analysis.
In [41], Random Matrix Theory is proposed for the detection of electricity theft in a system. Customer consumption pattern based detection of electricity theft in AMI is discussed in [42]. Decision tree and advanced data analytics based SVM for identification of theft is introduced in [43]. In [44], various methods of electricity theft and abnormalities in customer consumption patterns have been discussed.
It is evident from the reported literature that most of the techniques are based on supervised learning. These supervised approaches make use of such cases which have been detected previously to achieve equivalent patterns, that is, the techniques require pre-labeled data.
This paper suggests rule based theft detection technique for the utilities by using data mining and feature extraction tools if their customers are connected through smart meter. Data mining is a process whose major goal is to investigate, extract and store correlated data from huge databases, which contain histories of energy consumption through probabilistic and statistical tools. Feature extraction is the process of extracting special features from the measured data, such that it helps in the improvement of accuracy of the detection model. Parameters like three phase voltage, current and power factor are extracted and stored in the feature vector. This feature matrix is compared with the threshold values. Rule based theft detection technique frames a set of rules according to the result of comparison with threshold values. Thus, a Novel Rule Based Theft Detection Technique is suggested so as to improve the accuracy in individual electricity theft detection.
Following are the contributions of this paper:
- A new automated model using data mining is introduced with high percentage of probability of fraud detection in an agile, timely manner using MATLAB simulation, and the result obtained supports the decision-making and future investigations for improving the productivity of electric service companies, which will have a positive influence on financial sustainability and quality of service.
- The introduced model has a high percentage of specificity and sensitivity. In addition, it will help the electric energy recovery section to improve the NTL detection process in less time and lower costs with lesser quantity of field staff and thus avoid subjectivity.
The paper has introduction followed by review of the research in data mining to detect electricity theft in section I. In section II system model is proposed for electricity theft detection including data preparation, rules for type of meter tampering attempts mainly based on meter measurement interruption techniques. Section III includes model for individual electricity theft detection. Section IV presents results of the simulation and its comparison with other data mining methods. Section V presents a final conclusions and future scope of the work.
2. System Model for Electricity Theft Detection
A novel threshold based detection model for electricity theft detection has been prepared for analyzing the per phase voltage, current and aggregate power factor readings sent by three phase direct connected smart energy meters connected at individual customer premises for whole year. The analysis process is based on a systematic approach divided in sequential steps to get correct results of theft. Following are the steps for novel threshold based theft analysis.
2.1. Data Preparation
A distribution network with ‘n’ no. of buses is considered each of which is equipped with three phase direct connected smart meters. Every smart meter generates the time-series data of the respective bus, which includes the amplitude of the three-phase voltage, current, power factor, reactive and active power measurements.
The matrix serves as system state data formulated as:
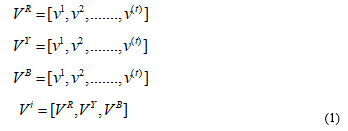 Where represents the measurement vector for three-phase, voltage-amplitude at the time step ‘t’, and ‘i’ represents the number of smart meter readings, is the matrix of three phase voltage amplitude for independent users for a particular smart meter reading.
Similarly, current can be represented as:
![]() And power factor:
And power factor:
![]() The three-phase data matrix serves as the input factor for threshold based theft detection formulated as:
The three-phase data matrix serves as the input factor for threshold based theft detection formulated as:
![]() Where is the feature vector of ith attribute which is further used as input for theft detection.
Where is the feature vector of ith attribute which is further used as input for theft detection.
The sequence of 12 months of the three-phase data matrix for independent user serves as the factor data formulated as:
![]() Where, is the smart meter measurement of the three-phase prediction matrix for one user in time span of twelve months. represent the time duration feature vector at time frame.
Where, is the smart meter measurement of the three-phase prediction matrix for one user in time span of twelve months. represent the time duration feature vector at time frame.
Once data matrix is formulated then next approach is to define the threshold according to certain rules for detection of theft. Initially, the central server gathers the current, voltage and power factor measurement data from the region. The signal patterns according to the formulated predictions matrix are compared with the instantaneous threshold patterns. If the signal patterns exceed the threshold values, then it is considered as electricity theft.
2.2. Rules for Threshold Detection
Threshold values of electrical parameters measured by smart meter for logging the abnormal meter tampering conditions are formulated by cumulating the meter tampering threshold values gathered from the requirements of various major Indian DISCOMs throughout the country.
This analysis has taken three major tampering conditions which are frequently used for power theft in the country out of various tampering methods.
As the voltage and current related tampering are the major causes which can affect the meter power measurements hence, illegal consumers would frequently try to decrease the amount of these parameters to decrease the consumption bills.
These tampering can be understood by following:
- Voltage Link Missing
Theft condition can take place when either single phase or any two phase voltages are intentionally missing or reached a value less than a particular threshold value.
- CT Bypass
This theft condition takes place when either one phase, any two phases or all three phases CT’s of the smart meter externally/internally bypassed by putting external shorting link of low resistance between the source side and load side terminals of one or more phases of the meter. Due to low resistance of the shorting link most of the phase current passes through it and meter measures lesser current and hence records less energy consumed.
- CT Open Phase Wise
This theft condition can take place when either single phase, two-phase currents are intentionally missing or reached a value less than a particular threshold value.
The smart meters used considered for this analysis are direct connected three phase four wire type, with 3x240volt as the reference voltage from supply side denoted by Vref on the name plate of the meter, basic current Ib is 10Amp, maximum current rating of the meter is Imax=40Amp and the meter is of class 1. All the above discussed theft conditions are summarized in Table 1.
Table 1 Various Theft Conditions
| Sl.no.
|
Tamper Conditions | ||
| Type of Tamper | Occurrence Threshold | Restoration Threshold | |
| 1 | Link Miss phase wise | Vx < 60% Vref (Vx <144V)Ix > 20% Ib (Ix >2A)Any other Phase Voltage > 75 % Vref (Vp >180V) | Vx > 85 % Vref (Vx >204V) Any other Phase Voltage > 75 % Vref (Vall>180V |
| 2 | CT Bypass | Iavg > 2% Ibasic (Iavg >0.2A)
Ibypass > 25 % Ibasic (Ibypass >2.5A)
|
Iavg > 2 % Ibasic (Iavg>0.2A)
Ibypass < 20 % Ibasic(Ibypass<2A) |
| 3 | CT Open phase wise | Vx > 60 % Vref (Vx >144V)
Ix < 2 % Ibasic (Ix <0.2A) Ibypass > 25 % Ibasic (Ibypass >2.5A) |
Vx > 60 % Vref (Vx >144V)
Ix > 2 % Ibasic (Ix >0.2A) |
Pseudo Code of rules according to threshold values are discussed in Appendix – A.
3. Proposed Model for Individual Electricity Theft Detection
Fig.1 represents the structure of the distribution network used in this paper for preparing theft model and further theft analysis.
The communication between the AMI and the substation real-time monitoring of specific area is carried out with the Remote Terminal Units (RTU). This unit lists the total energy consumption registered by all the connected meters in that particular zone.
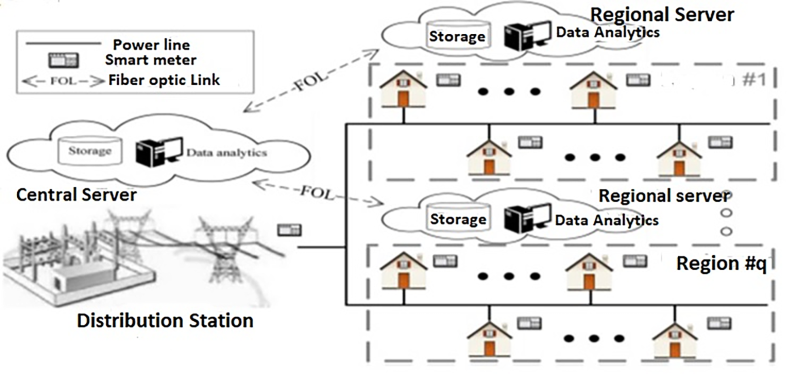 Figure 1 Distribution network processing and Data acquisition
The comparison of combined energy consumed by consumers belong to particular distribution supply system with the supplied energy appears as less accurate and impractical method, hence this paper proposes theft analysis for each customer individually by comparing instantaneous values of all three phase voltages, currents and aggregate power factor communicated by smart meters connected at each consumer premises. A novel rule based theft detection technique for the utility grids using feature extraction combined data mining technique is formulated. Obtained feature matrix is an augmented matrix of three features namely three phase voltage, current and aggregate power factor. These features are compared with the threshold of those parameters and a rule base is framed using those comparison results.
Initially, the network is separated into ns geographical regions. Each region is comprised of set of buses represented as B1, B2, …… Bn. After the successful detection of area of fraud, each user is individually investigated for the detection of electricity theft. The real-time process of analysis is identical to the regional method of theft detection approach, which is used to monitor anomalies in the pattern of consumption of all the customers. At the time step k, the values of the total three-phase voltages, currents along with power factor that can be used in qt region from equation (4) is given as:
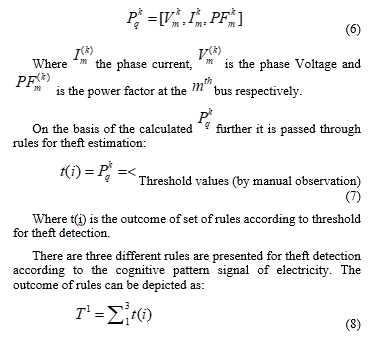
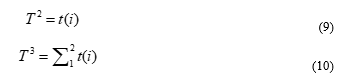 Where are the total number of detection for theft according to rules, t(i) are the number of detected theft according to threshold inside the rules, based on individual smart meter reading.
Theft detection further estimated according to the voting of all saved values. The majority decision will be considered as final outcome for theft. In order to ensure automatic detection of anomalies, a threshold must be set. The threshold is obtained using the min-max criteria (i.e. minimizing FPR and maximizing the DR) to obtain a solution with high-performance for detecting theft of electricity[4].
With respect to Rules described in equations, the Theft can be defined as follows:
With the above discussion it is clear that theft detection is sequential procedure and each step got its own importance. Flow chart of the proposed detection method for electricity theft and its detailed function are mentioned in Appendix- B.
4. Simulation Results
The simulation results obtained from rule based threshold model have been discussed in this section. Performance of the proposed model is calculated in terms of percentage accuracy, precision and sensitivity. Based on the calculated parameters the method is compared with the other existing theft detection methods.
4.1. Dataset Explanation
Utilities have customer energy consumption records to support their billing activities. Load profile data represents the behavioral characteristics of customer’s electric power consumption during a specific period. By using this data, it is possible to detect significant deviations in the behavior that can be associated with NTL. Handling such a big amount of data and extracting useful information from it is a new challenge. However, utilities are using data mining methods to correlate data from huge databases, which contain histories of energy consumption through statistical and probabilistic approaches.
In the proposed approach the smart meter dataset is collected from Raipur city of Chhattisgarh State Electricity Board (CSEB) India. The collected data is communicated to the central server of the utility by 41 three phase whole current smart energy meters for the period of one year (01.01.2017 to 01.01.2018), with 15 minutes of time interval. Each meter data information consists of Unique Meter Identity Number (MID), all three phase voltages, currents, consumed power and power factor for whole year with date and time.
4.2. Performance of Rule Based Theft Detection Method
The proposed performance of the rule based theft detection method is represented by confusion matrix. The confusion matrix comprises of information regarding predicted and actual classification values done by the classification system. The performance of the system is generally assessed using the matrix data. Theft event is logged by meter when value of any phase voltage or current crosses the pre decided threshold values discussed in table I. Theft event represented by value 1 and normal event by value 0.
Fig.2 represents the Confusion Matrix obtained by the proposed method; here rows and the columns are the labels of theft and normal detection from dataset. The matrix contains Output Class and Target Class. The confusion-matrix of proposed approach depicts that total 10,000 randomly picked samples from self-collected dataset have been considered, from which detection of 81 samples is wrongly considered as Normal which is represented by False Negatives (FN). False negative refer to undetected fraud committing consumers, creating financial loss for utility. The detection of 5565 samples is accurately detected as Normal called True Positive (TP).
Moreover, detection of 434 samples is wrongly considered as theft considered as False Positive (FP). False Positive are the honest consumers who are misclassified as fraudulent by the algorithm, along with 3920 samples from the dataset are detected accurately as theft considered as True Negative (TN).
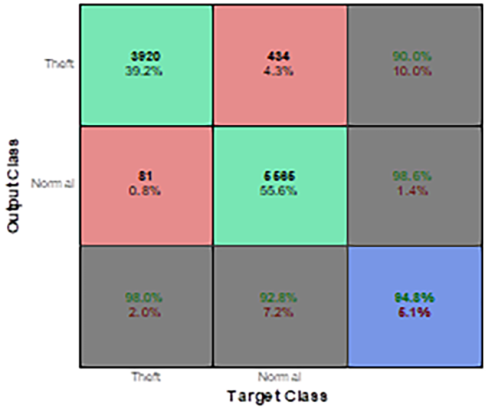 Figure 2 Confusion Matrix for Rule Based Theft Detection
| FPR (False Positive Rate)
FNR (False Negative Rate) = TP (True Positive Rate) Miss Rate Error Rate |
Finally, complete content and organizational editing before formatting. Please take note of the following items when proofreading spelling and grammar.
Calculations from the confusion matrix for the proposed method are obtained as per the formulae given in [45]:
The other important parameters calculated from the above confusion matrix are theft detection accuracy, precision and sensitivity of the proposed method.
Theft detection accuracy is the fraction of rightly classified instances by the classification model. For the proposed rule based detection method the theft detection accuracy is calculated as follows:
Fig.3 represents the accuracy graph of the proposed method based on the above calculation for two class labels one is normal and other is theft. Theft represented by class number 1 and normal data represented by class number 2 in the graph.
Precision is defined as the fraction of true positive instances among the overall identified instances as positive by the theft detection method.
Fig.3 represents the precision graph of the proposed method based on the above calculation for two class labels one is normal and other is theft.
Sensitivity of the detection method represents its ability to correctly detect the theft cases. Sensitivity is known as the fraction of true positive instances among the true positive and false negatives. For the detection of fraudulence both false negative (FN) and false positive (FP) predictions must be controlled.
Fig.3 represents the sensitivity graph of the proposed method based on the above calculation for two class labels one is normal and other is theft. Theft represented by class number 1 and normal data represented by class number 2 in the graph.
4.3. Comparing the Proposed Method with Existing Theft Identification Methods
Comparison between the results of the suggested methodology and other existing methods discussed in [41,42,43,44] are presented in Table II. The performance evaluation is done on the basis of accuracy of detection, false positives, used strategy, privacy and implementation and maintenance costs. It is found that the Random Matrix Theory (RMT) based method (with a threshold of 1.5) is defined as an efficient technique compared to other techniques.
Moreover, the suggested approach produces efficient outputs than RMT and other techniques with FPR 10%. Hence, setting the threshold is an efficient way to ensure automatic detection of low FPR anomalies.
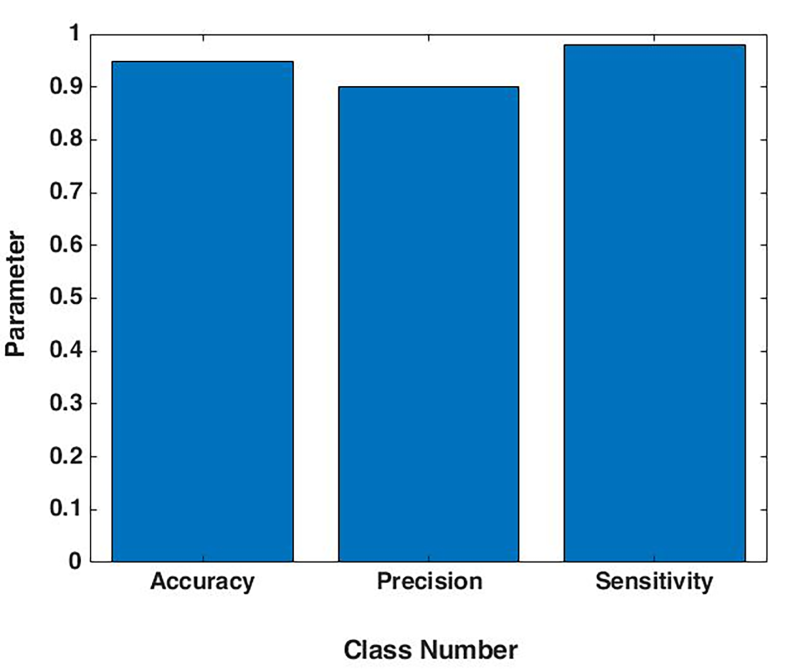 Figure 3 Accuracy, Precision and Sensitivity graph for Rule Based Theft Detection
The accuracy of the proposed technique is 94.8%, which is better compared to the SVM approach. In addition, the power management system ensures that the efficiency of the proposed technique complies with the standard and aggregated data at the substation. low voltage either illegally or anomalously. Hence, the process used here is appropriate to detect electricity consumption abnormalities at multiple levels.
Table 2 Comparative Analysis of Proposed and existing theft detection methods
| Parameters | Proposed Method | RMT
[41] |
Multiclass SVM [42] | DT couple SVM [43] | One-class SVM [42] | Fuzzy classification [44] |
| Detection Rate (DR)% | 94.8 | 91.5 | 94.0 | 92.5 | 76.0 | 74.5 |
| False Positive Rate (FPR)% | 10.0
|
1.5 | 11.0 | 5.1 | 29.0 | 33.1 |
| Approach Used | Region and Customer level | Region and Customer level | Region and Customer level | Distribution and Customer level | Region and Customer level | Customer level |
| Privacy Preservation | Medium | Medium | Medium | Weak | Medium | Weak |
| Cost | Medium | Medium | Medium | High | Medium | Low |
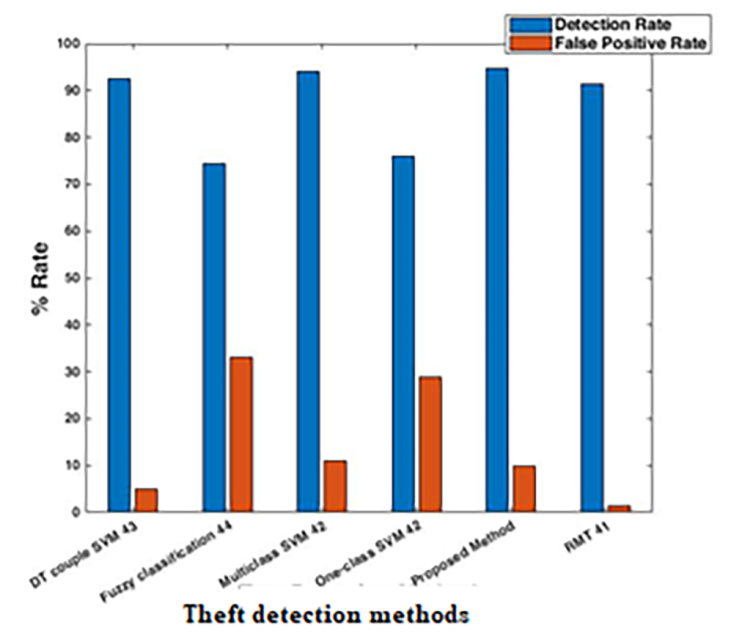 Figure. 4 Comparative analysis of proposed and existing theft detection methods
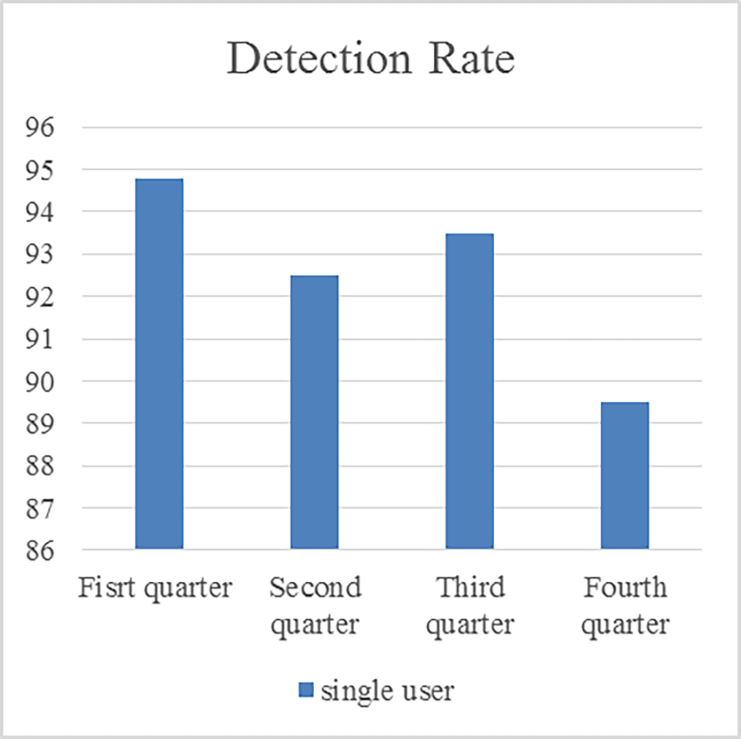 Figure. 5 Detection Rate with different time periods
4.4. Effect of Seasons on Theft Detection Rate
To analyze the seasonal effect on theft detection rate (DTR) the entire smart meter data is divided in equal time periods of three months’ duration hence the whole year data is represented by four subsets.
On calculations of DTR for whole year it is found that the first quarter data claims approximately 94.8 % of detection rate, a higher accuracy compare to other quarters for the same region whereas the fourth quarter claims minimum accuracy i.e. 89 %.
Fig. 5 shows the detection rate of proposed algorithm for twelve months’ data.
4.5. Analysis of Percentage Loss and Received Values in Units
Theoretically calculation of losses is done by determining supplied electricity then deducting the energy billed/paid from it.
Moreover, NTL are calculated as follows:
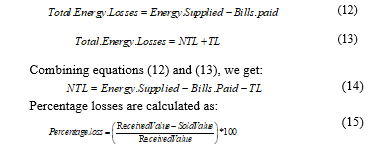 Fig. 6 shows the decline of percentage loss with increase in the received values. According to equation (15), Fig. 6 claims that when received values i.e. bill collection from defaulters or all users of electricity are high, then the percentage losses to the utility will be low.
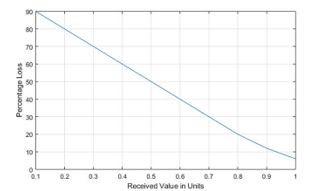 Figure. 6 Percentage Loss vs. Received Value
5. Conclusion
In the above paper, a novel data based approach for theft detection is suggested and comparison of its performance with existing methods in different types of electricity theft and operational conditions is done. Since it only requires measurement of the voltage, current and power factor-amplitudes as communicated by smart-meters, the suggested method is very viable and authentic. Moreover, the method doesn’t depend on the power-system modeling and the pre-classification of the load. It is observed from simulation studies that the proposed method detects dishonest customers with an accuracy of 94.8% (high) with false positive rate of 10% (low). The presented method not only recognizes the inconsistencies in the consumption of electricity, but also shows the type of electricity theft at the customer-end. The above method encourages creating an automated model that detects cases of electric power fraud with greater efficiency, quick inspection of supplies which will help ailing DISCOM in India, to overcome financial losses due to AT&C losses and have a positive impact on financial sustainability and quality of service.
Conflict of Interest
The authors declare no conflict of interest.
Acknowledgment
The authors are grateful to Central Power Research Institute Bhopal, and MANIT Bhopal for providing the necessary facilities to carry out this research work.
Appendix-A
Pseudo Code of rules according to threshold
|
Vref = 3*240;
Ibasic = 10;
% RULES for Theft Detection
a) % RULE-1 for Voltage Link Missing if sum([Vr, Vy, Vb] < 0.6*Vref) dec(1) = dec(1)+1; end if sum([Ir, Iy, Ib] > 0.2*Ibasic) dec(1) = dec(1)+1; end if sum([Vr, Vy, Vb] > 0.75*Vref) dec(1) = dec(1)+1; end
b) % RULE-2 for CT Bypass if sum([Ir, Iy, Ib])/3 > 0.02*Ibasic dec(2) = dec(1)+1; if sum([Irbypass,Iybypass,Ibbypass] > 0.25*Ibasic dec(2) = dec(1)+1; end c) % RULE-3 for CT Open Phase Wise if sum([Vr, Vy, Vb] > 0.6*Vref) dec(3) = dec(3)+1; end if sum([Ir, Iy, Ib] < 0.02*Ibasic) dec(3) = dec(3)+1; end |
Appendix-B
Steps of proposed Rule Based Theft Detection Method for electricity theft and its detailed function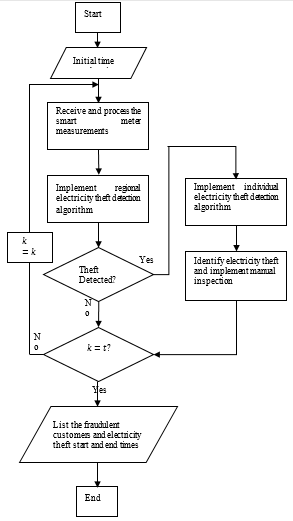
- Tooraj Jamasb, Tripta Thakur, Baidyanath Bag, “Smart electricity distribution networks, business models, and application for developing countries,” Energy Policy,Vol. 114, Pages 22-29, 2018.
- Baidyanath Bag, Tripta Thakur, “A Utility Initiative based Method for Demand Side Management and Loss Reduction in a Radial Distribution Network Containing Voltage Regulated Loads, ” IEEE International Conference on Electrical Power and Energy Systems, Bhopal, Pages 52- 57, 2016.
- Government of India, Power Finance Corporation Ltd. Report on, ” The Performance of State Power Utilities for the years 2016 “. [Online] Available: http://www.pfcindia.com/.
- Government of India, Power Finance Corporation Ltd. Report on, ” The Performance of State Power Utilities for the years 2017, ” [Online] Available: http://www.pfcindia.com/
- Venkatesh T, Trapti Jain, ” Synchronized measurements-based wide-area static security assessment and classification of power systems using case based reasoning classifiers,” Computers and Electrical Engineering, Vol. 68, Pages 513-525, 2018.
- Thomas B Smith, ” Electricity theft: a comparative analysis, ” Energy Policy, Vol. 32, Issue 18, Pages 2067-2076, 2004.
- J. Hodge and J. Austin, “A Survey of Outlier Detection Methodologies,” Artificial Intelligence Review, Vol. 22, Issue 2, Pages 85-126, 2004.
- H. Nizar, Z. Y. Dong, J. H. Zhao and P. Zhang, “A Data Mining Based NTL Analysis Method,” IEEE Power Engineering Society General Meeting, Tampa, FL, Pages 1-8, 2007.
- H. Nizar, Z. Y. Dong and P. Zhang, “Detection rules for Non-technical losses analysis in power utilities,” IEEE Power and Energy Society General Meeting – Conversion and Delivery of Electrical Energy in the 21st Century, Pittsburgh, PA, Pages 1-8, 2008.
- Nagi, A. M. Mohammad, K. S. Yap, S. K. Tiong and S. K. Ahmed, “Non-Technical Loss analysis for detection of electricity theft using support vector machines,” IEEE Power and Energy Conference, Johor Bahru, Pages 907-912, 2008.
- H. Nizar, Z. Y. Dong and Y. Wang, “Power Utility Non-Technical Loss Analysis with Extreme Learning Machine Method,” IEEE Transactions on Power Systems, Vol. 23, Issue 3, Pages 946-955, 2008.
- Nagi, K. S. Yap, S. K. Tiong, S. K. Ahmed and A. M. Mohammad, “Detection of abnormalities and electricity theft using genetic Support Vector Machines,” TENCON– 2008, IEEE Region 10 Conference, Pages 1-6, 2008.
- Biscarri, F., Monedero, Í., León, C., Guerrero, J. I., “A Mining Framework to Detect Non-Technical Losses in Power Utilities, ” Proceedings of the 11th International Conference on Enterprise Information Systems, Pages 96– 101, 2009.
- H. Nizar and Z. Y. Dong, “Identification and detection of electricity customer behaviour irregularities,” IEEE Power Systems Conference and Exposition, Seattle, Pages 1-10, 2009.
- Fabris, L. R. Margoto and F. M. Varejao, “Novel Approaches for Detecting Frauds in Energy Consumption,” Third International Conference on Network and System Security, Gold Coast, Pages 546-551, 2009.
- Monedero, F. Biscarri, C. León, J.I. Guerrero, J. Biscarri, and R. Millán, ” New Methods to Detect Non-Technical Losses on Power Utilities”, Proceeding (683) IASTED Artificial Intelligence and Soft Computing, Sept. 2009, Spain.
- I. Guerrero, C. León, F. Biscarri, I. Monedero, J. Biscarri and R. Millán, “Increasing the efficiency in Non-Technical Losses detection in utility companies,” 15th IEEE Mediterranean Electrotechnical Conference, Pages 136-141, April 2010, Valletta.
- Caio C. O. Ramos, André N. Souza, João P. Papa, Alexandre X. Falcão,” Learning to Identify Non-Technical Losses with Optimum-Path Forest,” IWSSIP 2010, 17th International Conference on Systems, Signals and Image Processing, Pages 154-157, 2010.
- Nagi, K. S. Yap, S. K. Tiong, S. K. Ahmed and M. Mohamad, “Nontechnical Loss Detection for Metered Customers in Power Utility Using Support Vector Machines,” IEEE Transactions on Power Delivery, Vol. 25, Issue 2, Pages 1162-1171, 2010.
- Caio C.O. Ramos, André N. Souza, Giovani Chiachia, Alexandre X. Falcão, João P. Papa, “A novel algorithm for feature selection using Harmony Search and its application for non-technical losses detection, ” Computers & Electrical Engineering, Vol. 37, Issue 6, Pages 886-894, 2011.
- W. S. Angelos, O. R. Saavedra, O. A. C. Cortés and A. N. de Souza, “Detection and Identification of Abnormalities in Customer Consumptions in Power Distribution Systems,” IEEE Transactions on Power Delivery, Vol. 26, Issue 4, Pages 2436-2442, 2011.
- Nagi, K. S. Yap, S. K. Tiong, S. K. Ahmed and F. Nagi, “Improving SVM- Based Nontechnical Loss Detection in Power Utility Using the Fuzzy Inference System,” IEEE Transactions on Power Delivery, Vol. 26, Issue 2, Pages 1284-1285, 2011.
- Carlos León, Félix Biscarri, Iñigo Monedero, Juan I. Guerrero, Jesús Biscarri, Rocío Millán, “Integrated expert system applied to the analysis of non-technical losses in power utilities, ” Expert Systems with Applications, Vol. 38, Issue 8, Pages 10274-10285, 2011.
- S. S. R. Depuru, L. Wang and V. Devabhaktuni, “Support vector machine based data classification for detection of electricity theft,” IEEE/PES Power Systems Conference and Exposition (PSCE), Phoenix, Pages 1-8, 2011.
- Leon, F. Biscarri, I. Monedero, J. I. Guerrero, J. Biscarri and R. Millan, “Variability and Trend-Based Generalized Rule Induction Model to NTL Detection in Power Companies,” IEEE Transaction on Power Systems, Vol. 26, Issue 4, Pages 1798-1807, 2011.
- Yap K.S., Tiong S.K., Nagi J., Koh J.S.P., Nagi F., “Comparison of Supervised Learning Techniques for Non-Technical Loss Detection in Power Utility, ” International Review on Computers and Software, Vol. 7. Issue 2, Pages 626-636, 2012.
- Iñigo Monedero, Félix Biscarri, Carlos León, et al., “Detection of frauds and other non-technical losses in a power utility using Pearson coefficient, Bayesian networks and decision trees, ” International Journal of Electrical Power & Energy Systems, Vol. 34, Issue 1, Pages 90-98, 2012.
- Abdullateef, A.I. and Salami, M. J., Eyiomika, et al., “Electricity theft Prediction on Low Voltage Distribution System Using Autoregressive Technique,” International Journal of Research in Engineering and Technology, Vol. 1, Issue 5, Pages 250-254, 2012.
- V. Babu, T. S. Murthy and B. Sivaiah, “Detecting unusual customer consumption profiles in power distribution systems — APSPDCL,” IEEE International Conference on Computational Intelligence and Computing Research (ICCIC), Enathi, Pages 1-5, 2013.
- Breno C. Costa, Bruno. L. A. Alberto, et al., “Fraud Detection in Electric Power Distribution Networks Using an Ann-based Knowledge-Discovery Process,” International Journal of Artificial Intelligence & Applications (IJAIA), Vol. 4, Issue. 6, Pages 17-23, 2013.
- Mandava, Srihari, Vanishree J. and Ramesh V., “Automation of Power Theft Detection Using PNN Classifier,” International Journal of Artificial Intelligence and Mechatronics, Vol. 3, Issue 4, Pages 118-122, 2014.
- Dangar, S.K.Joshi, “Electricity Theft Detection Techniques for Distribution System in GUVNL,” International Journal of Engineering Development And Research, Pages 11-18, 2014dd.
- Juan I. Guerrero, Carlos León, Iñigo Monedero, et al., “Improving Knowledge-Based Systems with statistical techniques, text mining, and neural networks for non-technical loss detection, ” Knowledge-Based Systems, Vol. 71, Pages 376-388, 2014.
- Hossein Pourarab M, Alishahi S, Aghli N, ” Electric power theft detection using time domain reflectometer,” 23rd International Conference on Electricity Distribution, June 2015, Lyon.
- Hartmann et al., “Suspicious electric consumption detection based on multi- profiling using live machine learning,” IEEE International Conference on Smart Grid Communications (SmartGridComm), Miami, Pages 891-896, 2015.
- McDaniel, Patrick, and Stephen McLaughlin, “Security and privacy challenges in the smart grid,” IEEE Security & Privacy, Vol.7, Issue 3, Pages 75-77, 2009.
- Messinis, G.M. and Hatziargyriou, N.D.,”Review of non-technical loss detection methods, ” Electric Power Systems Research, Vol.158, Pages 250-266, 2018.
- Villar-Rodriguez, E., Del Ser, J., Oregi, et al., ” Detection of non-technical losses in smart meter data based on load curve profiling and time series analysis, ” Energy, Vol.137, Pages 118-128, 2017.
- Viegas, J.L., Esteves, P.R., Melício, R., et al., ” Solutions for detection of non-technical losses in the electricity grid: A review, ” Renewable and Sustainable Energy Reviews, Vol. 80, Pages 1256-1268, 2017.
- Gaur, V. and Gupta, E., ” The determinants of electricity theft: An empirical analysis of Indian states, ” Energy Policy, Vol.93, Pages 127-136, 2016.
- Xiao, Fei, and Qian Ai, “Electricity theft detection in smart grid using random matrix theory,” IET Generation, Transmission & Distribution, Vol. 12, Issue 2, Pages 371-378, 2018.
- Jokar, P., Arianpoo, N., Leung, V.C.M., ” Electricity theft detection in AMI using customer’s consumption patterns, ” IEEE Transaction on Smart Grid, Vol.7, Issue 1, Pages 216–226, 2016.
- Jindal, A., Dua, A., Kaur, K., et al., ” Decision tree and SVM-based data analytics for theft detection in smart grid, ” IEEE Transaction on Industrial Informatics, Vol. 12, Issue 3, Pages 1005–1016, 2016.
- Angelos, E.W.S., Saavedra, O.R., Cortés, O.A.C., et al., ” Detection and identification of abnormalities in customer consumptions in power distribution systems, ” IEEE Transaction on Power Delivery Vol. 26, Issue 4 , Pages 2436–2442, 2011.
- Miller, Harvey J., and Han, J. “Geographic Data Mining and Knowledge Discovery.” Geographic data mining and knowledge discovery (2001): 1.