Stress Level Classification Using Heart Rate Variability
 , Istrate Dan 1, Badii Atta 3, Gattoufi Said 2, 4, Bennani Az-eddine 5, 6, Wegrzyn-Wolska Katarzyna 7
Adv. Sci. Technol. Eng. Syst. J. 4(3), 38–46 (2019);
 DOI: 10.25046/aj040306
The research programme reported in this paper is set within the framework of our research under the theme of ICT support for Active Healthy Ageing (AHA). This longitudinal empirical research is focused on the study of the impact on the management of cardio-vascular disease if supported by sustained health monitoring using wearable connected devices. One of the key objectives is stress monitoring and its classification during the daily routine of life thus enabling psycho-physiological monitoring to study the correlation between emotional states including variable stress levels and the evolution and prognosis of cardiovascular disease. In this paper, the calibration phase will be studied in order to distinguish between two emotional states: i) meditation and ii) stress condition. For this, the Heart Rate Variability (HRV) features are used as extracted from the RR interval and a support vectors machine (SVM) classifier deployed which resulted in 74% and 87% recognition accuracy based on HRV data for the recognition of the two emotional states, namely meditative, and, stressed, respectively. The main objective is to prevent Cardio-Vascular Disease (CVD) in healthy people and to treat those who already suffer from it. Creating a reference database was our first step in this research project. The sensor choice was made based on doctors’ recommendations. The work methodology was as follows: first validate the « objective data » issuing from the calibration state. Second, set up the automatic algorithm and detect automatically the patient’s emotional states during the experimentation period (subjective data). Third analyse the physical activities correlated to the blood pressure and emotions. This study has involved the challenge of distinguishing the influence of stress versus relaxation on the Cardio-Vascular function and in particular on the risk of exacerbation of pre-existing Cardio-Vascular Disease.
1. Introduction
The Internet of Things (IoT) represents a vision of ambient intelligent devices to support smart environments, lifestyles and hyper-connectivity based on the semantic interoperability of network-centric sensor devices as connected objects [1]. It represents different types of connection (Bluetooth, wireless, etc.) between several sensors within pre-established protocols. The connected objects reach several areas and fields. They can be found in the thermal energy sector, automated manufacturing, smart agriculture, intelligent buildings and healthcare sector. They are linked and connected in order to record, communicate and exchange data in real-time (Figure 1).
Chao Li [2] mentioned that by 2020 the number of connected sensors worldwide would reach 50 billion. It means that in less than 5 years the sensors number have almost doubled (in 2015 it was 25 billion objects). Combining these sensors with computer science tools like big data would increase the French gross domestic product (GDP) by 7% in 2025 [3]
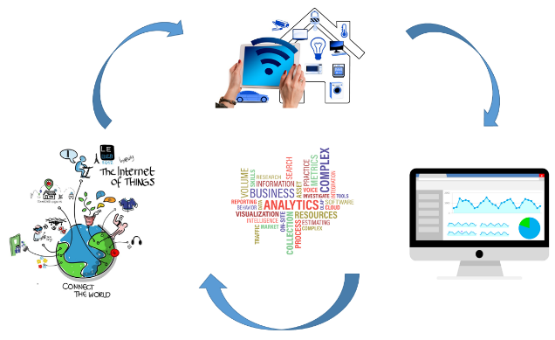 Figure 1. Data exchange and connected devices ( Pixabay)
Hata [4] maintains that our world is mainly composed of three major fields: the environment and its influence on human beings, the technology that enables the sensing and perception of the environment and the physiological and emotional data of the human beings themselves, which in this study in multi-modal HealthCare Monitoring are connected through sensor devices by a complex system-of-systems that includes many operators and exploits the IoT architecture. When operating a healthcare system, the patient’s environment must be managed ensuring their security and safety. The number of connected sensors and the necessity to record data in continuous and anonymous way, accurately using a self-synchronised data acquisition method constitute the paradigmatic challenges in this domain. The sensors measure various parameters and provide real-time data streams that need to be processed for data fusion and model building. Hata’s health management framework [4] is based on a causality model as is this case study. Sensors measure the psycho-physiological states of the user as well as the relevant states of their living environment and the interaction between them. Emotions and human responses are closely related to hormone balance and the environment (lifestyle, work-style). In order to analyse emotion, the fact that feelings are personally interpreted must be taken into consideration. Some people cannot or will not identify their feelings and even if they do, it is still a subjective assessment. For example, a person might state: “I feel stressed” but physiologically it may that the person is just “tired”, or may state “I feel relaxed” while the data indicates that they are stressed. The intercommunications between several areas in addition to the complication of administrating data and decision-making have to be taken into consideration.
2. Cardiovascular diseases
As mentioned in 2017, cardiovascular disease was one of the main causes of death in the world (according to the World Health Organisation). This affects 17 million people all over the world. CVD mainly concerns heart stroke and blood vessels. These diseases are not infections and cannot be passed from person to person. There are different types of CVD, the most common being coronary disease which causes one death in three in the United States every year (source centres for diseases control and prevention). In France, the main cause of death is due to CVD by 33% compared to 5% from digestive system diseases (source INSERM- INSEE). This kind of chronic disease is controlled by risk factors. Some of them cannot be changed like age, gender, family history. However, others can be moderated such as physical activities, obesity, high blood pressure, etc. by reducing those risks with healthier and better life style choices. This is the main objective of this study: to ensure better health care system using information technology. Chest pressure, heart pain, shortness of breath, nausea and feeling heartburn are the main symptoms of heart attack. These aspects are warnings that our body sends us of a dysfunction in our body.
Kernay [5] emphasised the importance of preventing, controlling and treating hypertension diseases, with high priority worldwide especially for developed countries. As figure 2 shows, being in developed or developing countries does not make a significant difference in hypertension risks. Being able to avoid hypertension, coronary disease, and peripheral arterial disease among other CVD is a worldwide healthcare system challenge. The European Cardiovascular Disease report for 2017 [7], shows that despite the age, sex and ethnicity difference between European citizens, CVD still the leading cause of death in Europe.
The aim is to prevent the disease if possible and to manage its treatment using data-analytic tools and connected sensors. Three main factors for CVD have been chosen with doctor’s rrecommendations: Physical activities, regulation blood pressure and controlling emotions.
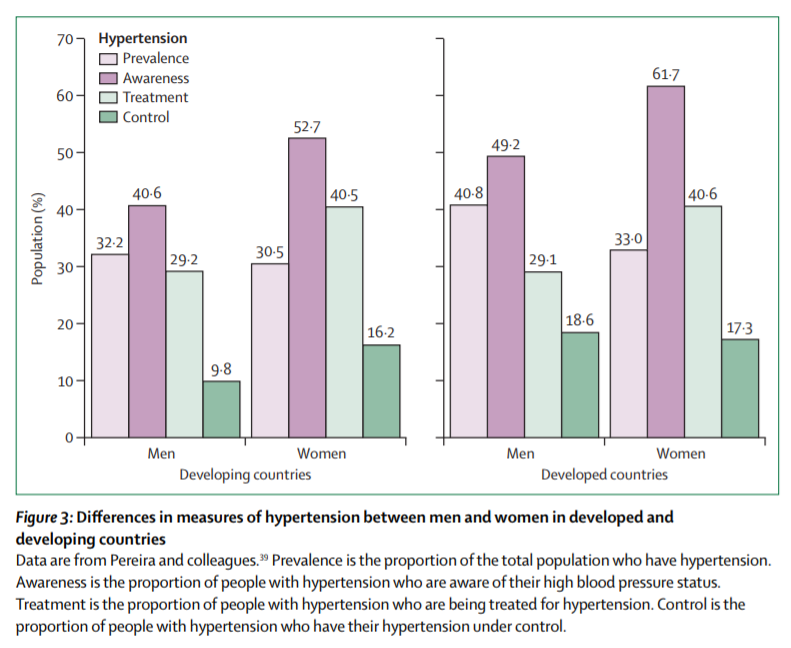 Figure 2. Developed and developing countries: hypertension statistics (Source [6])
In this paper, a methodology will be presented to describe the main idea and objectives, define the experimentation protocol, explain the sensor choice and show the main results segmentation. However, the most challenging part in this research is controlling emotions for stress. For that, how emotion can be detected is explained based on a complex system of heart rate variability.
3. Heart rate variability
The heart rate variability measures the inter-beat interval. Analysing heart rate variability based on RR interval was the focus of the research. Much research has been conducted to show that there is a link between the emotional state, physiological and physic activities.
The HRV analysis can be divided into three areas: the long term (within 24hrs), the short term (about 5 min) and the ultra-short term (less than 5 min). Some research proposes the ultra-sort term from 1 min to 4 min [8]. Between the time domain, the frequency domain and the nonlinear metrics there are about 50 indicators for HRV. Monitoring people during daily routine life was the focus of this research. The calibration phase duration is about 10 minutes of meditation (calm respiration in order to calculate the heart rate frequency in a resting state) and 15 minutes of stress (stressful games like the Stroop colour test, mental arithmetic, etc.). The RR interval is being recorded with a frequency of one per second. In the literature, the HRV analysis has been analysed for a short-term duration and 24hr measurements. There is a total absent of studies conducted on ultra-short term. The purpose of this research is to bring out several indicators relevant to identifying each emotional state during ultra-short-term testing.
The Autonomic Nervous System (ANS) is the part of the nervous system in our body that regulates the function of human organs and the cardiac muscles and glands. It is the vital system for controlling many phenomes in our body: such as temperature changes sending extra blood to some organs, causing a slower heartbeat, etc. This system is divided in two main areas: the parasympathetic system and the sympathetic system. They serve the same organs but have opposite roles. While one excites our body and supports fight or flight reactions to the environment, the other calms it down. When feelings of anxiety, panic, fear, happiness, etc. are experienced, these are initiated by our sympathetic system thus preparing the body for physical activities and emotional responses. In other words, “stress and emotions” are evoked mainly by the sympathetic system while “relaxation and calm responses” are evoked by the parasympathetic system. The analysis of emotions is the focus of this work on stress based on HRV that was calculated from the RR interval extracted from the heart rate monitor belt. The data recording is 1s for each observation. There is not a unique indicator that can categorise the HRV. This complex system takes into consideration the paradoxical behaviour between the parasympathetic system and the sympathetic system as well as the respiratory mechanism. In much research, the LF/HF ratio (Low Frequency/High Frequency) has been considered reliable in presenting sympathovagal balance. Wilhelm [9] confirms that using this ratio for a two-dimensional representation framework can help in stress recognition. However, using only this indicator is not enough for this research thus analysing daily data including different kinds of emotion, such as fear, panic, happiness, stress, satisfaction, etc. This paper presents the potential benefit of using a Support Vector Machine (SVM) to identify mental stress based on heart rate variability. The complexity of heart rate indicates the flexibility of the Autonomic Nervous System (ANS) and sympathovagal modulation effects on HR variability. Several HRV indicators were taken into consideration from the time and frequency domains to Poincaré and statistical analysis. The objective was to distinguish between the effects of sympathovagal fluctuations and emotion on HR variability.
Emotions and the way they are expressed are different from one person to another. Many studies were conducted into this area, and most of them show that having a positive attitude, surrounded by positive feelings, helps people to live longer compared to those who are always feeling angry, afraid and stressed. In 1977, the American psychologist Caroll Ellis Izard classified emotions into ten categories; joy, surprise, sadness, anger, disgust, contempt, shame, fear, guilt, interest or excitement. As cited, stress is not technically an emotion. It is a feeling that based on a reaction or a stimulus. A recent study in 2018 [10], based on the state-of-the-art of 37 publications showed that heart rate variability is a reliable indicator for stress recognition.
4. The proposed work and other related works
This is not the first work undertaken on stress and HRV as mentioned in the related work in the paper. But the novel contribution is that this work will be the first to separate different kinds of emotion during daily life. No related work has been conducted that mentioned how to distinguish between happiness, being angry, stressed or feeling relaxed. No related research undertook daily monitoring for patient/participants.
There have been no previous studies deploying a similar methodology of longitudinal real-life study of the psycho-physiological correlates of evolution and exacerbation of cardio-vascular conditions. This study was initiated responsive to earlier mainly clinically controlled studies [11], [12], [7] which involved data capture in the context of a few specifically detectable activities (such as preparing food, climbing stairs, using a smartphone, etc.). As of 2018 some work has been mainly concerned with feature extraction [9]; others have used various approaches for stress detection e.g. a survey approach [10], saliva and cortisol level [11]. Others have used controlled studies to evaluate the impact of fast food consumption [12] lifestyle in terms of cardio-vascular disease risk and some have involved data capture in an IOT-enabled controlled smart home context [13]. The approach followed here is distinguished by being based on an ambulant environment (rather than being clinically controlled), connected-devices-enabled continuous data measurement including contemporaneous self-expression recordings of the participant’s perceived feelings and mood. The project objective is to extract information and correlations from different types of data (corporal and sentimental) and to bring up analysis that will present the impact of these variables and features on cardiovascular diseases in terms of prevention and treatment. The experiments started with data acquisition involving healthy individuals paving the way for addressing sensor integration, data acquisition, storage and integration issues and evaluating the experimental set-up for the future. This paper explains the project methodology, experiments already conducted and those planned to be carried out within INSEAD-Sorbonne Université. Firstly, the sensor choice was explained, secondly, the concept and objectives were described and demonstrated and the questionnaires were tested and validated. Finally, the experimentation and analysis tools were defined. sensors currently available on the market can support the measurement of three categories of data regarding the cardio-vascular function; namely: i) the physiological parameters such as activity level, ii) arterial pressure, iii) stress level. The research purpose is to build an automatic system detection capable of recognising different types of emotion and to categorising feelings and mood according to heart beat, arterial pressure among several other variables. Moreover, the work’s contribution is to ensure monitoring participants while they are wearing sensors during their daily life. Despite the fact that not all the stress-creating factors are manageable, the conducted experience gave rise to reliable data that illustrate participants’ spontaneous feelings and mood. As the experimentation has been conducted over a long period, the part that concerns data storage and management had to be handled securely.
5. Materials and methods
5.1. Wearables sensors
Before launching this research, a literature review was conducted . The idea was to study the types of existing sensors on the market and to the research carried out already [8]. The sensor choice was based on three hypotheses that are explained as follows:
- Blood Pressure or the blood circulation is highly correlated with cardio vascular diseases[14, 15] and thus identifying the flow of blood circulation with a connected sensor remains an important part to maintain a stable blood pressure. Hastie and Gluszek [16, 17] mentioned that it is essential to measure heart rate variability in order to manage and control the risk of having a cardiovascular disease.
- Nutritional attitude and physical activities are two important factors that people should take into consideration in order to prevent the apparition of cardiovascular diseases [18].
- Feeling overwhelmed, anxious, stressed among several other feelings, are factors that can be the main cause for the appearance of chronic diseases. These cognitive and emotional factors, have not yet been measured in an ambulatory approach [13, 19, 20].
To satisfy the hypothesis mentioned above and to set up this experiment, 3 connected objects were selected. They will measure the physical activity, the blood pressure and heart rate variability. So each participant was given a connected tensiometer, a heart rate monitor belt and a smart watch.
Tensiometer
Following a study of user acceptance, reliability and wearability criteria, the tensiometer «Rest» AD761f was selected as one of the sensors to be integrated within the body area sensor network (see Fig.3). Tensiometers of this brand are among the first to have passed the European Society of Hypertension (ESH) protocol [21], [22]. This device enables the detection of a person’s rest condition using the Hemodynamic Stability Determination technique (HSD).
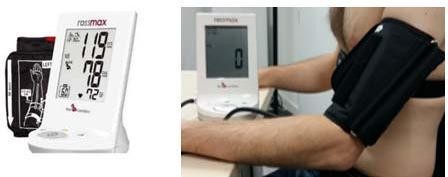 Figure 3. Rossmax tensiometer
The smartwatch ActiGraph
Dinseh [23,24], states that the actigraph is one of the most reliable widely used accelometers in scientific research. This smart watch is an activity monitor (Figure 4) tested, tried and approved by many researchers and practitioners [25, 26] as a reliable sensor giving accurate data. As the trial was over a long period and the objective was to monitor people during their daily life, many limitations were imposed on the sensor choice. It had to be small, discreet, user friendly, giving reliable data. As the sensor placement affects the degree of data accuracy, all participants were asked to carry this connected device in the same position on their waist (Figure 4)
Both raw and calibrated data were extracted at a range of sampling frequencies (ranging from 30 Hz to 100 Hz).
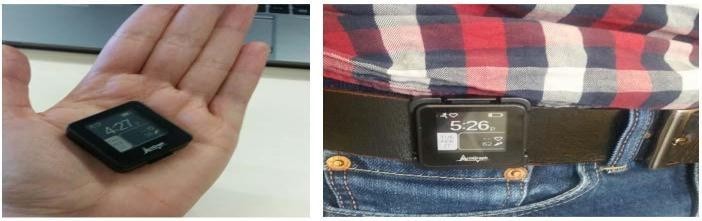 Figure 4. Actigraph sensor worn
The heart rate monitoring belt: Polar H7
For emotional state monitoring and measurement specifically stress, a state-of-the-art analysis of the emotional states sensing technology was performed as well as a study of the readymade solutions for this which could be mass-scalable. To quantify emotions and feeling many tools and techniques are available specially to measure stress among other feelings. This mental pressure and feeling is one of the main factors that accentuates the appearance of CVD among chronic diseases [19] [20] [55].
Marek and Hamilton [33, 34] specified measuring HRV as a reliable technique for categorisation of several kinds of emotions. For this reason participants were equipped with the heart rate monitor belt to measure HRV based on the RR interval (figure 5)
 Figure 5. The Heart Rate Monitor Belt
5.2. Methodology
The methodology was based on the aim of this work, to treat people with CVD and to prevent the apparition of chronic diseases especially cardiovascular ones. This project methodology was centred on studies that explain the association between the emotional states and heart rate variability [35, 36].
One of the important emotion types to be monitored is stress which can lead to CVD, specifically chronic stress increasing blood pressure and exacerbating CVD; the physiological and psychological reactions to stress can manifest as both anxiety and depression. The stress monitored was real life stress and not induced or simulated for experimental purposes [37]. Vaping and smoking, being overweight or obese, the absence of physical activities, being anxious and stressed are factors that will put healthy participants at risk. The trial duration was 15 days in which participants wore the three sensors according to the user manual. No restriction was imposed. Participants were not asked to change their daily routine nor to be more active. This study is distinguished by the fact that the key psycho-physiological data relevant to cardio-vascular function was captured continuously over a long period to support offline analysis, rather than on a one–off diagnostic basis. This trial was validated in three steps. First, the experts decided the inclusion and the exclusion criteria to select different participants. Second, three online surveys were tested on the UTC team. According to their feedback more questions were added. Third, the procedure was validated and all the experimentation protocol was validated by the INSEAD ethical committee.
5.3. The experimental protocol
This project was established in collaboration with the Institut Europeen d’Administration des Affaires (INSEAD). The experimentation protocol took the welfare of the participants into consideration. The main research goal is to measure some variables via the sensors and devices and to extract features from this data. The main work needs to be done on patients with CVD. Nevertheless, the study with the INSEAD lab was performed on healthy people. A database reference was necessary and so the trial was launched with participants with no chronic diseases who were closest to the sociodemographic criteria of France.
Before launching this experiment, two main exclusion criteria were imposed: having a chronic disease and not reaching the age of majority (18-19 years old). People would wear the sensors every day during the trial. Physiological and emotional parameters will be measured continuously.
Candidates were assigned coded identities, which were transmitted once the trial started. The protocol ID is ID February2018/1. It was approved by the Ethical Committee in INSEAD. All data are anonymously collected and treated.
A quantitative study was performed before starting the recordings. First doctors from different specialities (neurologist, cardiologist and generalist) were questioned. This enabled the categorisation of the three main areas that will affect chronic diseases generally and CVD specifically. Next a focus group was set up with the UTC lab in order make sure that all the questions are clear and easy to understand (as few questions have medical terms). Age, antecedent diseases, physical activity, eating habits and emotion were the main features that doctors proposed to focus on. An emotional eating a validated questionnaire concerning emotion and eating was conducted inspired by Garaulet et al. [38].
The three main questionnaires were implemented on Qualtrics (within INSEAD Sorbonne université). Each participant had to enter his/her own code to express how the study was conducted. The main three surveys are as follow:
- The pre-selection questionnaire: Selecting people according to the inclusion criteria
- Before experiment questionnaire: Analysing participants’ physical activity, eating habits, the general assessment of the candidate’s health (smoking, alcohol, obesity …).
- After experimentation questionnaire:the main purpose is to study the candidate’s satisfaction with the experience, focus on participant’s recommendation, find out if the experiment helped candidate to change his/her dietary habits and becoming an active person.
- Procedure
The trial duration is 2 weeks; during which candidates must wear three connected objects. The heart rate monitor belt should be worn at least 2-3 hours per day. The tensiometer for morning and evening measurements and the activity tracker all day long.
After selection of each participant, a meeting took place with them in order to explain experimentation’s protocol. Participants were informed that we created a forum free place to ask questions and exchanging with each other and giving their feedback about the experience. They were given a user manual re the tools, how and when to wear sensors. They were also given a notepad in which to write down their feelings, physical activities and emotions while they are wearing the sensors.
They were also told that the experiment was not to be regarded as an alternative to any medical or other treatment and informed about the FORUM, a free and anonymous point of exchange of ideas to be used to analyse participants’ responses [39], enabling participants to write their feelings anonymously, their issues as well as their remarks and questions. Before starting the experience, candidates had to read and sign the protocol. Once the study is over, they have to bring back the sensors to INSEAD and so getting a financial compensation for their effort during this trial (Figure 6)
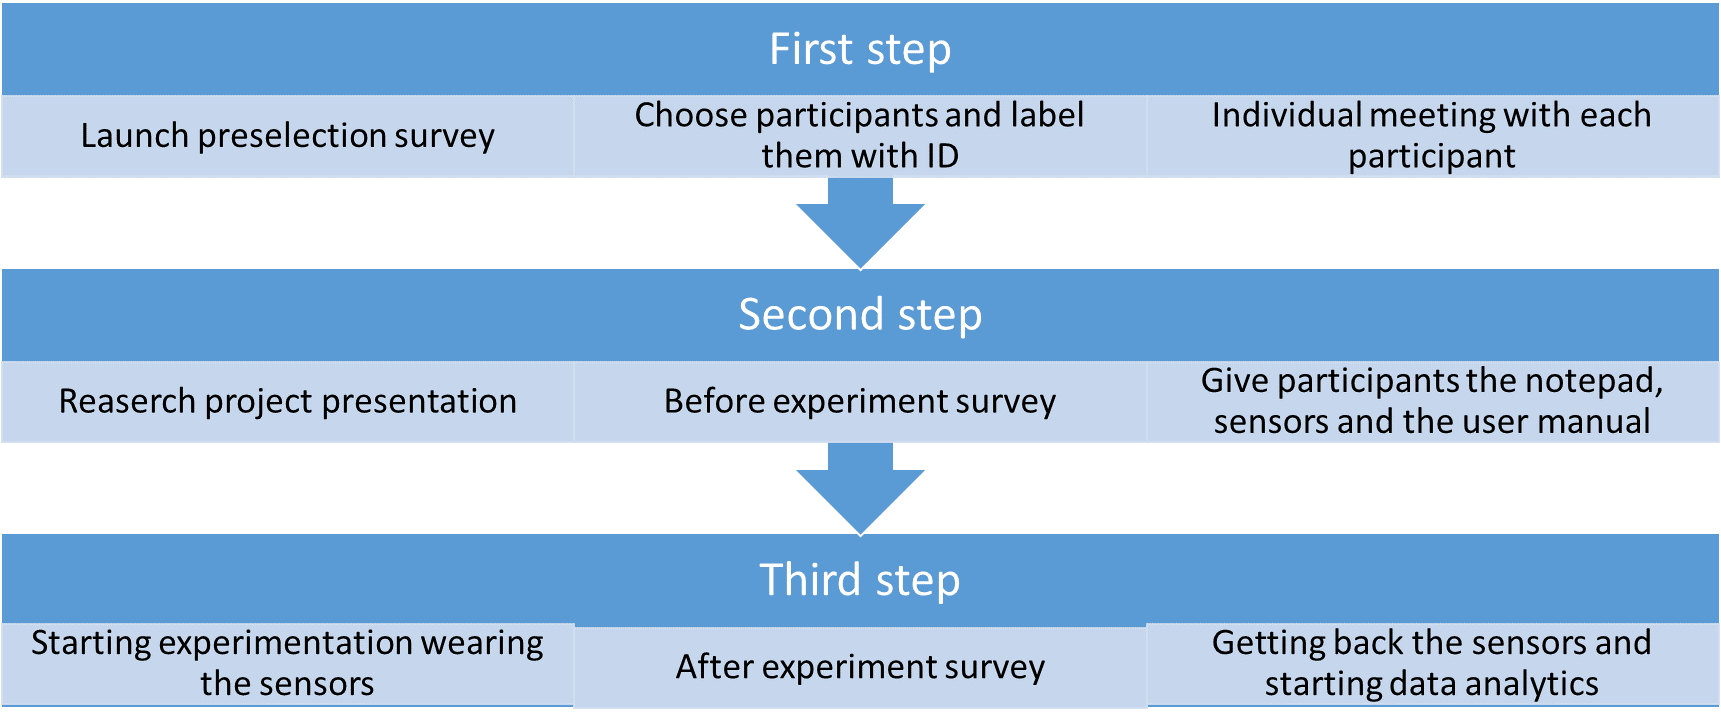 Figure 6. The description of the experimentation protocol
- Subjects
Before recruitment began, the intention was to have a population similar to the French population described by the INSEE; 23 men and 22 women. However, recruiting people depends on their flexibility, motivation, availability and eligibility. The trial duration was 4 to 5 months during which 53 participants took part wearing the devices for 15 days each. Candidates were from different socio-professional categories, different levels of study and age category. In this section, some statistical results of the population are presented and participant feedback.
As the graph shows (Figure 7) almost 40% of our population are healthy people with no cardiovascular disease who are aged over 40 years. Recruiting men for this study was not a simple task.
 Fig. 7. Age Categories
The final population is composed of ¾ women and ¼ men. Obtaining certain variables during sensor initialisation enabled the comparison of the participants’ measurements. The Body Mass Index (BMI) is calculated as follows: BMI = mass / height^2. The interpretation is as follows:
- If BMI <= 18.5 : the participant is in underweight area
- 18.5 <BMI <= 25 : the participant is in a normal weight area
- 25 <BMI <= 30 : the participant is overweight
- 30 <BMI <= 35 : the participant is in a moderate obesity area
- 35 <BMI <= 40 : the participant is in a severe obesity area
- 40 <IMC : the participant is in an obesity morbid area
57% of participants have a normal weight with only 4% having morbid obesity (see Figure 8). 31% is the wear time validation for less than 40% of participants. This shows that participants were motivated to carry out the experiment
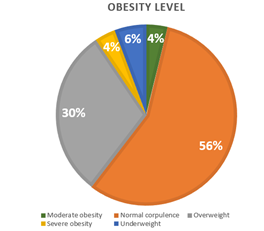 Fig. 8. Obesity Level
6. HRV and calibration phase
Heart rate variability is highly used for emotions analysis like anxiety, fear and specially stress. In fact, the HRV is described by several parameters and biomarkers. There are features that are calculated in the statistical domain, time serial domain and others are in the frequency domain. One powerful biomarkers for stress detection based on HRV analysis is the LF/HF ratio (Low frequency/ High frequency).
The interpretation is based on two hypotheses: the ratio LF/HF must be interpreted. If its value is less than one it shows that the person is feeling relaxed, sleeping or just resting. Otherwise it means that the participant is carrying out a physical activity, running or feeling stressed
The first HRV analysis of recordings on Kubios, showed the confirmation or the two hypotheses mentioned above (Figure 9 and 10)
 Fig. 9. Kubios HRV analysis that shows a participant doing a physical activity
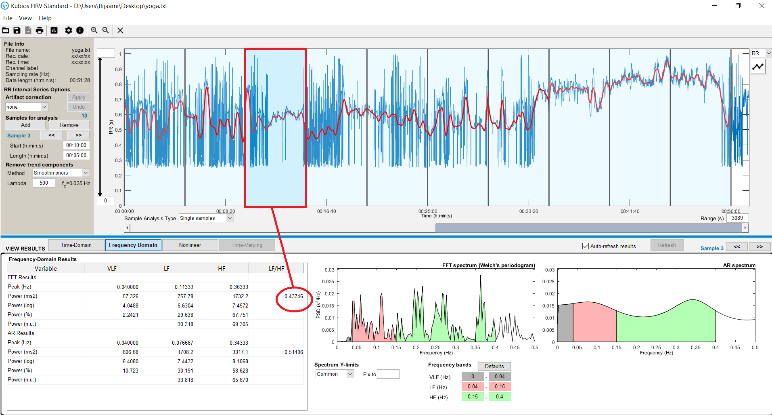 Fig. 10. Participant in rest condition (yoga class)
Before starting this experiment with the collaboration with INSEAD Sorbonne Université, a « blind test » was set up with the UTC member lab. The idea was to make sure that the equipment and sensors are connected and that they were friendly user.
While analysing the HRV based on participants, notes (on the notepad) it was deduced that sometimes there is no correlation between what is written on the notepad and the HRV analysis. In fact, emotions are our personal interpretation. For example, participant A can write on the notepad ‘feeling stressed’ and while analysing data of participant A we found that he was not stressed. In addition, the fact that people sometimes have difficulty identifying their feelings has to be taken into consideration. It was therefore decided that ‘reliable data’ was needed which meant recording data while observing what is actually happening. This was called that the ‘calibration state’. Games were developed to stress people. Before starting the experimentation, participant had to spend 20 min of recording ‘reliable data’ starting with 10 min of deep respiration and meditation. After that 10 minutes of playing stressful games that are reported as follows: Starting with 3 minutes of a mathematical mental exercise, next playing the ball game for 3 minutes and finishing with the Stroop Colour Word Test, the cognitive stressful test. These games were developed using Visual Studio and Scratch (Fig. 11). Despite the fact that the game’s idea is validated in advanced research [40], it was decided to develop them so they can be user friendly in an interactive way and adjust the speed games, another helpful factor for boosting the participant’s stress. Before launching these games, they were trialled on 13 users from the UTC Lab and the graphical interface was adjusted according to their feedback and remarks.
 Fig. 11. Interactives games
7. Support Vector machine
To analyse the HRV there are distinct techniques that enabled the extraction of several features. The support vector machine is often used in statistical machine learning theory to solve classification issues in several areas in the medical field. Lanata [41] used this algorithm to identify horses’ response to human fear and happiness. Mirhoseini [42] used it to detect early cardiac death while this pattern recognition classifier was also used for health care applications based on Heart Rate Variability [45-50]
The main use of this supervised algorithm is to distinguish between two classes (or more). Having a set of points in a feature space, each point is associated to a label. The dispersion of a group of points with the description is made up of a straight line or a hyperplane (in the context of two dimensions).
Nevertheless, the problem of machine learning only functions if the data has a linear structure, which is not the case here where the SVM with RBF Kernel (Radial Basis Function Kernel) was used to overcome this.
8. Results
Fred Shaffer and Roman Baevsky [43] [44] mentioned all the state of the art of research that has used the ECG signal and RR interval to interpret the HRV. The results shown in this section, concern the calibration phase. An Ultra short-term period (less than 5 min of analysis). Corresponding features were extracted and some statistical variables were added. A feature was created [24] for arrhythmia detection (if the HTI <= 20.42 and RMSSD<= 0.068 then the heart rhythm is normal, and if the HTI> 20.42 then there is a presence of arrhythmia). The ‘HRV Tool’ implemented by Marcus Vollmer [53] on Matlab was used; in order to extract some features from the RR signal. During this calibration phase 34 participants were chosen and the data divided into two categories: stress label and relaxation label. Work was chosen with a signal processing ‘windows of 90s with recovering of 50% [45]. The 24 selected features are described in the table 1.
Table 1. Different features
| Domain | Features |
| Time Domain
|
SDSD, PNN50, NN50, RMSSD, HRV triangular index (HTI) Mean RR, Standard deviation, coefficient of variation, rrHRV and TINN[44] , [45]
|
| Frequency Domain
|
VLF = Very Low Frequency (0.0033-0.04 Hz), LF= Low Frequency (0.04-0.15 Hz), HF = High Frequency (0.15-0.4 Hz), pLF, pHF and LF/HF ratio[46],[47] |
| Statistics analysis
|
KURTO, Skeww, Interquartile, Arrythmia (that detect the arrhythmia corresponding to [44])
|
| Poincare plot
|
SD1, SD2 and SD1SD2ratio, approximate entropy (ApEn)[49] ,[50]
|
The data was divided into two datasets: 80% for training data and 20% for test data. We made a k fold (k= 5) so the final obtained value is an average of the 5 iteration inside the SVM model. The table below shows the main results with 74.44% of good recognition rate:
Table 2. Confusion Matrix
| Class 1 | Class 2 | % good recognition rate | |
| Class 1 | 48 | 38 | 55.81 % |
| Class 2 | 17 | 115 | 87.12 % |
9. Discussion and conclusion
Our study mainly concerned monitoring patients with chronic diseases at home and controlling heart rate variability with wearable sensors. The experimental protocol was conducted with 50 participants who were equipped with 3 connected objects which. they had to wear for 15 days and to record, on the notepad provided, what they were doing (activity level) and how they were feeling throughout the day. Before launching this experiment and in order to ensure the accuracy of the acquired data, each participant had to undergo a « calibration phase ». In this paper the methodology and the results obtained from analysing the calibrated data are presented. The SVM on the RR measurements were applied to interpret the heart rate variability based on the activity and stress levels during any period of observation.
34 RR interval signals, including two different beat types (stress and meditation) were selected. 24 features were selected and the support vector machine algorithm was applied. The HRV signal extraction from each RR interval showed over 74% of accurate recognition. The optimisation of the use of features and thus the reduction of the error rate will be the aim of future work. The algorithm has a recognition accuracy of over 87% for class 2 that indicates the stress induced from playing games. The population was divided by age and gender in order to obtain a more efficient classification [54].
- D. Miorandi, S. Sicari, F. De Pellegrini, and I. Chlamtac, “Internet of things: Vision, applications and research challenges,” Ad Hoc Networks, vol. 10, no. 7, pp. 1497–1516, 2012.
- C. Li, X. Hu, and L. Zhang, “The IoT-based heart disease monitoring system for pervasive healthcare service,” Procedia Comput. Sci., vol. 112, pp. 2328–2334, 2017.
- I. Montaigne, “Big data et objets connectés Faire de la France un champion,” Rapport, p. +200, 2015.
- Y. Hata, S. Kobashi, and H. Nakajima, “Human Health Care System of Systems,” IEEE Syst. J., vol. 3, no. 2, pp. 231–238, 2009.
- Y. G. Smeyers and M. Villa, “A study of the internal dynamics of inverting trimethylamine by means of the non-rigid group theory,” Mol. Phys., vol. 101, no. 12, pp. 1795–1803, 2003.
- K. B. Tibazarwa and A. A. Damasceno, “Hypertension in developing countries,” Can. J. Cardiol., vol. 30, no. 5, pp. 527–533, 2014.
- Wilkins E. et al., “European Cardiovascular Disease Statistics 2017 edition,” Eur. Hear. Network, Brussels, p. 192, 2017.
- W. von Rosenberg, T. Chanwimalueang, T. Adjei, U. Jaffer, V. Goverdovsky, and D. P. Mandic, “Resolving ambiguities in the LF/HF ratio: LF-HF scatter plots for the categorization of mental and physical stress from HRV,” Front. Physiol., vol. 8, no. JUN, pp. 1–12, 2017.
- H. G. Kim, E. J. Cheon, D. S. Bai, Y. H. Lee, and B. H. Koo, “Stress and heart rate variability: A meta-analysis and review of the literature,” Psychiatry Investig., vol. 15, no. 3, pp. 235–245, 2018.
- C. Zhu et W. Sheng, « Multi-sensor fusion for human daily activity recognition in robot-assisted living », in Proceedings of the 4th ACM/IEEE international conference on Human robot interaction, 2009, p. 303–304.
- L. Bao et S. S. Intille, « Activity recognition from user-annotated acceleration data », in Pervasive computing, Springer, 2004, p. 1–17.
- A. J. Brush, A. K. Karlson, J. Scott, R. Sarin, A. Jacobs, B. Bond, O. Murillo, G. Hunt, M. Sinclair, K. Hammil, et others, « User experiences with activity-based navigation on mobile devices », in Proceedings of the 12th international conference on Human computer interaction with mobile devices and services, 2010, p. 73–82.
- D. Huysmans et al., “Unsupervised Learning for Mental Stress Detection – Exploration of Self-organizing Maps,” Proc. 11th Int. Jt. Conf. Biomed. Eng. Syst. Technol., no. January, pp. 26–35, 2018.
- Z. Jinbiao, L. Mao, and S. Oceanic, “- 8. 6,” vol. 10, no. 4, pp. 609–611, 1991.
- C. Höcht, “Blood Pressure Variability: Prognostic Value and Therapeutic Implications,” ISRN Hypertens., vol. 2013, p. 16, 2013.
- C. E. Hastie, P. Jeemon, H. Coleman, L. McCallum, R. Patel, J. Dawson, W. Sloan, P. Meredith, G. C. Jones, S. Muir, M. Walters, A. F. Dominiczak, D. Morrison, G. T. McInnes, and S. Padmanabhan, “Long-term and ultra long-term blood pressure variability during follow-up and mortality in 14,522 patients with hypertension.,” Hypertension, vol. 62, no. 4, pp. 698–705, 2013.
- J. Głuszek and T. Kosicka, “Visit-to-visit blood pressure variability and cardiovascular and kidney diseases,” Nadcisnienie Tetnicze, vol. 20, no. 1, pp. 26–31, 2016.
- M. et al. Poelman, “Relations between the residential fast-food environment and the individual risk of cardiovascular diseases in the Netherlands: a nationwide follow-up study,” Eur. J. Prev. Cardiol., no. April, 2018.
- P. Krolak-Salmon, “La reconnaissance des émotions dans les maladies neurodégénératives,” Rev. Med. Interne, vol. 32, no. 12, pp. 721–723, 2011.
- S. Montel and C. Bungener, “Les troubles de l’humeur et des émotions dans la sclérose en plaques : une revue de la littérature,” Rev. Neurol. (Paris)., vol. 163, no. 1, pp. 27–37, 2007.
- Tasker F, de Greff A, Liu B, Shennan AH “Validation of a non-mercury ascultatory device according to the European Society of Hypertension protocol: Rosssmax Mandaus II. Blood Press. Monit”.14, pp.121–4, 2009.
- Zhang, L., Kang, Y. Y., Zeng, W. F., Li, Y., & Wang, J. G, “Validation of the Rossmax CF175 upper-arm blood pressure monitor for home blood pressure monitoring according to the European Society of Hypertension International Protocol revision 2010”, Blood pressure monitoring. Rev. 20(2), pp. 104-107, 2015.
- P. Under and T. H. E. Hood, “NIH Public Access,” vol. 44, pp. 1–6, 2013.
- A. Manuscript, A. Vertical, and A. Counts, “NIH Public Access,” vol. 33, no. 2, pp. 219–230, 2013.
- Coker-Bolt, P., Downey, R. J., Connolly, J., Hoover, R., Shelton, D., & Seo, N. J. “Exploring the feasibility and use of accelerometers before, during, and after a camp-based CIMT program for children with cerebral palsy”. Journal of pediatric rehabilitation medicine, 10(1), pp. 27-36, 2017.
- S. R. Dandu, M. M. Engelhard, A. Qureshi, J. Gong, J. C. Lach, M. Brandt-Pearce, and M. D. Goldman, “Understanding the Physiological Significance of Four Inertial Gait Features in Multiple Sclerosis,” IEEE J. Biomed. Heal. Informatics, vol. 22, no. 1, pp. 40–46, 2018.
- Williams, R. A., Hagerty, B. M., & Brooks, G “Trier Social Stress Test: A method for use in nursing research. Nursing research”, 53(4), 277-280, 2004.
- R. Schollmeier and T. Universitat, “A Definition of,” vol. 15, no. 1, pp. 101–102, 2002.
- M. Gröschi, “Données actuelle sur l’analyse hormonale salivaire. Current status of salivary hormone analysis,” Ann Biol Clin, vol. 67, no. 5, pp. 493–504, 2009.
- D. Nishimura, “Graphically speaking,” Science (80-. )., vol. 283, no. 5405, p. 1134, 1999.
- M. R. Ebben, V. Kurbatov, and C. P. Pollak, “Moderating laboratory adaptation with the use of a heart-rate variability biofeedback device (StressEraser®),” Appl. Psychophysiol. Biofeedback, vol. 34, no. 4, pp. 245–249, 2009.
- M. E. G. H. O’Donnell C., “Detection and management,” EmbaseTransfusion Med., no. October 2017, pp. 64–69.
- M. Marek, “Guidelines Heart rate variability,” Eur. Heart J., vol. 17, no. March, pp. 354–381, 1996.
- J. L. Hamilton and L. B. Alloy, “Atypical reactivity of heart rate variability to stress and depression across development: Systematic Review of the literature and directions for future research,” Clin. Psychol. Rev., vol. 50, pp. 67–79, 2016.
- M. R. Gunnar, D. Ph, A. Herrera, C. E. Hostinar, and B. Sc, “Stress et développement précoce du cerveau,” pp. 1–8, 2009.
- J. Ham, D. Cho, J. Oh, and B. Lee, “Discrimination of multiple stress levels in virtual reality environments using heart rate variability,” 2017 39th Annu. Int. Conf. IEEE Eng. Med. Biol. Soc., pp. 3989–3992, 2017.
- M. Buckert, J. Oechssler, and C. Schwieren, “Imitation under stress,” J. Econ. Behav. Organ., vol. 139, pp. 252–266, 2017.
- M. Garaulet, M. Canteras, E. Morales, G. López-Guimera, D. Sánchez-Carracedo, and M. D. Corbalán-Tutau, “Validación de un cuestionario de comedores emocionales para uso en casos de obesidad; cuestionario de comedor emocional (CCE),” Nutr. Hosp., vol. 27, no. 2, pp. 645–651, 2012.
- B. Liu, “Sentiment Analysis and Opinion Mining,” no. May, pp. 1–108, 2012.
- D. Huysmans, E. Smets, W. De Raedt, C. Van Hoof, K. Bogaerts, I. Van Diest, and D. Helic, “Unsupervised Learning for Mental Stress Detection – Exploration of Self-organizing Maps,” Proc. 11th Int. Jt. Conf. Biomed. Eng. Syst. Technol., no. January, pp. 26–35, 2018.
- Lanata, A., Nardelli, M., Valenza, G., Baragli, P., D’Aniello, B., Alterisio, A., … & Scilingo, E. P. (2018, July). A Case for the Interspecies Transfer of Emotions: A Preliminary Investigation on How Humans Odors Modify Reactions of the Autonomic Nervous System in Horses. In 2018 40th Annual International Conference of the IEEE Engineering in Medicine and Biology Society (EMBC) (pp. 522-525). IEEE.
- Mirhoseini, S. R., JahedMotlagh, M. R., & Pooyan, M. (2016). Improve accuracy of early detection sudden cardiac deaths (SCD) using decision forest and SVM. In International Conference on Robotics and Artificial Intelligence (ICRAI), USA Google Scholar.
- Shaffer, F., & Ginsberg, J. P. (2017). An overview of heart rate variability metrics and norms. Frontiers in public health, 5, 258(over view of heart rate)
- Jovic, A., & Bogunovic, N. (2011). Electrocardiogram analysis using a combination of statistical, geometric, and nonlinear heart rate variability features. Artificial intelligence in medicine, 51(3), 175-186.
- Guo, H. W., Huang, Y. S., Lin, C. H., Chien, J. C., Haraikawa, K., & Shieh, J. S. (2016, October). Heart Rate Variability Signal Features for Emotion Recognition by Using Principal Component Analysis and Support Vectors Machine. In 2016 IEEE 16th International Conference on Bioinformatics and Bioengineering (BIBE) (pp. 274-277). IEEE
- Salahuddin, L., Cho, J., Jeong, M. G., & Kim, D. (2007, August). Ultra short term analysis of heart rate variability for monitoring mental stress in mobile settings. In Engineering in Medicine and Biology Society, 2007. EMBS 2007. 29th Annual International Conference of the IEEE (pp. 4656-4659). IEEE.
- Park, D., Lee, M., Park, S., Seong, J. K., & Youn, I. (2018). Determination of Optimal Heart Rate Variability Features Based on SVM-Recursive Feature Elimination for Cumulative Stress Monitoring Using ECG Sensor. Sensors, 18(7), 2387.
- Venkatesan, C., Karthigaikumar, P., Paul, A., Satheeskumaran, S., & Kumar, R. (2018). ECG Signal Preprocessing and SVM Classifier-Based Abnormality Detection in Remote Healthcare Applications. IEEE Access, 6, 9767-9773.
- Ashtiyani, M., Lavasani, S. N., Alvar, A. A., & Deevband, M. R. (2018). Heart Rate Variability Classification using Support Vector Machine and Genetic Algorithm. Journal of Biomedical Physics and Engineering, 8(4 Dec).
- Lyle, J. V., Charlton, P. H., Bonet-Luz, E., Chaffey, G., Christie, M., Nandi, M., & Aston, P. J. (2017). Beyond HRV: analysis of ECG signals using attractor reconstruction. Computing, 44, 1.
- Lee, H. G., Noh, K. Y., & Ryu, K. H. (2008, May). A data mining approach for coronary heart disease prediction using HRV features and carotid arterial wall thickness. In BioMedical Engineering and Informatics, 2008. BMEI 2008. International Conference on (Vol. 1, pp. 200-206). IEEE.
- Baevsky, R. M., & Chernikova, A. G. (2017). Heart rate variability analysis: physiological foundations and main methods. Cardiometry, (10).
- Vollmer, M. (2015, September). A robust, simple and reliable measure of heart rate variability using relative RR intervals. In Computing in Cardiology Conference (CinC), 2015 (pp. 609-612). IEEE.
- BLK Antelmi, I., De Paula, R. S., Shinzato, A. R., Peres, C. A., Mansur, A. J., & Grupi, C. J. (2004). Influence of age, gender, body mass index, and functional capacity on heart rate variability in a cohort of subjects without heart disease. The American journal of cardiology, 93(3), 381-385.
- Amira, T., Dan, I., Az-eddine, B., Ngo, H. H., Said, G., & Katarzyna, W. W. (2018, June). Monitoring chronic disease at home using connected devices. In 2018 13th Annual Conference on System of Systems Engineering (SoSE) (pp. 400-407). IEEE.