Energy Consumption Evaluation of Air Cooled Chiller With Cold Storage System Powered by Photovoltaic Modules

Adv. Sci. Technol. Eng. Syst. J. 4(3), 235–243 (2019);
 DOI: 10.25046/aj040331
Renewable energy becomes an appealing technology used in many applications in our life. Environmentally, it reduces CO2 emissions and enhances the sustainability of the system. This paper study the benefits of using a photovoltaic system with a thermal storage tank to power air-cooled chiller, in two different scenarios. The simulation methodology is adopted in this research to study the various scenarios of the combination of the utility, photovoltaic system, thermal storage tank, and air-cooled chiller. The scenarios are based on TRNSYS simulation software. The two scenarios investigated in this study include supplying an air-cooled chiller using a photovoltaic system integrated with the grid. While the second one is to study the photovoltaic system integrated with the grid as well as a thermal storage tank. It was found that the reduction of the consumed energy in the first scenario reduced by 81%. Also, CO2 emissions reduced by 72%. In addition, the payback period equalled nine years and generated $4,350 in total profit along the project life cycle. The second scenario saves 75.6% of the utility energy consumption and decreases CO2 emissions by 68%. Moreover, the payback period becomes 12.4 years with $3,202 in total profit generated.
1. Introduction
As innovations advance and the cost of fossil fuel assets develops rapidly, the expanding focus on renewable energy assets is tracked [1]. Recently, the use of solar photovoltaic (PV) systems has increased significantly due to the reduction in the cost of using this technology, in addition to the negative environmental impact of the use of conventional fossil fuels [2,3]. There are several types of PV systems, mostly grid connected, with some also serving as standalone systems. Solar PV systems can be integrated into several devices and applications [4,5]. For example the use of solar photovoltaic energy to power refrigerators has great potential for lowering running costs while also providing high reliability. In addition, this power source has the potential to lengthen the lifespan of kerosene refrigerators, as well as diesel generators, which have been generally used in remote areas. On the other hand, thermal energy storage (TES) systems can play a remarkable role in energy savings by shifting it from on-peak load to off-peak load for cooling by use by the TES system. TES is one of the best methods energy management methods and provides several economic advantages [6-8]. Dincer [9] introduced various examples of cooling thermal energy storage (CITES) and analyzed them through from energy efficiency, environmental and economic advantages.
Many researchers have developed studies and experiments based on vapor compression refrigeration systems driven by photovoltaic cells. Deshmukh1 et al. [10], developed a performance evaluation of a PV system designed for a DC refrigerator. Performance testing of the PV system at no load and full load conditions were carried out to assess the system’s technical viability and average PV conversion efficiency. It was found that energy efficiency at both no load and full load conditions were about 8.5% and 11% respectively. Kalbande et al. [11], developed a photovoltaic system for a DC refrigerator were designed and developed to meet the needs of most rural areas which have no access to a national grid or with unstable and erratic electricity supply. The solar photovoltaic operated DC vapor compression refrigeration system under test was able to maintain the temperature as specified by the World Health Organization (WHO) for the vaccine preservation (2-8°C). The average photovoltaic conversion efficiency and exergy efficiency of the refrigerator was found to be closer to about 12.05% and 14.20% on full load condition. Fatehmulla et al. [12], studied the performance of the refrigeration system with a PV module is significantly good. Cost comparison between the PV (photovoltaic energy or solar energy) and conventional energy (electrical energy) demonstrates the economic effectiveness of the energy efficient low power PV refrigeration system which, is green, clean and safe, in view of the calculations and the initial cost of our PV system including the initial electrical installation cost to run the low power refrigeration system. The thermal storage tank is a promising new technology that is used to transfer thermal power during periods when power is conserved and stored until it is needed. Rismanchi et al. [13], provides an economic cost-benefit analysis of the system, including the chiller and storage systems. The study was conducted for a range of 100–2000 tonnes of refrigeration (TR) (352–7034 kW), under two storage methods, specifically full storage and load leveling storage strategies. In Rahdar et al. [14], a vapour compression A/C system was analyzed through two strategies of hybrid systems. First, an ice thermal energy storage (ITES) system is used in the a.m. hybrid system; and thereafter a phase change material (PCM) tank is used as a full storage system in order to shift the load from on-peak to off-peak mode. This A/C system is modelled and analyzed from an energy, economic and environmental perspective in both cases.
Oró et al. [15], This paper provides an overview of existing Spanish and European potential energy savings and CO2 mitigation by incorporating TES systems to cold storage and transportation systems. The total energy demand for cold applications in Spain and in Europe was calculated, and after that, the energy reduction and therefore CO2 emissions mitigation was determined to assume full implementation of the phase change material (PCM) TES system. The industrial sector shows the highest potential for benefit across all analyzed sectors. With regard to economic savings, Spain would be able to conserve between 2,309 and 11,674 GWh/year, with a potential yearly CO2 emission reduction of between 1195 to 5,902 [1000 tCO2/year]. Liu et al. [16] presented an innovative refrigeration system incorporating a phase change material (PCM) proposed to maintain refrigerated trucks at desired thermal conditions. In addition, the system consumes less energy and produces much lower local greenhouse gas (GHG) emissions.
The objective of this research is to merge studies that consider supplying the air-cooled chiller from the PV-system [9-12] with a thermal storage tank used the air-cooled chiller [13-16]. The combination of the two approaches is evaluated for application in the city of Hebron from three standpoints, namely energy consumption, economic feasibility and environmental impact.
2. Methodology
The total heat required for removal from the refrigerated space in order to bring it to the desired temperature and maintain it with refrigeration equipment is known as cooling load. The purpose of load estimation is to determine the size of refrigeration equipment required to maintain the internal design conditions during periods of maximum exterior temperatures. The cooling load is seldom effected by any one source of heat. Rather, it is an accumulation of heat that usually evolves from several different sources, some of which are more common sources of heat that impact the load on the refrigeration equipment, making equipment walls heat gain, the product heat gain, infiltration heat gain, packing heat gain, defrosting heater heat gain and fan motor heat gain [17]. In this study, only the wall heat gain, product heat gain, and infiltration heat gain are estimated. Other cooling load sources such as the fan motor, door lamp, and other components are considered to be very small loads, and are covered by using a factor of safety of 15%, which is added to the total cooling load. The total annual cooling loads are modelled and simulated using TRNSYS simulation software.
2.1. Thermal and Electrical Load Simulation
TRANSYS is a transient system simulation program. The software includes a large library of built-in components, often validated by experimental data [18-20]. TRNSYS consists of suitable programs. In this study, only two of these programs have been deployed which are TRNSYS simulation studio and Multi-zone building (TRNBuild) [21]. TYPE56 (Multi-zone building model) in TRNSYS is selected to simulate the heat conduction, convection and infiltration through surfaces of the one-meter cubic refrigeration chamber cavity, in order to use this type of refridgeration system in two separate processing program. The first process, the TRNBuild program reads in and processes a file containing the chamber description and generates two files. The second process occurrs in the TRNStudio program, the two generated files will be used by the Type 56 component during a TRNSYS simulation. The TRNSYS mathematical model calculations are affected by outdoor climatic conditions, indoor design conditions and the refrigeration chamber envelop structure. The heat balance method is used by TRNSYS as a base for all calculations. For conductive heat gain at the surface on each wall, TRNSYS use Transfer Function Method (TFM) as a simplification of the arduous heat balance method [22, 23].
 where:
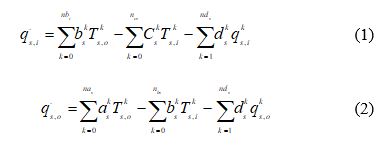
qs: Conduction heat flux throw the wall [kJ/h]
as, bs, cs, and ds: z-transforms of the surface temperature and heat flux determined by the z-transfer function routines of literature [24].
k: refers to the term in the time series, and it specified by the user within the TRNBUILD description.
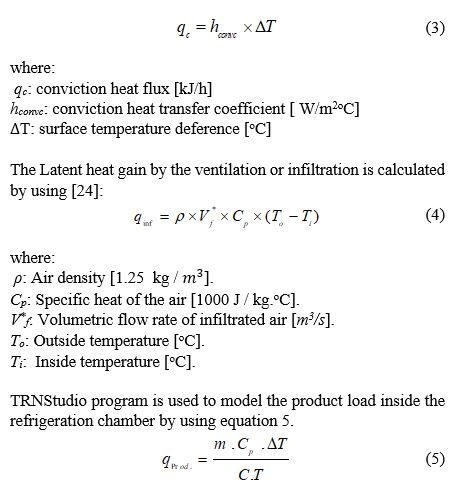
The heat gain by convection is calculated the following equation [24]:
where:
qc: conviction heat flux [kJ/h]
hconvc: conviction heat transfer coefficient [ W/m2oC]
T: surface temperature deference [oC]
The Latent heat gain by the ventilation or infiltration is calculated by using [24]:
 where:
qProd: Cooling product load in [kW].
m: Mass of the product in [ kg ]. (100 kg of water used in this study)
Cp: Specific heat of the product in [kJ/kg. oC]. (CP for water equal to 4.18 kJ/kgK)
ΔT: Temperature deference for the product [oC].
C.T: Cooling time [sec].
The total annual load of the refrigeration chamber is the summation of the load from the wall from TRNBuild program using type 56 and the product load using the equation type in the TRNStudio program. Figure 1 shows the load from the wall obtained from the TRNbuild program, the product load obtained from TRNStudio program and the total annual cooling load for the refrigeration chamber.
In this study, a half refrigeration ton (1.75 kW) air-cooled chiller selected for covering the cooling load demand. This chiller produced by ChillX company with the model (CXF050DRS) [25]. The chiller used ethylene glycol-water mixture in order to decrease the mixture freezing point under -10 oC, when the glycol percentage equal to 40% (by the volume) in the water mixture the freezing point temperature equal to -23.8 and the specific heat for the mixture at this point equal to 3.4 kJ/kg K [26]. Type 655 used to model a vapour compression air cooled chiller. This type requires input parameters, specifically the inlet fluid (water ethylene glycol) temperature, inlet fluid flow rate, setpoint temperature, ambient temperature, and fluid specific heat in order to calculate the annual thermal cooling load demand. Inlet fluid temperature is taken zero oC, inlet fluid flow rate calculated using equation 6, setpoint temperature is taken -5 oC, ambient temperature taken from the weather data file for Hebron city and the specific heat of the fluid equal to 3.4 kJ/kgK.
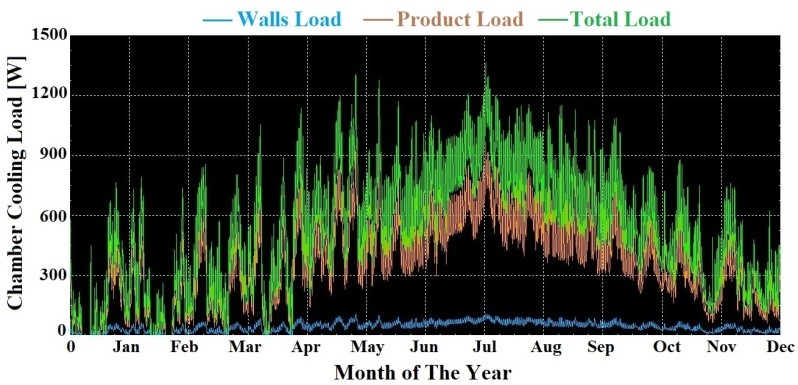 Figure.1. Walls load, product load and total annual cooling load for the refrigeration chamber.
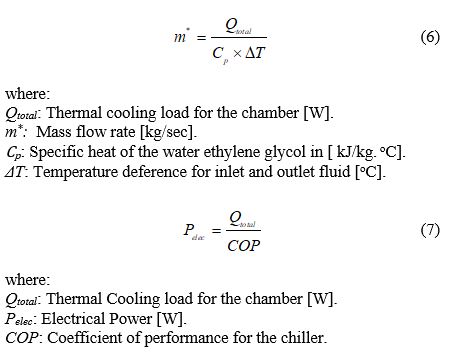
In order to calculate the total electrical power required to cover the total thermal cooling load, type 655 requires sample data for the COP of the utilized chiller. This data is entered into the simulation model (type655) using the text file from the selected chiller data sheet [27]. Type655 then calculates the electrical power using equation 7.
Figure 2 illustrates the total thermal power for the refrigeration chamber, the total electrical power needed for the chiller in order to cover the thermal power and the COP values. As shown in figure 2 the maximum electrical power value equal to 835 W in July, where the thermal power reaches its maximum value. The total annual electrical energy is calculated by integrating the electrical power profile (red profile) this value equal to 2,107 kWh/year.
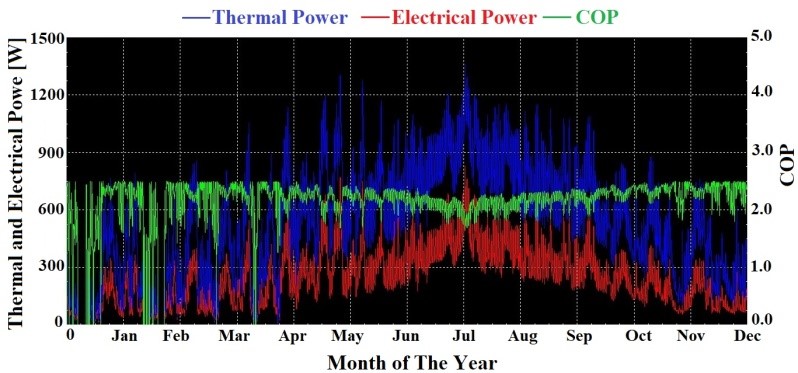 Figure.2. Chiller thermal power, electrical power, and chiller COP values.
2.2. System Load Coverage Scenarios
In order to operate the air-cooled chiller that used to cover the total annual cooling load of the refrigeration chamber, two scenarios are used to achieve this goal. In the first scenario, only PV system used to operate the air-cooled chiller during on-peak periods, in this case, the system contains PV modules, on grid inverter and air-cooled chiller as shown in figure 3.
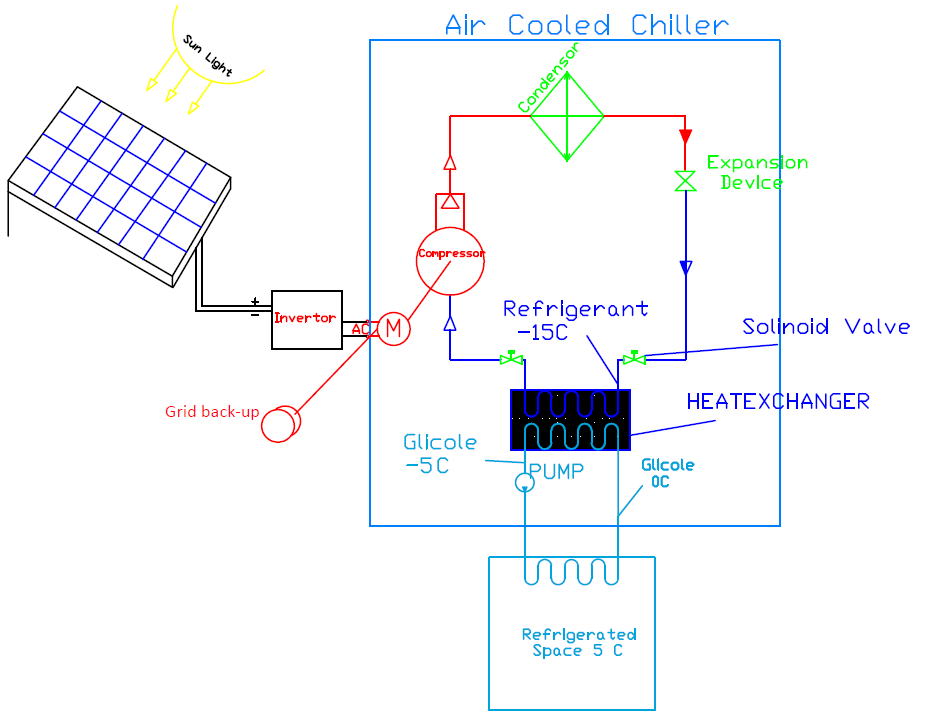 Figure.3. System components in the first scenario.
Four Q CELLS (325 Wp) solar PV modules are connected in series which converts solar radiation into electric power as direct current (DC). The 2kW EVERSOL inverter with 97% efficiency converts DC into alternating current (AC) which is needed to drive the chiller compressor. The chiller converts the AC power to the required thermal cooling power. The air-cooled chiller is supplied as a back-up with an electric AC power from the grid, when there is not enough DC power from the PV-array, especially at night, in the evening and morning times of the day when there is not enough solar radiation to drive the chiller. Type 194b (PV-inverter) is used to model the PV array and the inverter from the two scenarios in this study, the model is based on the calculation method presented by De Soto et al. [28]. Type 194b requires many input parameters from Hebron, specifically data files such as the total radiation on tilt angle, beam radiation, sky diffuse radiation, ground reflected diffuse radiation, the slope of the surface, wind speed and ambient temperature. The model of the electrical characteristics from the PV module data sheet, such as short circuit current and open circuit voltage at Standard Test Condition (STC), module voltage and current at the maximum power point (MPPT), temperature coefficient at the short circuit current, as well as the open circuit voltage, the number of cells in series, the number of module in series, the number of module in parallel, the normal operating conditions test (NOCT) and the module area [29]. Also, the inverter parameters efficiency and power are used in type 194b. By running the simulation program for the first scenario, the output electrical power obtained from the PV array along the year shown in figure 4.
 Figure.4. Annual electrical power obtained from the PV array.
The obtained electrical power values moved to excel sheet file in order to compare between the chiller power and the power produced by the array. Figure 5 to figure 8 illustrate the weekly distribution of electrical powers of the system in winter, spring, summer and in autumn for the chiller and the PV array.
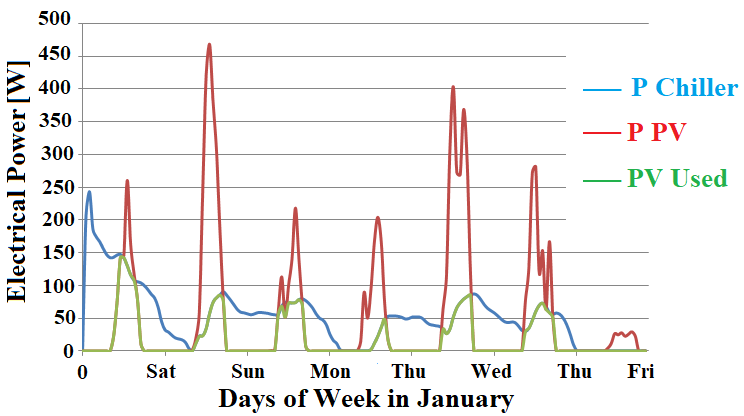 Figure.5. First scenario electrical powers in a winter week.
 Figure.6. First scenario electrical powers in a spring week.
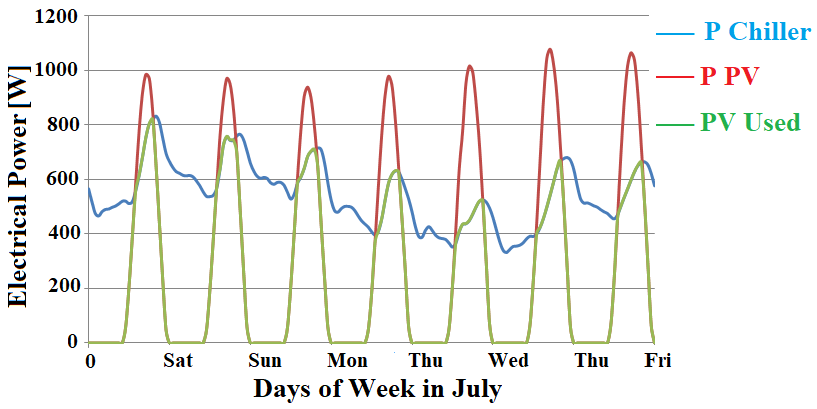 Figure.7. First scenario electrical powers in a summer week.
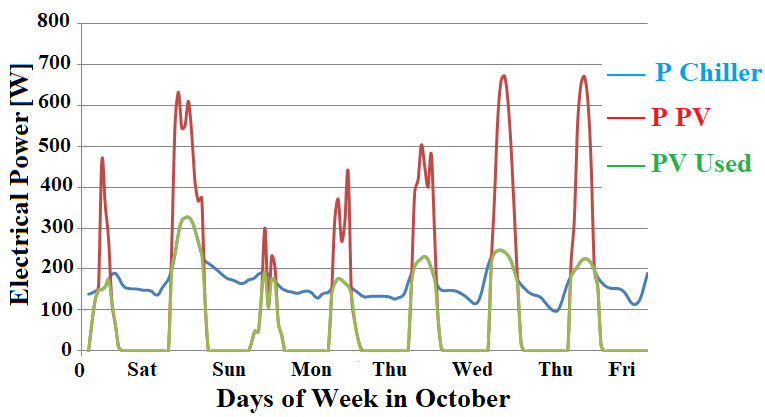 Figure.8. First scenario electrical powers in an autumn week.
The power that direct used from PV array in order to run the chiller in the on-peak hours is represented in figure 9 in the blue profile, this profile integrated using excel file to calculate the total annual power that direct used from the PV array, which equals to 950.5 kWh/year, this value represents 45% of the total annual power (2107 kWh/year) that needed to run the chiller along the year as illustrated in figure 9.
 Figure.9. Total annual power for the chiller and total annual power direct used from PV.

Figure.10. Monthly distribution for the electrical power consumption by the chiller and production by the PV system.
In this scenario the excess power from PV array is supplied to the grid, getting an equal value for it during night hours – in case of electricity consumption for the chiller is greater than the PV system production in one month – based on Power Authority laws in Palestine, this value equals to 752 kWh/year which represents 36% of the total annual power needed. Based on the first scenario results, 81% of the total annual electrical power required to run the chiller was generated. Figure 10 depicts the electrical power consumed by the chiller and the power produced by the PV-system, the blue profile represents the total electrical power needed to run the chiller, the purple profile represents the total electrical power produced by the PV-system, the red profile represents the electrical power direct used from the PV array at on-peak periods and the green profile represent electrical power that transferred to the grid and used at the off-peak periods. In the second scenario PV system used in order to run the air-cooled chiller during on-peak periods, also the thermal storage tank used in order to shift the excess power from on-peak periods to off-peak periods, this case contains the same components of the system in the previous scenario, in addition to the thermal storage tank as shown in figure 11. Figure.10. Monthly distribution for the electrical power consumption by the chiller and production by the PV system.
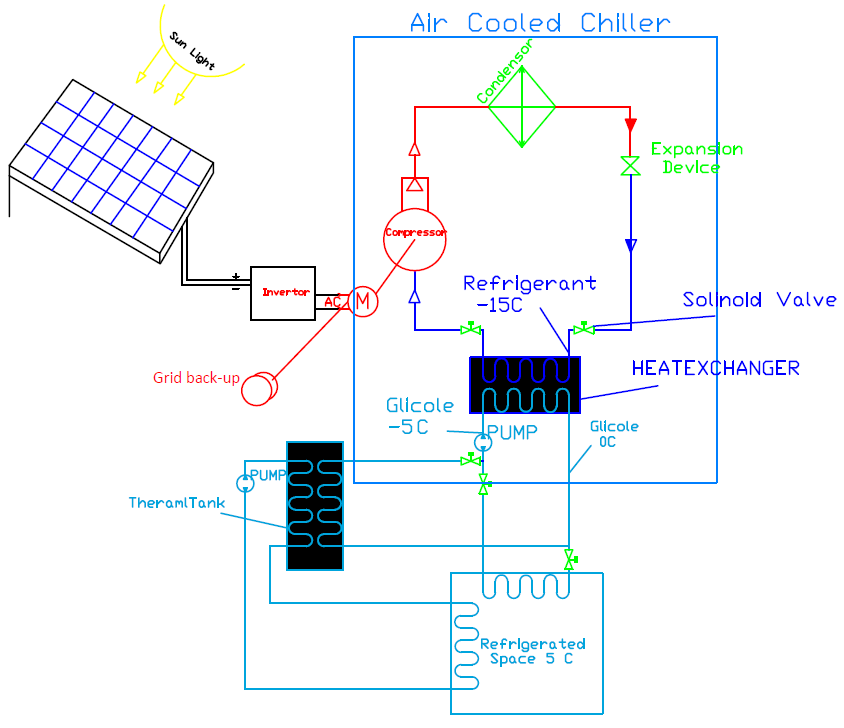 Figure.11. System components in the second scenario.
The working fluid used in the storage system is the same fluid that used for the chiller, specifically a glycol-water mixture ( 40% glycol ) with 3.4 kJ/kgK specific heat and 1110 kg/m3 density [24]. The volume of the thermal storage tank is designed according to the maximum excess of thermal power produced by the PV in a day, this is equal to 8000 Wh/day in June. By using equation 8, the tank volume equals 1.5 m3 (1500 L).

The selected tank is (HF1500) produced by Reflex, a Germany company [30]. The heat loss of this tank is equal to 5.1 kWh/24h (212 Wh) in the worst case of heat loss.
In this scenario the excess electrical power produced by the PV array in the first scenario used to run the chiller in TRANStudio, then chiller produced thermal power that stores in the thermal storage tank. The storage tank supplies this power to the refrigeration chamber during the night hours. The output thermal load from the thermal tank depending on its heat losses which equal 212 Wh, the output thermal load calculated using excel sheet file. Figure 12 shows the thermal tank input and output thermal power. The thermal losses in storage tank equal to 310.6 kWh/year.
 Figure.12. Thermal tank input and output power.
Figure 13 to Figure 16 illustrates the weekly energy distribution during the winter, spring, summer and autumn for the total thermal power produced by the PV array, thermal power direct used from the PV array and thermal power used from the tank in order to cover the chiller thermal load.
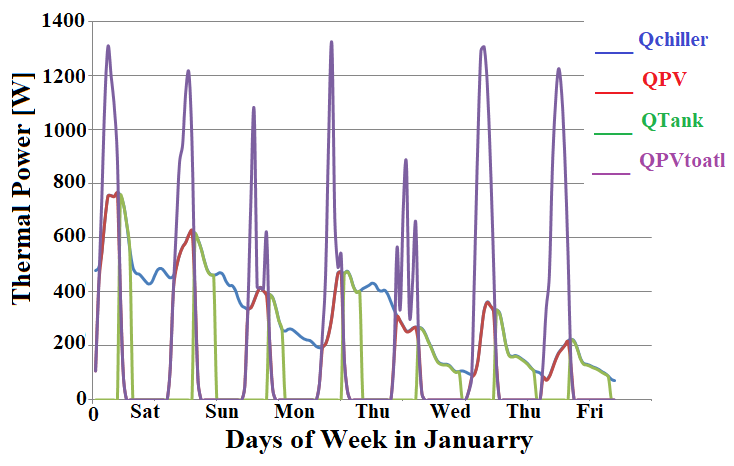 Figure.13. Second scenario thermal powers in winter week.
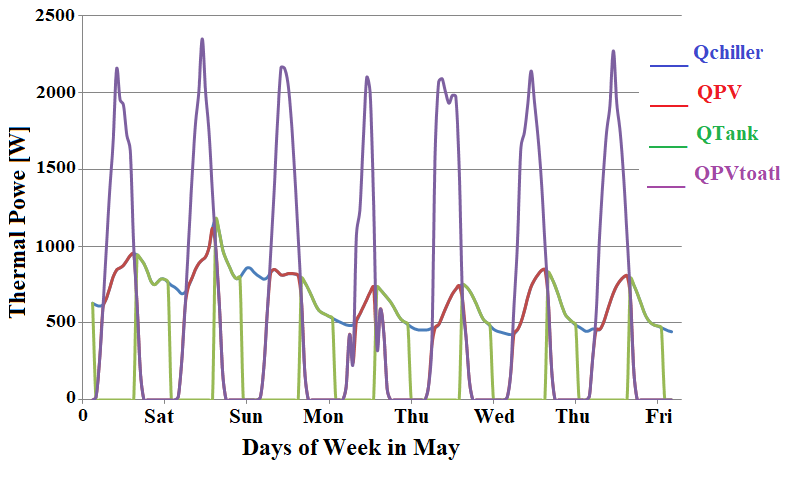 Figure.14. Second scenario of thermal energy production during a spring week.
 Figure.15. Second scenario thermal powers in summer week.
 Figure.16. Second scenario thermal powers in the autumn week.
As shown in figures 6.13 to 6.16, the purple profile represents the total thermal power produced by the PV, the red profile represents the thermal power direct used from the PV array at on-peak periods, the green profile represents thermal power obtained from storage tank at off-peak periods and the blue profile represents the chiller thermal power. In winter, 70% of the chiller load was covered, 38% direct from the PV array and 32% from the storage tank. In spring, 89% of the chiller load was covered, 49% direct from PV array and 40% from the storage tank. In summer 59% of the chiller load was covered, 42% direct from PV array and 17% from the storage tank. Finally, during the autumn, 74% of the chiller load was covered, 40% direct from PV array and 34% from the storage tank. In this scenario, the excess power from PV array is moved to the thermal storage tank in order to use it at night hours, as shown in figure17 the total needed load expressed using blue profile, and the total thermal power that covered using PV and storage tank expressed in a red profile. The red profile integrated using excel file to calculate the total annual thermal power that direct used from the PV array and storage tank, which equal to 3,474 kWh/year, this value represent 75.6% (45% PV and 30.6% storage tank) of the total annual thermal power (4,595.4 kWh/year) that needed to run the chiller along the year as illustrated in figure 17.
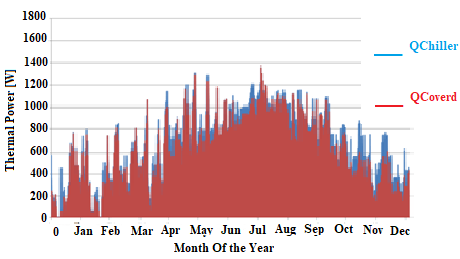 Figure.17. Total annual thermal power for the chiller and total annual thermal power covered by the PV and storage tank.
According to the second scenario results’, the value of the electrical power that reduced in this scenario equal to 1,593 kWh/year, this power obtained by using PV array and storage tank which represent 75.6% of the total electrical power needed to run the chiller (2,107 kWh/year).
2.3. Economic Evaluation
The economic feasibility of investments in PV systems with thermal storage tanks have been conducted in this study for the two scenarios. The selected indicators for this kind of assessment are the payback period (PBP) and total profit generated. On the other hand, the environmental advantage in comparison to traditional sources of energy is evaluated through the reduction of carbon dioxide emissions. The project life period is taken as 25 years according to the PV module performance guarantee. Payback periods describe the length of time required to recover the initial cost of system implementation, while the total profit is the number of dollars that decreased after the payback period, it can be calculated by knowing the annual revenue in the years after the payback period. This values can be estimated by calculating the total capital cost and the total annual cost for the two scenarios using the following equations [31-34].
EAnnual equal 1,702.5 kWh/year for the first scenario (81% of the chiller electrical energy) and 1,593 kWh/year for the second scenario (75.6% of the chiller electrical energy). The initial cost contains the total cost that needed to operate the system at the beginning of the project life period such as PV modules cost (205 $/module), inverter cost (US$ 752), storage tank cost (US$ 700) and system installation cost. Installation cost found the range from US$ 0.064-US$ 0.1/Wp [31] (in this study taken 0.1), so it is equal US$ 130 for the first and second scenario (4 modules x 325 Wp) Table 1 shows the required initial cost of both scenarios.
 Table 1: Scenario initial costs
| Initial Cost | First Scenario | Second Scenario |
| Modules Cost($) | 820 | 820 |
| Inverter Cost ($) | 752 | 752 |
| Storage Tank Cost ($) | 0 | 700 |
| Installation Cost ($) | 130 | 130 |
| Total initial Cost ($) | 1,702 | 2,402 |
Annual cost contains the operation and maintenance cost which represent the annual money that needed to operate and maintain the suggested system (including PVs, inverter and storage tank), according to the operating cost 1.5% [36] added to the annual cost that calculated using equation 11, and US$ 0.04/Wp [37] for system maintenance (US$ 52 for the first and second scenarios). Then the total annual cost calculated using equation 12. the payback period and total profit for the two scenarios as shown in table 2.
Table 2: Economic calculations for the study scenarios
| Economical Calculations | First Scenario | Second Scenario |
| E annual (kWh/year) | 1,702.5 | 1,593 |
| Initial Cost ($) | 1,702 | 2,402 |
| CRF / year | 0.071 | 0.071 |
| Annual Cost ($) | 120.8 | 170.5 |
| Operating Cost ($) | 1.8 | 2.6 |
| Maintenance Cost ($) | 52 | 52 |
| Total Annual Cost ($) | 175 | 225 |
| Total Capital Cost ($) | 2,460 | 3,170 |
| Total Annual Saving ($) | 272 | 255 |
| Payback Period / year | 9 | 12.4 |
| Total Profit ($) | 4,350 | 3,202 |
As illustrated in table 2 the payback periods equal to 9 and 12.4 for the first and second scenarios respectively. Furthermore, the total profit values for the two scenarios equal to US$ 4,350 and US$ 3,202 respectively. According to the economic assessment for the two scenarios, the most economical scenario in this study is the first one, an on-grid PV system without a thermal storage tank.
2.4. Environmental Evaluation
Using renewable energy sources allows for the reduction of environmental pollution. In order to evaluate the environmental advantages in this study, a comparison between CO2 emissions released by the study scenarios and the ones released by using grid electricity produced by fossil fuels. The quantified emissions released by a PV system equal to 81 gCO2/kWh, of which 93.7% are caused by PV panel manufacture [38]. On the other hand, fossil sources emissions were quantified in 771 gCO2/kWh [39]. In this research, running the chiller using grid electricity only produced 1,624.5 kgCO2/year. The first scenario used 1702.5 kWh/year from the PV-system and 404.5 kWh/year from grid electricity, so the CO2 emissions equal to 450 kgCO2/year. The second scenario used 1,593 kWh/year from the PV system and 514 kWh/year from the grid, so the CO2 emissions equal to 525.3 kg CO2/year.
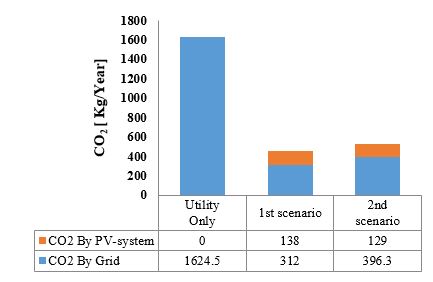 Figure.18. The amount of CO2 emissions for the system scenarios.
Based on the CO2 emissions for the system scenarios shown in figure 18. The CO2 emissions reduced by 72% for the first scenario compared with supplying the chiller from the grid only. In the same manner, the amount of CO2 reduction for the second scenario equals 68%. According to these results, the first scenario has the lowest impact on the environment.
3. Conclusions
This investigation of the utilization of PV-systems with thermal storage tanks to power air-cooled chillers has yielded very effective and efficient results in reducing electrical consumption from this utility, as well as an alternative energy source which provides a reduction in CO2 emissions and enhances the payback period and the system profit. Powering the chiller with the grid and PV-system saves 81% of the electrical power, compared with supplying it from the grid only. This result is a payback period of 9 years and a profit of US$ 4,350 generated by the system, in addition to reducing CO2 emissions by 72%. By adopting thermal storage tank of 1.5 m3 with the utility and PV-system the electrical consumption decreased by 75.6% and CO2 emissions by 68%, also the payback period becomes 12.4 years, and the total profit equal to US$ 3,202. According to the above listed economic and environmental examinations, the on-grid system is the most economical scenario. On the other hand, the first scenario has the lowest impact on the environment. The main findings of this study may be applied to larger systems, as well as systems in remote areas, to reduce electricity cost and reduce the amount of CO2 emissions. Furthermore, the usage of thermal storage units enable for a reduction in scheduled maintenance required by PV-systems with electrical batteries.
- Vasarevicius, D., & Martavicius, R. (2011). Solar irradiance model for solar electric panels and solar thermal collectors in Lithuania/I lietuvoje naudojamas sales baterijas ir kolektorius patenkancio sales energies auto models. Elektronika IR Electrotechnical, (2 (108)), 3-7.
- Al-Maghalseh, M. M. (2018). The Impacts of Distribution Generators Size and Location on Power Efficiency and Voltage Profile in Radial LV Networks. Advances in Science, Technology and Engineering Systems Journal, 3, 276-283.
- Al-Maghalseh, M. M. (2018). Evaluating the Reliability worth Indices of Electrical Medium Voltage Network: Case Study. Procedia Computer Science, 130, 744-752.
- Al-Maghalseh, M., Odeh, S., & Saleh, A. (2017, October). Optimal sizing and allocation of DGs for real power loss reduction and voltage profile improvement in radial LV networks. In 2017 14th International Conference on Smart Cities: Improving Quality of Life Using ICT & IoT (HONET-ICT)(pp. 21-25). IEEE.
- Al-Maghalseh, M. M., Abutemeha, A. K., & Iyadiyyeh, M. M. (2017). Modelling a hybrid system for electrical generation and wastewater treatment using photovoltaic and fuel cells. Desalination and Water Treatment, 100, 250-257.
- Al-Maghalseh, M., & Mahkamov, K. (2018). Methods of heat transfer intensification in PCM thermal storage systems. Renewable and Sustainable Energy Reviews, 92, 62-94.
- Al-Maghalseh, M. M. (2017). Investigate the Natural Convection Heat Transfer in A PCM Thermal Storage System Using ANSYS/FLUENT. Jordan Journal of Mechanical & Industrial Engineering, 11(4).
- Al-Maghalseh, M. (2014). Compact solar thermal energy storage systems using phase change materials (Doctoral dissertation, Northumbria University).
- Dincer, I. (2002). On thermal energy storage systems and applications in buildings. Energy and Buildings, 34(4), 377-388.
- Deshmukh, S. D., & Kalbande, S. R. (2015). Performance evaluation of photovoltaic system designed for DC refrigerator. Int J Sci Res, 4(2), 18-23.
- Kalbande, S. R., & Deshmukh, S. (2015). Photovoltaic Based Vapour Compression Refrigeration System for Vaccine Preservation.
- Fatehmulla, A., Al-Shammari, A. S., Al-Dhafiri, A. M., & Al-Bassam, A. A. (2011, April). Design of energy efficient low power PV refrigeration system. In 2011 Saudi International Electronics, Communications and Photonics Conference (SIECPC) (pp. 1-5). IEEE.
- Rismanchi, B., Saidur, R., Masjuki, H. H., & Mahlia, T. M. I. (2012). Energetic, economic and environmental benefits of utilizing the ice thermal storage systems for office building applications. Energy and Buildings, 50, 347-354.
- Rahdar, M. H., Emamzadeh, A., & Ataei, A. (2016). A comparative study on PCM and ice thermal energy storage tank for air-conditioning systems in office buildings. Applied Thermal Engineering, 96, 391-399.
- Oró, E., Miró, L., Farid, M. M., Martin, V., & Cabeza, L. F. (2014). Energy management and CO2 mitigation using phase change materials (PCM) for thermal energy storage (TES) in cold storage and transport. International Journal of Refrigeration, 42, 26-35.
- Liu, M., Saman, W., & Bruno, F. (2012). Development of a novel refrigeration system for refrigerated trucks incorporating phase change material. Applied Energy, 92, 336-342.
- Dossat Roy, J. (1961). Principles of refrigeration. John Wiley And Sons Inc; New York.
- Calise, F. (2012). High-temperature solar heating and cooling systems for different Mediterranean climates: Dynamic simulation and economic assessment. Applied Thermal Engineering, 32, 108-124.
- S.A. Klein, et al. (2006). TRNSYS. A Transient System Simulation Program, Solar Energy Laboratory, University of Wisconsin, Madison.
- Energy modelling and building physics resource base, Software, TRNSYS, University of Cambridge.
- TRNSYS 16.(2009). A TRaNsient System Simulation program – Volume 1 Getting Started. Solar Energy Laboratory, University of Wisconsin-Madison.
- Bhaskoro, P. T., & Gilani, S. I. U. H. (2011). Transient Cooling Load Characteristic of an Academic Building, using TRNSYS. Applied Sci, 11, 1777-1783.
- TRNSYS Group. (2003). TRNSYS16 manual, < http://www.aiguasol.coop/files/file46-3.pdf>.
- Mitalas, G. P., & Arseneault, J. G. (1970). Fortran IV program to calculate z-transfer functions for the calculation of transient heat transfer through walls and roofs. National Research Council Canada, Division of Building Research.
- Jannot, Y., & Degiovanni, A. (2018). Thermal properties measurement of materials. John Wiley & Sons.
- ChillX company, home page 1/4-1 Ton Compact Low Temp. Chiller, last visited website page 12/2018, <http://chillxchillers.com /compact-chillers/chillx-025-1-ton-compact-low-temp-chillers?sku= CXF025DRS1>.
- The Engineering ToolBox, Freezing Point of Ethylene Glycol based Water Solutions, last visited website page 12/2018, <https://www.engineeringtoolbox.com/ethylene-glycol-d_146.html>.
- De Soto, W., Klein, S. A., & Beckman, W. A. (2006). Improvement and validation of a model for photovoltaic array performance. Solar Energy, 80(1), 78-88.
- Al-Maghalseh, M. (2018). Experimental Study to Investigate the Effect of Dust, Wind Speed and Temperature on the PV Module Performance. Jordan Journal of Mechanical & Industrial Engineering, 12(2).
- The reflex company, homepage, HF Storage Tank, last visited website page 12/2018, <www.reflex.de>.
- Al-Maghalseh, M. M., & Maharmeh, E. M. (2016). Economic and Technical Analysis of Distributed Generation Connection: A Wind Farm Case Study. Procedia Computer Science, 83, 790-798.
- Al-Maghalseh, M., & Saleh, W. (2017, October). Design and cost analysis of biogas based power plant: Jenin perspective. In 2017 14th International Conference on Smart Cities: Improving Quality of Life Using ICT & IoT (HONET-ICT) (pp. 31-35). IEEE.
- Al-Maghalseh, M . (2018). Techno-economic assessment of biogas energy from animal wastes in central areas of Palestine: Bethlehem perspective. International Journal of Energy Applications and Technologies, 5 (3), 119-126. DOI: 10.31593/ijeat.444089.
- Al-Maghalseh, M . (2019). Generation unit sizing, economic analysis of grid-connected and standalone PV power plant. International Journal of Energy Applications and Technologies, 6 (1), 1-7. DOI: 10.31593/ijeat.444091.
- Hebron Electric Power Company, website page, Tariff cost, last visited website page 12/2018, <http://hepco-pal.com/ar/services/news2>.
- ERSS, X., PTP, C. E., C&R, C. E., & Engineer’s Building, D. (2017). Central e
Electricity Regulatory Commission New Delhi. - Bolinger, M., & Weaver, S. (2014). Utility-scale solar 2013: An empirical analysis of project cost, performance, and pricing trends in the United States.
- Cucchiella, F., & D’Adamo, I. (2012). Estimation of the energetic and environmental impacts of roof-mounted building-integrated photovoltaic systems. Renewable and Sustainable Energy Reviews, 16(7), 5245-5259.
- Cucchiella, F., D’Adamo, I., & Gastaldi, M. (2015). Financial analysis for investment and policy decisions in the renewable energy sector. Clean Technologies and Environmental Policy, 17(4), 887-904.