Sentiment Analysis on Twitter for Predicting Stock Exchange Movement

Adv. Sci. Technol. Eng. Syst. J. 4(3), 244–250 (2019);
 DOI: 10.25046/aj040332
This paper is proposed to build a model by applying two methods, namely support vector machine and nonnegative matrix factorization in the process of predicting stock market movement using twitter and historical data. The stock exchange is based on the LQ 45 stock with period from August 2018 – January 2019. The features consist of closing price, volume, percentage of topics and sentiment. The price and volume are taken from yahoo finance data, while topics and sentiment are taken from comments of each stock market in LQ45. NMF method is used to get the topic percentage feature in the tweet data, while the analysis sentiment value is obtained using SVM. The evaluation results obtained by getting the level of accuracy using confusion matrix. The accuracy value of stock movement predictions in this study is 60.16%.
1. Introduction
Many companies use twitter to analyze products and improve relationships also trust between consumers and companies [1] One of the using twitter in the economic field is predicting economic movements and sales indicators for a product [2]. One prediction in the field of economics is predicting stock prices. Stock price prediction is an interesting topic for business people and researchers. Stock is one of the capital market products which is one of the investments for the long term [3]. Stock price predictions involve a complex process because of the noise and the very irregular conditions. Stock market prediction is an important issue for transaction participants in assisting in decision making.
Sentiment analysis is related to the increase and decrease in stock prices [4]. Several studies compared several methods used in sentiment analysis. From previous studies, methods that are commonly used in the process of sentiment analysis are naïve bayes classifier and support vector machine. The comparison results of that techniques, the SVM method is obtained with the highest level of accuracy. In the case study of twitter sentiment analysis in the FIFA 2013, the SVM method provides a higher level of accuracy compared to the naïve bayer classifier [5].
Many previous studies focused on classification methods such as support vector machine (SVM), naïve bayes, and maximum entry to classify tweets. Coletta, Hruschka, Felix, & Hruschka [6], combine SVM classifier and C3E-SL clustering technique and produce a better classification than just using the SVM method. The process of tweeting clustering is generally done by k-means and also non-negative matrix factorization (NMF). When both results are compared they have similar results, but NMF can run faster and the results are easier to interpret [6].
Research that discusses about stock market predictions on Indonesia Stock Exchange (IDX) with sentiment analysis on Twitter has not been done much. In fact, market sentiment analysis is one of the benchmarks of stock price movements. Furthermore, there are not many sentiment analyzes using the support vector machine method as a predictive method and non-negative matrix factorization in the feature extraction process. Therefore, in this study, twitter sentiment analysis done for predicting stock price movements by combining support vector machine methods and non-negative matrix factorization methods.
The main objective of this research is to build a model by applying two methods, namely support vector machine and nonnegative matric factorization. For increasing the accuracy and performance of the sentiment analysis method on twitter for predicting stock prices on Indonesia Stock Exchange.
2. Related Work
Sentiment analysis is one of social media mining applications that can be used to find out sentiments. Niu, Yin, & Kong [8] research on the analysis of commitment to microblogging. In this study, they increase the ability of the Bayesian text classifier method to select word features, determine the weight and classification of commitment. One application of sentiment analysis is a prediction of stock price movements. Sentiment analysis is related to the increase and decrease in stock prices [4]. Rao & Srivastava [9], implemented the Naïve Bayes classifier in his research.
The sentiment analysis process can be done with tools such as OptionFinder that produce positive and negative, Google Profile of Mood States (GPOMS) that produce calm, alert, sure, vital, kind and happy. The results of these tools were analyzed using granger casuality and self-organizing fuzzy neural networks resulting in 86.7% accuracy in predicting increases and decreases of DJIA and MAPE reduction of more than 6% [2].
Jadhav & Wakode [1] make comparisons of sentiment classification techniques including SVM, NB, NBSVM, MNB, SentiStrengh + Twitter Sentiment, SEntiStrength and Twitter Sentiment. From the comparison result, SVM method is obtained the highest level of accuracy. The method that is widely used in sentiment analysis process is naïve bayes classifier and support vector machine. Sentiment analysis process in case study of FIFA 2013, the SVM method provides a higher level of accuracy compared to the naïve bayer classifier [5].
Many previous studies focused on classification methods such as support vector machine (SVM), naïve bayes, and maximum entopy to classify tweets. The combination of text clustering and text classifier increase the accuracy of tweets classifier. The combination of SVM classifier and C3E-SL clustering technique can correct tweets classification, compared by only using SVM method [7]. Zhu, Jing, & Yu [10] in their study stated that NMF has a good performance used in real-world data texts. Shahnaz, Berry, Pauca, & Plemmons [11], done reasearch for cluster documents using non-negative matrix factorization. Tweet clustering can be done by k-means and also non-negative matrix factorization (NMF), but NMF can run faster and the results are easier to interpret [6]. The research conducted by Nguyen, T. H., Shirai, K., & Julien Velcin, 2015 which analyze stock market movements using close price, volume, sentiment analysis and topics as features.
3. Method
Figure 1 is an overview of the research methods in this study.
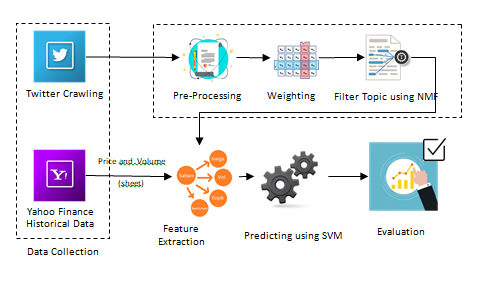 Figure 1: Research Method
3.1. Data Collection
The tweet used comes from verified account on Twitter. The list of companies in this study are companies that included in the LQ 45 period from August 2018 – January 2019, including Adhi Karya (Persero) Tbk., Adaro Energy Tbk., AKR Corporindo Tbk., Aneka Tambang (Persero) Tbk., Astra International Tbk. ,Bank Central Asia Tbk., Bank Negara Indonesia (Persero) Tbk., Bank Rakyat Indonesia (Persero) Tbk., Bank Tabungan Negara (Persero) Tbk., BPD Jawa Barat dan Banten Tbk., Sentul City Tbk, Bank Mandiri (Persero) Tbk., Barito Pasific Tbk., Bumi Serpong Damai Tbk., Elnusa Tbk., XL Axiata Tbk., Gudang Garam Tbk., H.M. Sampoerna Tbk., Indofood Sukses Makmur Tbk., Indika Energy Tbk, Indah Kiat Pulp & Paper Tbk., Indocement Tunggal Prakarsa Tbk., Indo Tambangraya Mehag Tbk., Jasa Marga (Persero) Tbk., Kalbe Farma Tbk., Lippo Karawaci Tbk., Matahari Department Store Tbk., Medco Energi Internasional Tbk., Media Nusantara Citra Tbk., Perusahaan Gas Negara (Persero) Tbk., Tambang Batu Bara Bukit Asam (Persero) Tbk., PP Properti Tbk., Surya Citra Media Tbk., Semen Indonesia (Persero) Tbk., Sri Rejeki Isman Tbk., Sawit Sumbermas Sarana Tbk., Telekomunkasi Indonesia (Persero) Tbk., Chandra Asri Petrochemical Tbk., United Tractors Tbk., Unilever Indonesia Tbk., Wijaya Karya (Persero) Tbk., Waskita Beton Precast Tbk., dan Waskita Karya (Persero) Tbk [8]. From 45 companies in the LQ45 list, only 15 companies have verified accounts, with 24 accounts. Table 1 is the list of stock code and twitter users.
Table 1: List of Stock Code and Twitter Users
| Stock Code | Twitter Username |
| BBCA | bankbca |
| HaloBCA | |
| BBNI | bni |
| BNICustomerCare | |
| BBRI | BANKBRI_ID |
| kontakBRI | |
| BBTN | BankBTNcoid |
| BMRI | bankmandiri |
| mandiricare | |
| EXCL | XLAxiata_Tbk |
| myXLCare | |
| myXL | |
| INDF | indofood |
| JSMR | PTJASAMARGA |
| OFFICIAL_JSMR | |
| KLBF | KALBEfamily |
| LPPF | GayaMatahari |
| PGAS | Gas_Negara |
| SCMA | IndosiarID |
| SCTV_ | |
| SMGR | semenku |
| TLKM | TelkomCare |
| TelkomIndonesia | |
| UNVR | UnileverIDN |
3.2. Pre-processing
The pre-processing process is performed to eliminate noise, and data normalization. Data must be processed to improve the performance of text mining process.
Example: @TelkomIndonesia Berkebun itu kegiatan yang mengasyikan lho Sobat! #TelkomEdu
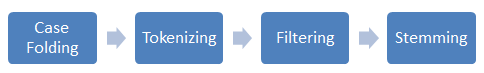 Figure 2: Pre-processing
- Case Folding
The first step is case folding. The initial stage is the cleansing process, then convert all character into a lower case.
Example :telkomIndonesia berkebun itu kegiatan yang mengasyikan lho sobat telkomedu
- Tokenizing
At this stage, the sequence of words in the tweet is cut, and form to pieces of words according to system requirements.
Example: telkomIndonesia | berkebun | itu | kegiatan | yang | mengasyikan | lho | sobat | telkomedu
- Filtering
Filtering / Stopwords is a process of removing characters, punctuation, and general words that have no meaning.
Example: berkebun | kegiatan | mengasyikan
- Stemming
Stemming process of reducing a word to its word stem that affixes to suffixes and prefixes or to the roots of words known as a lemma.
Example: kebun | giat | asik
3.3. Filter Topic Using NMF
Non-Negative Matrix Factorization (NMF) gives a non-negative matrix V to produce a non-matrix factor W and H as Eq. (1).

3.4. Feature Extraction
Feature extraction is important to get stock daily features. Data that used in this step are from Yahoo Finance and the results of the Twitter API. Nguyen, Shirai, & Julien Velcin [13], have compared the features used in the stock prediction process, namely Price, Topics and Sentiment analysis scores. In this study, researchers used volume as an additional feature in the stock prediction process. The features used in this study are in Table 2.
Table 2: List of Features
| Features | Desciption |
| Pct-2 | Close Price T-2 |
| Pct-1 | Close Price T-1 |
| Volt-2 | Volume T-2 |
| Volt-1 | Volume T-1 |
| PTt-2 | Topic percentage T-2 |
| PTt-1 | Topic percentage T-1 |
| Sent-2 | Sentiment score T-2 |
| Sent-1 | Sentiment score T-1 |
3.5. Predicting using SVM
The learning method for predicting stock movement is SVM. SVM tries to find the best line dividing the two classes, and then classifies the test documents based on which side of the line they appear. The features used in predicting stock movements are illustrated in table 3.
Table 3: Illustration of SVM Application Method
| Date | Pct-2 | Pct-1 | Volt-2 | Volt-1 | PTt-2 | PTt-1 | Sent-2 | Sent-1 | Y |
| 01072016 | 2000 | 2010 | 3000 | 4000 | 30 | 40 | 1 | -1 | 1 |
| … | |||||||||
| 31032017 | |||||||||
| 01042017 | |||||||||
| … |
In table 3 it is illustrated that, the prediction results on stock movements are Y. Where the value of Y is between [0, 1]. Every day, it only has 1 data in predicting stock market movements. Where the data is divided into two, 25% data test and 75% data train. The results of stock movements are divided into two classes, such as up and down.
3.6. Evaluation
The evaluation method that used in this study was confusion matrix. Confusion matrix is a method used to calculate accuracy in the concept of data mining [9]. The evaluation results with confusion matrix are the values of accuracy, precision and recall. Accuracy in classification is the percentage of data record provisions that are classified correctly after testing the classification results [10]. Precision or confidence is the proportion of cases predicted to rise which are also positively correct in the actual data. Recall or sensitivity is the proportion of actual positive cases that are correctly predicted positively [11] .
Table 4: Confusion Matrix Model
| Correct Classification | Classified as | ||
| Up | Down | ||
| Up | TP | FP | |
| Down | FN | TN | |
Eq. (4), Eq. (5), Eq. (6) and Eq.(7) are the formula for calculate Accuracy, Precision, Recall and Error Rate, respectively.
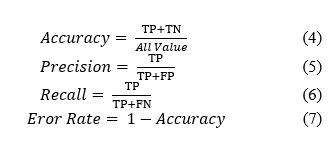 Table 5: Twitter Data Results
| Stock Code | Twitter Username | Number of tweets |
| BBCA | bankbca | 6224 |
| HaloBCA | 21718 | |
| BBNI | bni | 8848 |
| BNICustomerCare | 8675 | |
| BBRI | BANKBRI_ID | 6090 |
| kontakBRI | 10981 | |
| BBTN | BankBTNcoid | 435 |
| BMRI | bankmandiri | 14073 |
| mandiricare | 13424 | |
| EXCL | XLAxiata_Tbk | 1376 |
| myXLCare | 12587 | |
| myXL | 9510 | |
| INDF | indofood | 398 |
| JSMR | PTJASAMARGA | 25191 |
| OFFICIAL_JSMR | 1241 | |
| KLBF | KALBEfamily | 1733 |
| LPPF | GayaMatahari | 2416 |
| PGAS | Gas_Negara | 2982 |
| SCMA | IndosiarID | 19791 |
| SCTV_ | 11546 | |
| SMGR | semenku | 1122 |
| TLKM | TelkomCare | 29971 |
| TelkomIndonesia | 9327 | |
| UNVR | UnileverIDN | 862 |
| Total Tweets | 220521 | |
Table 6: Historical Data Result
| Stock Code | Number of days |
| BBCA | 174 |
| BBNI | 174 |
| BBRI | 174 |
| BBTN | 174 |
| BMRI | 174 |
| EXCL | 174 |
| INDF | 174 |
| JSMR | 174 |
| KLBF | 174 |
| LPPF | 174 |
| PGAS | 174 |
| SCMA | 174 |
| SMGR | 174 |
| TLKM | 174 |
| UNVR | 174 |
| Total | 2610 |
4. Data Analysis and Results
There are two data used in this study, such as stock price historical data from Yahoo Finance, and data tweets taken using NodeXL Pro. This study only processes data from 1 August 2018 to 1 April 2019. Table 5 is twitter data results.
Tabel 6 is historical data taken using Yahoo Finance from 1 August 2018 to 1 April 2019.
All tweets will go through preprocessing data tweet stage. This process is done to get data that has been clean / normalized. The steps taken in this process are divided into several steps including cleansing, case folding, tokenizing, stopwords and stemming. This step is done using the Python nltk library and Sastrawi.
4.1. Topic Extraction
At this stage, each tweet will be classified by using the sklearn library in python with Non-Negative Matrix Factorization (NMF) algorithm to get a daily topic. Before classification, each tweet through a weighting process using TfidfVectorizer. Tweets that are processed in this stage are tweets that have through preprocessing stage. Non-Negative Matrix Factorization (NMF) is used to find two non-negative matrices (W, H) whose results are close to the non-negative matrix V [12]. This factorization process used for dimension reduction, source separation or topic extraction. The first process in NMF is created a weight matrix (V) to produce a matrix W and H. Table 7 is preprocessed tweets that used for create matrix V.
Table 7: Preprocessed tweets
| Num. | Tweet |
| T1 | terima kasih |
| T2 | mohon tunggu konfirmasi laku telepon ya |
| T3 | transaksi finansial periode libur lebaran |
| T4 | khawatir cabang bca daerah buka layan operasional batas libur idul fitri |
| T5 | lapor proses kait mohon tunggu proses jalan ya |
| T6 | hai langsung terima transfer rekening bca rekening bank ya h 1 ya |
| T7 | selamat malam aplikasi saku mudah download aplikasi google play app store ya informasi lengkap klik link |
| T8 | sih hati suci mari maaf fitri selamat raya idul fitri 1439 h |
| T9 | hai top saldo flazz saku transaksi saku saku plus kena biaya informasi lengkap putar saku klik link ya terima kasih |
The first process in NMF is to create a weight matrix (V) to produce a matrix W and H. Table 8 is matrix V is the result of a weighting process with TfidfVectorizer.
Table 8: Matrix V
| Tweet
Term |
T1 | T2 | T3 | T4 | T5 | T6 | T7 | T8 |
| 1439 | 0 | 0 | 0 | 0 | 0 | 0 | 0.297 | 0. |
| aplikasi | 0 | 0 | 0 | 0 | 0 | 0.505 | 0 | 0. |
| app | 0 | 0 | 0 | 0 | 0 | 0.252 | 0 | 0. |
| bank | 0 | 0 | 0 | 0 | 0.312 | 0 | 0 | 0. |
| batas | 0 | 0 | 0.318 | 0 | 0 | 0 | 0 | 0. |
| bca | 0 | 0 | 0.27 | 0 | 0.265 | 0 | 0 | 0. |
| biaya | 0 | 0 | 0 | 0 | 0 | 0 | 0 | 0.20310526 |
| buka | 0 | 0 | 0.318 | 0 | 0 | 0 | 0 | 0. |
| cabang | 0 | 0 | 0.318 | 0 | 0 | 0 | 0 | 0. |
| daerah | 0 | 0 | 0.318 | 0 | 0 | 0 | 0 | 0. |
| download | 0 | 0 | 0 | 0 | 0 | 0.252 | 0 | 0. |
| fitri | 0 | 0 | 0.27 | 0 | 0 | 0 | 0.505 | 0. |
| flazz | 0 | 0 | 0 | 0 | 0 | 0 | 0 | 0.20310526 |
| 0 | 0 | 0 | 0 | 0 | 0.252 | 0 | 0. | |
| hai | 0 | 0 | 0 | 0 | 0.265 | 0 | 0 | 0.17265803 |
| hati | 0 | 0 | 0 | 0 | 0 | 0 | 0.297 | 0. |
| idul | 0 | 0 | 0.27 | 0 | 0 | 0 | 0.252 | 0. |
| informasi | 0 | 0 | 0 | 0 | 0 | 0.215 | 0 | 0.17265803 |
| jalan | 0 | 0 | 0 | 0.337 | 0 | 0 | 0 | 0. |
| kait | 0 | 0 | 0 | 0.337 | 0 | 0 | 0 | 0. |
| kasih | 0.747 | 0 | 0 | 0 | 0 | 0 | 0 | 0.15105537 |
| kena | 0 | 0 | 0 | 0 | 0 | 0 | 0 | 0.20310526 |
| khawatir | 0 | 0 | 0.318 | 0 | 0 | 0 | 0 | 0. |
| klik | 0 | 0 | 0 | 0 | 0 | 0.215 | 0 | 0.17265803 |
| konfirmasi | 0 | 0.457 | 0 | 0 | 0 | 0 | 0 | 0. |
| laku | 0 | 0.457 | 0 | 0 | 0 | 0 | 0 | 0. |
| langsung | 0 | 0 | 0 | 0 | 0.312 | 0 | 0 | 0. |
| lapor | 0 | 0 | 0 | 0.337 | 0 | 0 | 0 | 0. |
| layan | 0 | 0 | 0.318 | 0 | 0 | 0 | 0 | 0. |
| lengkap | 0 | 0 | 0 | 0 | 0 | 0.215 | 0 | 0.17265803 |
| libur | 0 | 0 | 0.27 | 0 | 0 | 0 | 0 | 0. |
| link | 0 | 0 | 0 | 0 | 0 | 0.215 | 0 | 0.17265803 |
| maaf | 0 | 0 | 0 | 0 | 0 | 0 | 0.297 | 0. |
| malam | 0 | 0 | 0 | 0 | 0 | 0.252 | 0 | 0. |
| mari | 0 | 0 | 0 | 0 | 0 | 0 | 0.297 | 0. |
| mohon | 0 | 0.388 | 0 | 0.287 | 0 | 0 | 0 | 0. |
| mudah | 0 | 0 | 0 | 0 | 0 | 0.252 | 0 | 0. |
| operasional | 0 | 0 | 0.318 | 0 | 0 | 0 | 0 | 0. |
| play | 0 | 0 | 0 | 0 | 0 | 0.252 | 0 | 0. |
| plus | 0 | 0 | 0 | 0 | 0 | 0 | 0 | 0.20310526 |
| proses | 0 | 0 | 0 | 0.674 | 0 | 0 | 0 | 0. |
| putar | 0 | 0 | 0 | 0 | 0 | 0 | 0 | 0.20310526 |
| raya | 0 | 0 | 0 | 0 | 0 | 0 | 0.297 | 0. |
| rekening | 0 | 0 | 0 | 0 | 0.623 | 0 | 0 | 0. |
| saku | 0 | 0 | 0 | 0 | 0 | 0.215 | 0 | 0.69063211 |
| saldo | 0 | 0 | 0 | 0 | 0 | 0 | 0 | 0.20310526 |
| selamat | 0 | 0 | 0 | 0 | 0 | 0.215 | 0.252 | 0. |
| sih | 0 | 0 | 0 | 0 | 0 | 0 | 0.297 | 0. |
| store | 0 | 0 | 0 | 0 | 0 | 0.252 | 0 | 0. |
| suci | 0 | 0 | 0 | 0 | 0 | 0 | 0.297 | 0. |
| telepon | 0 | 0.457 | 0 | 0 | 0 | 0 | 0 | 0. |
| terima | 0.664 | 0 | 0 | 0 | 0.206 | 0 | 0 | 0.13429905 |
| top | 0 | 0 | 0 | 0 | 0 | 0 | 0 | 0.20310526 |
| transaksi | 0 | 0 | 0 | 0 | 0 | 0 | 0 | 0.17265803 |
| transfer | 0 | 0 | 0 | 0 | 0.312 | 0 | 0 | 0. |
| tunggu | 0 | 0.388 | 0 | 0.287 | 0 | 0 | 0 | 0. |
| ya | 0 | 0.271 | 0 | 0.2 | 0.37 | 0.15 | 0 | 0.12060814 |
Then, after the V matrix initialize the NMF function. Researchers determined 3 daily topics for every stock code. Table 9 matrix H that formed in python using the function fit_transform.
Table 9: Matrix H
| Topic
Term |
K1 | K2 | K3 |
| 1439 | 0. | 0. | 0.13729885 |
| aplikasi | 0. | 0. | 0. |
| app | 0. | 0. | 0. |
| bank | 0. | 0. | 0. |
| batas | 0. | 0. | 0.13438915 |
| bca | 0. | 0. | 0.10971309 |
| biaya | 0. | 0. | 0. |
| buka | 0. | 0. | 0.13438915 |
| cabang | 0. | 0. | 0.13438915 |
| daerah | 0. | 0. | 0.13438915 |
| download | 0. | 0. | 0. |
| fitri | 0. | 0. | 0.3945226 |
| flazz | 0. | 0. | 0. |
| 0. | 0. | 0. | |
| hai | 0. | 0. | 0. |
| hati | 0. | 0. | 0.13729885 |
| idul | 0. | 0. | 0.25211785 |
| informasi | 0. | 0. | 0. |
| jalan | 0. | 0.15815157 | 0. |
| kait | 0. | 0.15815157 | 0. |
| kasih | 0.87194227 | 0. | 0. |
| kena | 0. | 0. | 0. |
| khawatir | 0. | 0. | 0.13438915 |
| klik | 0. | 0. | 0. |
| konfirmasi | 0. | 0.2298295 | 0. |
| laku | 0. | 0.2298295 | 0. |
| langsung | 0. | 0. | 0. |
| lapor | 0. | 0.15815157 | 0. |
| layan | 0. | 0. | 0.13438915 |
| lengkap | 0. | 0. | 0. |
| libur | 0. | 0. | 0.10971309 |
| link | 0. | 0. | 0. |
| maaf | 0. | 0. | 0.13729885 |
| malam | 0. | 0. | 0. |
| mari | 0. | 0. | 0.13729885 |
| mohon | 0. | 0.35382512 | 0. |
| mudah | 0. | 0. | 0. |
| operasional | 0. | 0. | 0.13438915 |
| play | 0. | 0. | 0. |
| plus | 0. | 0. | 0. |
| proses | 0. | 0.35058814 | 0. |
| putar | 0. | 0. | 0. |
| raya | 0. | 0. | 0.13729885 |
| rekening | 0. | 0. | 0. |
| saku | 0.04123092 | 0. | 0. |
| saldo | 0. | 0. | 0. |
| selamat | 0. | 0. | 0.1121866 |
| sih | 0. | 0. | 0.13729885 |
| store | 0. | 0. | 0. |
| suci | 0. | 0. | 0.13729885 |
| telepon | 0. | 0.2298295 | 0. |
| terima | 0.78323346 | 0. | 0. |
| top | 0. | 0. | 0. |
| transaksi | 0. | 0. | 0. |
| transfer | 0. | 0. | 0. |
| tunggu | 0. | 0.35382512 | 0. |
| ya | 0. | 0.25208896 | 0. |
| 1439 | 0. | 0. | 0.13729885 |
| aplikasi | 0. | 0. | 0. |
| app | 0. | 0. | 0. |
| bank | 0. | 0. | 0. |
| batas | 0. | 0. | 0.13438915 |
| bca | 0. | 0. | 0.10971309 |
Table 10 is matrix W that formed by components_ function.
Table 10: Matrix W
| T1 | T2 | T3 | T4 | T5 | T6 | T7 | T8 | |
| K1 | 0.79 | 0 | 0 | 0 | 0.08 | 0 | 0 | 0.15 |
| K2 | 0 | 0.84 | 0 | 0.83 | 0.06 | 0 | 0 | 0 |
| K3 | 0 | 0 | 0.86 | 0 | 0 | 0 | 0.93 | 0 |
The topic extraction result is used as a daily topic percentage in stock features. Furthermore, the topic value is also used to obtain tweet sentiment values that are included in the highest daily topics. Eq. (8) is the formula to get the topic percentage value.
![]() Table 11 is an illustration of the calculation results for the percentage value of the topic. From the calculation of the percentage of topics, it was found that the highest topic on that day was topic 1 (K1), with the number of tweets as many as 5. Tweets that are incorporated in topic 1 (K1) are T1, T5, T6, and T8 which will then be processed to obtain the value of his sentiment.
Table 11 is an illustration of the calculation results for the percentage value of the topic. From the calculation of the percentage of topics, it was found that the highest topic on that day was topic 1 (K1), with the number of tweets as many as 5. Tweets that are incorporated in topic 1 (K1) are T1, T5, T6, and T8 which will then be processed to obtain the value of his sentiment.
Table 11: Topic Percentage Calculation
| Topic Percentage | |
| K1 | 4/8 = 0.5 |
| K2 | 2/8 = 0.25 |
| K3 | 2/8 = 0.25 |
4.2. Sentiment Analysis
Sentiment analysis was done after preprocessing, where the tweets that be analyzed only tweeted that have the highest topic value on that day. This is done to reduce the number of tweets processed. At this stage the researcher uses LinearSVM in library sklearn SVM Python. The list of negative and positive words used refers to the list of words at https://github.com/masdevid/ID-OpinionWords (Masdevid, 2017). At this stage each tweet in the highest topic on that day will be processed to get the value of sentiment, and its probability. Table 12 is the result of sentiment analysis using Linear SVM.
The results of the probability will be taken as a feature in the formation of sentiment features in the next stage. The Eq. (9) is a formula to get sentiment values.
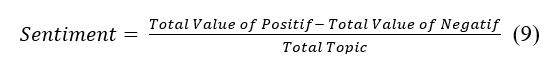 where total value of positive = total percentage value of positive sentiment, total value of negative = total percentage value of negative sentiment obtained from the sentiment analysis process
Table 12: Sentiment Analysis Result
| Topics | Tweets | Sentiment | Probability |
| T1 | terima kasih | 0 | 0.7508999502661317 |
| T5 | hai langsung terima transfer rekening bca rekening bank ya h 1 ya | 0 | 0.7137279798102268 |
| T6 | selamat malam aplikasi saku mudah download aplikasi google play app store ya informasi lengkap klik link | 0 | 0.7278331821231244 |
| T8 | hai top saldo flazz saku transaksi saku saku plus kena biaya informasi lengkap putar saku klik link ya terima kasih | 0 | 0.7946268383337876 |
The Eq. (10) is the result of calculation of sentiment values according to the formula (9).
 4.3. Formation of Stock Features
After obtaining the topic value and tweet sentiment, then we can proceed by forming a stock feature consisting of closing price at T-2, closing price at T-1, closing volume at T-2, closing volume at T-1, total percentage of the highest topic on T-2, total percentage of the highest topic on T-1, sentiment score on T-1, and sentiment score on T-2.
Table 13 is a form of daily stock data obtained from merging price data from Yahoo Finance with the results of sentiment extraction with LinearSVM and topics with NMF.
Table 13: Stock Daily Data of BBRI
| Date | Close | Volume | Sentiment | Topic |
| 8/1/2018 | 3190 | 147098300 | 0.380237 | 0.5 |
| 8/2/2018 | 3250 | 158406800 | 0.13912 | 0.492647 |
| 8/3/2018 | 3330 | 100589700 | 0.009038 | 0.568627 |
| 8/6/2018 | 3410 | 143310900 | 0.261233 | 0.52809 |
| 8/7/2018 | 3350 | 89404000 | 0.449981 | 0.777778 |
| 8/8/2018 | 3330 | 90710200 | 0.485755 | 0.396825 |
| 8/9/2018 | 3330 | 69654300 | 0.312497 | 0.571429 |
| 8/10/2018 | 3390 | 115961500 | 0.142377 | 0.534247 |
| 8/13/2018 | 3140 | 179328600 | 0.443025 | 0.46 |
| 8/14/2018 | 3130 | 154831700 | 0.119308 | 0.565217 |
| 8/1/2018 | 3190 | 147098300 | 0.380237 | 0.5 |
| 8/2/2018 | 3250 | 158406800 | 0.13912 | 0.492647 |
| 8/3/2018 | 3330 | 100589700 | 0.009038 | 0.568627 |
4.4. Support Vector Machine Process
The features that have been formed from Price, Volume, Sentiment and Percentage of topics per day are processed using Python Support Vector Machine library, which is the library from sklearn library in Python. The data collection is divided into 75% training data and 25% testing data for predicting stock price movements with predictive results down and up. Table 14 is the prediction of stock price movements result.
Table 14 : Stock Movement Prediction Results
| Stock Code | RBF | POLY | LINEAR |
| BBCA | 0.5813953488 | 0.4186046512 | 0.4418604651 |
| BBNI | 0.6046511628 | 0.5581395349 | 0.6511627907 |
| BBRI | 0.5348837209 | 0.4651162791 | 0.4186046512 |
| BBTN | 0.5813953488 | 0.5813953488 | 0.6046511628 |
| BMRI | 0.6046511628 | 0.3953488372 | 0.4418604651 |
| EXCL | 0.5348837209 | 0.4651162791 | 0.5813953488 |
| INDF | 0.5348837209 | 0.4651162791 | 0.5813953488 |
| JSMR | 0.7209302326 | 0.2790697674 | 0.6744186047 |
| KLBF | 0.6511627907 | 0.3488372093 | 0.488372093 |
| LPPF | 0.7441860465 | 0.2558139535 | 0.5581395349 |
| PGAS | 0.5813953488 | 0.4186046512 | 0.511627907 |
| SCMA | 0.6976744186 | 0.3023255814 | 0.4418604651 |
| SMGR | 0.5348837209 | 0.4418604651 | 0.5581395349 |
| TLKM | 0.6744186047 | 0.3255813953 | 0.5813953488 |
| UNVR | 0.4418604651 | 0.5348837209 | 0.6279069767 |
| Average | 0.6015503876 | 0.4170542636 | 0.5441860465 |
4.5. Comparison with The Previous Research
In a previous study conducted by Nguyen, Shirai, & Julien Velcin [13], the features were closing prices, sentiments and topic percentages. The addition of volume features can increase the accuracy value to 60.16%, while the previous feature is 57.21%. Table 15 is a comparison of stock movements with previous research.
Table 15 : Comparison Accuracy Results
| Features | RBF | POLY | LINEAR |
| Close Price, Sentiment, Topic [13] | 0.572 | 0.479 | 0.491 |
| Close Price, Sentiment, Topic and Volume | 0.602 | 0.417 | 0.544 |
The predictions results of stock market movements carried out using volume feature have a higher accuracy value compared to previous research without volume feature. LI & Zhu [19] comparing the performance of MA and VMA it was found that the application of technical indicators that used volume information is more effective than the pure price index on the stock market. Furthermore, Investopedia [20] said volume is an important indicator in technical analysis because it is used to measure the value of market movements. If the market has made a strong price move up or down, it can depend on the volume for that period. The higher volume during the price movement, the more significant movement. The analysis of the authors that underlies the addition of volume usage in this study is that if there is a high increase in volume on the previous day, then it can be interpreted that there are many investor’s interests in that stock so it can affect the next day price. Other, result of Pearson correlation analysis is 0,1857, for value under 0.5 said that it has weak relation between price and volume.
5. Conclusion
The features proposed in this study are closing price at T-2, closing price at T-1, closing volume at T-2, closing volume at T-1, total percentage of the highest topic on T-2, total percentage of the highest topic on T-1, sentiment score on T-1, and sentiment score on T-2. The process of predicting stock market movements using SVM with the RBF kernel has the highest level of accuracy. It is proven that the addition of volume features can increase the accuracy value to 60.16%.
- R. Jadhav and M. S. Wakode, “Survey : Sentiment Analysis of Twitter Data for Stock Market Prediction,” IJARCCE Vol. 6, Issue 3, pp. 558-562, 2017.
- J. Bollen, H. Mao and X.-J. Zeng, “Twitter mood predicts the stock market,” IEEE Computer, pp. 91-94, 2010.
- Bursa Efek Indonesia, “Sekilas Saham,” 2017. [Online]. Available: http://yuknabungsaham.idx.co.id/sekilas-saham-detail.php. [Accessed 23 Juni 2017].
- D. Sonachalam, “Using Twitter to predict Stock Market Returns (August 2015),” International Journal of Scientific & Engineering Research, Volume 6, Issue 10, October-2015, pp. 76-77, 2015.
- A. L. Alves, C. d. S. Baptista, A. A. Firmino, M. G. d. Oliveira and A. C. d. Paiva, “A Comparison of SVM Versus Naive-Bayes Techniques for Sentiment Analysis in Tweets: A Case Study with the 2013 FIFA Confederations Cup,” WebMedia ’14 Proceedings of the 20th Brazilian Symposium on Multimedia and the Web, pp. 123-130, 2014.
- D. Godfrey, C. Johns, C. Sadek, C. Meyer and S. Race, “A Case Study in Text Mining: Interpreting Twitter Data From World Cup Tweets,” arXiv preprint arXiv:1408.5427, 2014.
- L. F. Coletta, E. R. Hruschka, N. Felix and E. R. Hruschka, “Combining Classification and Clustering for Tweet Sentiment Analysis,” Brazilian Conference on Intelligent Systems (BRACIS-2014), pp. 210-215, 2014.
- Sinarmas Sekuritas, “Unduh Daftar Saham LQ45,” Agustus 2018. [Online]. Available: http://www.sinarmassekuritas.co.id/uploads/filelist/2018/daftar-saham-lq-45_1.pdf. [Accessed 1 Januari 2018].
- P. Mayadewi and E. Rosely, “Prediksi Nilai Proyek Akhir Mahasiswa menggunakan Algoritma Klasifikasi Data Mining,” Seminar Nasional Sistem Informasi Informasi 2-3 November 2015, pp. 329-334, 2015.
- J. Han and M. Kamber, Data Mining Concepts & Techniques 2nd Edition, San Fransisco: Elsevier, 2006.
- D. Powers, “Evaluation: From Precision, Recall, and F-Measure to ROC, Infomedness, Markedness & Correlation,” Journal of Machine Learning Technologies, pp. 37-63, 2011.
- Scikit-learn, “Scikit-learn Documentation: sklearn.decomposition.NMF,” 2011. [Online]. Available: https://scikit-learn.org/stable/modules/generated/sklearn.decomposition.NMF.html. [Accessed 3 3 2019].
- Masdevid, “List of Opinion Words (positive/negative) in Bahasa Indonesia for Sentiment Analysis,” 24 March 2017. [Online]. Available: https://github.com/masdevid/ID-OpinionWords. [Accessed 20 3 2019].
- Y. Zhu, L. Jing and J. Yu, “Text Clustering via Constrained Nonnegative Matrix Factorization,” 11th IEEE International Conference on Data Mining, pp. 1278-1283, 2011.
- E. Suwandi, “Prediksi Indeks Harga Saham Gabungan (IHSG) dengan Pendekatan Least Squares Support Vector Machines,” Universitas Bina Nusantara, Jakarta, 2014.
- F. Shahnaz, M. W. Berry, V. P. Pauca and R. J. Plemmons, “Document clustering using nonnegative matrix factorization,” Information Processing and Management 42, pp. 373-386, 2006.
- Z. Niu, Z. Yin and X. Kong, “Sentiment Classification for Microblog by Machine Learning,” Fourth International Conference on Computational and Information Sciences, pp. 286-289, 2012.
- T. H. Nguyen, K. Shirai and Julien Velcin, “Sentiment Analysis on Social Media for Stock Movement Prediction,” Expert Systems With Applications Volume 42, Issue 24, pp. 9603-9611, 2015.
- G. LI and J. Zhu, “Research on the Effectiveness of Technical Indicators with the Volume,” International Conference on Education, Management and Computing Technology (ICEMCT 2014), pp. 436-439, 2014.
- R. Jadhav and M.S.Wakode, “Survey:Sentimen Analysis of Twitter Data for Stock Market Prediction,” International Journal of Advanced Research in Computer and Communication Engineering Vol.6 Issue 3, pp. 558-562, 2017.